Resources and green transformation in European Neighbourhood South countries
Data extracted in March 2024. Planned article update: March 2025.
Highlights
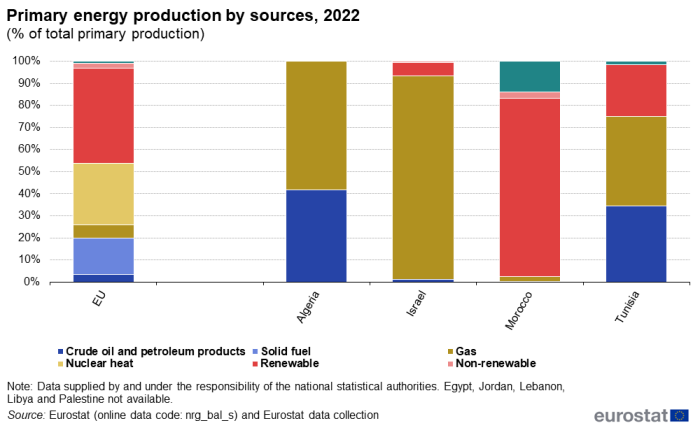
In 2022, Morrocco's primary energy production consisted mainly of renewables, with close to 81% of its total primary energy production.
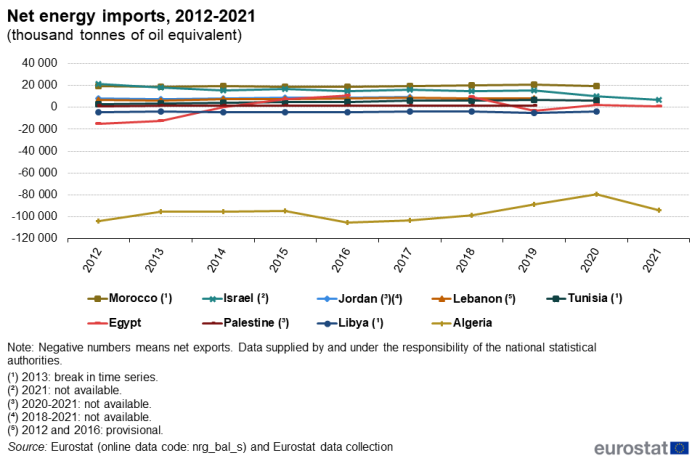
In 2021, Algeria was the only net exporter of energy among the European Neighbourhood Policy-South countries for which data are available, with net energy exports of 94 million tonnes of oil equivalent.
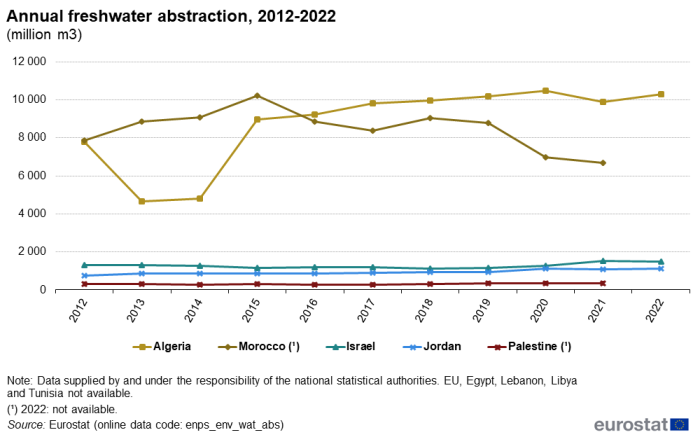
In 2022, Algeria's water abstraction was 10 275 million cubic meter of freshwater, the highest among the European Neighbourhood Policy-South countries for which data are available.
This article is part of an online publication. It provides data on environmental and energy statistics for nine of the countries that form the European Neighbourhood Policy-South (ENP-South) region — Algeria, Egypt, Israel, Jordan, Lebanon, Libya, Morocco, Palestine [1] and Tunisia. Cooperation with Syria is currently suspended. Lebanon data does not account for Palestinian refugee camps in Lebanon.
The article presents a range of resources and green transformation indicators such as greenhouse gas emissions, annual freshwater abstraction, primary energy production, net import of energy and gross inland energy consumption.
Energy is a political priority issue due to various reasons. These include the fluctuation in energy prices, disruptions in energy supplies, and growing concerns about how human activities affect climate change, especially the rise in greenhouse gas emissions.
The ENP-South countries experience many of the environmental issues faced globally. Issues like water quality, water scarcity, soil erosion, and desertification are particularly significant. Water is vital for life and plays a crucial role in the economy, especially in agriculture. However, it is becoming increasingly scarce in many ENP-South countries.
Full article
Greenhouse gas emissions
Greenhouse gas emissions refer to the release of gases into Earth's atmosphere that trap heat, contributing to the greenhouse effect and global warming. These gases include carbon dioxide (CO2), methane (CH4), nitrous oxide (N2O), and fluorinated gases. The basic data are annual emissions estimated and reported according to the Intergovernmental Panel on Climate Change (IPCC) guidelines.
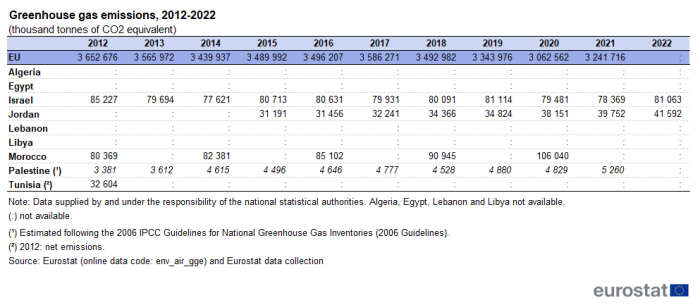
Table 1 shows the amount of greenhouse gas emissions, in thousand tonnes CO2 equivalent, over the period 2012-2022.
Israel was the only ENP-South country, for which data are available, which recorded a decrease of its CO2 emissions over the last decade, with emissions dropping from 85 million tonnes in 2012 to 81 million tonnes in 2022. Jordan's emissions constantly increase over eight years, from 31 million tonnes in 2015 to 42 million tonnes in 2022. Similarly, Morocco grew from 80 million tonnes in 2012 to 106 million tonnes of the CO2 emissions in 2020 (latest data available), the highest greenhouse gas emissions measured among the ENP-South countries. Data for Palestine show significant increase in CO2 emissions from 2012 to 2021 (no data is available for 2022) by 56%, standing at 5 million tonnes in 2021, which is still at lower levels than in the other ENP-South countries. Tunisia data is only available for 2012, thus seriously limiting the comparison between the country and other ENP-South countries. In 2012, Tunisia emitted 32 million tonnes of CO2, an emission level below the level of Israel and Morocco but above Palestine.
In 2021 (no 2022 data available), the EU generated 3.2 billion tonnes of CO2 equivalents, showing a decline in greenhouse gas emissions compared to 2012, when they were at 3.7 billion tonnes. A low point was recorded in 2020, at 3.1 million tonnes. This trend suggests a commitment to reducing greenhouse gas output, which aligns with various EU environmental policies and initiatives aimed at combatting climate change.
(thousand tonnes CO2 equivalent)
Source: Eurostat (env_air_gge) and Eurostat data collection.
Annual freshwater abstraction
Figure 1 compares annual freshwater use data from 2012 to 2022, in million cubic metres (m3). 'Annual freshwater use' is a measure of how much freshwater is used in a year by end users like households, services, agriculture, and industry for purposes such as domestic use, irrigation or industrial processing.
After a decrease between 2012 and 2013, freshwater abstraction constantly increased in Algeria between 2013, when a low point was observed at 4.6 billion m3, and 2020, when a peak was recorded at 10.5 billion m3. In 2022, 10.3 billion m3 of freshwater were abstracted in Algeria.
In Morocco, freshwater abstraction increased every year between 2012 and 2015, when it reached a peak at 10.2 billion m3. Since then, freshwater abstraction dropped, except in 2018, to reach a low point at 6.7 million m3 in 2021 (no 2022 data available). Israel maintained relatively steady levels of freshwater abstraction over the period 2012-2022, with volumes between 1.1 billion m3 in 2018 and 1.5 billion m3 in 2021 and 2022.
Between 2012 and 2022, freshwater abstraction constantly increased in Jordan, except in 2021, when it slightly decreased and 2016 when it remained unchanged from the previous year. The volumes ranged from 0.7 billion m3 in 2012 to 1.1 billion m3 in 2020, 2021 and 2022.
Palestine maintained relatively stable levels of freshwater abstraction over the period 2012-2021 (no 2022 data available), between 0.3 and 0.4 billion m3.
Municipal waste generated
Municipal waste primarily originates from households, but also includes similar waste from distributive trades, offices, and public institutions. However, waste from agriculture and industry is not considered in this indicator. Municipal waste is collected and disposed of by municipal authorities through the waste management system. In areas without municipal waste collection, reporting countries estimate the amount of waste generated.
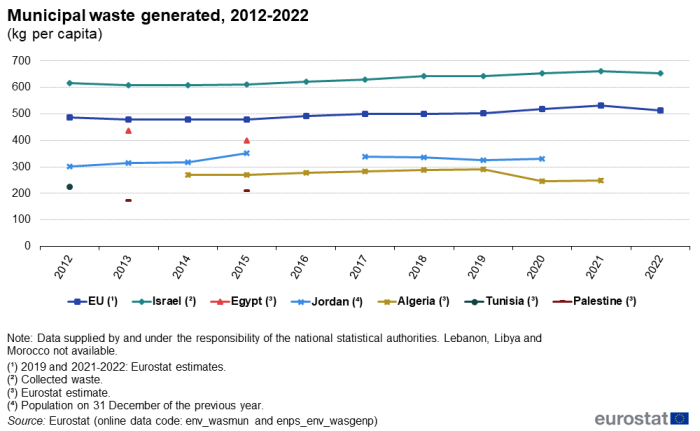
Figure 2 presents the evolution of the municipal waste generated over the period 2012-2022, in kilogramme per capita (kg/inhabitant).
In Israel, the municipal waste generated remained relatively steady over the period 2012-2022, between 609 kg per capita in 2013-2014 and 662 kg per capita in 2021. In 2022, a decline of 1.1% was observed compared to 2021, to reach 655 kg per capita.
In Egypt, municipal waste generated dropped from 436 kg per capita in 2013 to 400 kg per capita in 2015. Data are available for those two years only.
In Jordan, municipal waste generated increased between 2012 and 2015, when a peak was observed at 352 kg per capita. Between 2017 and 2019, municipal waste generated decreased every year, then grew again in 2020, to reach 330 kg per capita. Data are not available for 2016, 2021 and 2022.
After decreasing in 2015 compared to 2014, municipal waste generated in Algeria constantly increased between 2016 and 2019, when a peak was reached at 292 kg per capita. In 2020, municipal waste generated decreased substantially (-16.1%), reaching a low point at 245 kg per capita. In 2021, municipal waste generated increased slightly by 1.1%, to the amount of 248 kg per capita.
In Tunisia, municipal waste generated accounted for 225 kg per capita in 2012 (no more recent data available).
In Palestine, municipal waste generated rose from 172 kg per capita in 2013 to 208 kg per capita in 2015. Data are available only for those two years.
Data for Lebanon, Libya and Morocco are not available.
After decreasing in 2013 and 2014, compared with previous years, municipal waste generated constantly increased in the EU until 2021, when it reached 513 kg per capita. In 2022, a decrease of 3.6% was recorded to the amount of 513 kg per capita.
(kilogrammes per inhabitant)
Source: Eurostat (env_wasmun) and (enps_env_wasgenp)
Primary energy production by sources
Energy commodities extracted or captured directly from natural resources are called primary energy sources, while energy commodities which are transformed from primary energy sources are called derived products. Primary energy sources cover the extraction of coal and other solid fuels; exploitation of oil and natural gas fields; production by nuclear and hydroelectric power plants; and renewables. The primary production of crude oil is defined as the quantity of fuel extracted or produced within national boundaries, including offshore production. Primary production of natural gas is defined as the quantity of dry gas, measured after purification and extraction of natural gas liquids and sulphur. Energy transformed from one form to another, such as electricity or heat generation in thermal power plants, is not considered as primary production of energy. Energy is often measured in tonnes of oil equivalent (toe).
The amount of energy produced can vary greatly from year to year, due to shifts in energy demand influenced by factors such as economic conditions and weather patterns. Changes in energy prices, determined by global supply and demand, also play a significant role. Additionally, weather conditions, especially for hydroelectric power, can impact energy production.
Figure 3 shows the share of primary energy production by sources in the total primary energy production in 2022.
In Algeria, crude oil and petroleum products (41.8%) and natural gas (58.1%) provided almost all national primary energy production in 2022. In Israel, natural gas provided 92.5%, renewables 5.9% and crude oil and petroleum products less than 1% of primary production in 2022.
In 2022, renewables played a significant role in primary energy production in Morocco contrary to other ENP-South countries, accounting for 80.8% of its total primary energy production, while both natural gas and non-renewable sources contributed to less than 3% each. Renewable in primary energy production is crucial to energy sovereignty and green transformation and Morocco stands out as a leader in this effort among the ENP-South countries. Morocco's share of renewable is almost twice as high as the EU's share, both having renewable as the main energy source in their primary energy production.
In Tunisia, renewables accounted for 23.6%; crude oil and petroleum products accounted for 34.6%; and natural gas for 40.4%.
Data for Egypt, Jordan, Lebanon, Libya and Palestine are not available.
The structure of primary energy production in the EU is relatively varied, reflecting the availability of fossil fuel deposits and the potential for hydro power, as well as policies concerning the production of nuclear energy and energy from renewable sources. In 2022, the major sources of primary energy in the EU were renewables (43.2%) and nuclear heat (27.6%). Solid fuels accounted for 16.4% of the primary energy production, while natural gas accounted for 6.2% and crude oil and petroleum products for 3.3%.
(% of total primary production)
Source: Eurostat (nrg_bal_s) and Eurostat data collection.
Net import of energy
Net energy imports are calculated as the quantity of energy imports minus the equivalent quantity of exports. Imports represent all entries into the national territory, excluding transit quantities (notably via gas and oil pipelines). Exports similarly cover all quantities exported from the national territory. Negative numbers indicate net exports.
Figure 4 presents data on the net import of energy in thousand tonnes of oil equivalent (toe) for the period 2012-2021.
Out of the nine ENP-South countries for which data are available, five showed a relatively steady trend in the net energy imports over the available period: Morocco, from 19.5 million toe in 2012 to 19.1 million toe in 2020 (more recent data not available); Jordan, from 8.0 million toe in 2012 to 9.3 million toe in 2017 (more recent data not available); Lebanon, from 7.1 million toe in 2012 to 7.9 million toe in 2019 (more recent data not available) and Palestine, from 1.2 million toe in 2012 to 1.7 million toe in 2019 (more recent data not available). Tunisia's net imports of energy increased significantly, from 3.0 million toe in 2012 to 5.9 million toe in 2020 (more recent data not available), suggesting either an increase in energy demand or a decrease in energy production. Morocco, Tunisia, Lebanon, Palestine and Jordan were steady energy importers while Libya was a constant net energy exporter.
In Israel, net energy imports gradually decreased over the years, from 21.7 million toe in 2012 to 6.5 million toe in 2021, reflecting a decreasing energy demand.
Egypt was a net exporter in 2012 (15.1 million toe of net energy export), 2013 (12.2 million toe) and 2019 (2.9 million toe), indicating lower levels of energy demand or higher levels of energy production. The lowest value as net energy importer was recorded in 2014, at 0.5 million toe, while the highest value was recorded in 2016 (10.6 million toe). In 2021, the net energy imports were down to 1.1 million toe.
Other net exporters were Algeria and Libya, which reported higher exports than imports over the whole period (2021 data not available for Libya). In Algeria, net exports fluctuated, between 105.5 million toe in 2016 and 79.2 million toe in 2020. In 2021, the net energy exports were at 94.1 million toe. Libya's net energy exports was positive over the period, ranging between 3.6 million toe in 2013, and 5.1 million toe in 2019. In 2020 (most recent data available), net energy exports were at 3.8 million toe.
Net energy imports in the EU fluctuated over the period 2012-2021, with a peak in 2019 at 908.2 million toe and a low point in 2020 at 792.6 million toe. The figures suggest the EU's heavy reliance on energy imports, although a notable decrease occurred in 2020, which could be partially due to a downturn in energy demand during the COVID-19 pandemic.
(thousand tonnes oil equivalent)
Source: Eurostat (nrg_bal_s) and Eurostat data collection.
Gross inland energy consumption
Gross inland energy consumption is the energy that a country requires to meet its internal (national) demand. It covers consumption by the energy sector itself; distribution and transformation losses; final energy consumption by end users; non-energy use by end users (such as feedstock for the petrochemical industry, lubricants); and statistical differences. It represents the total energy demand of a country or region from all sources necessary to satisfy inland consumption.
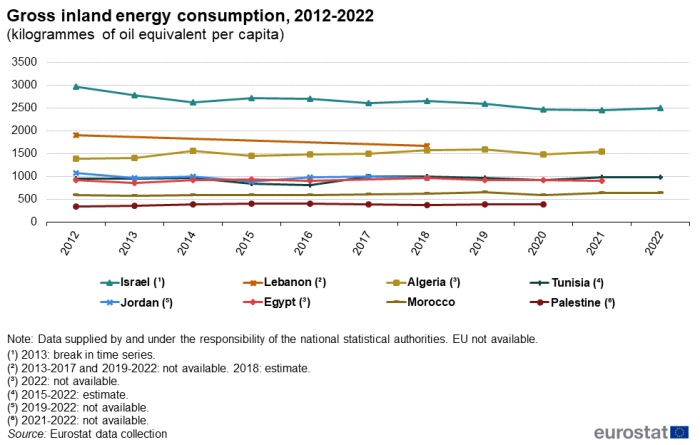
Figure 5 shows the development of gross inland energy consumption over the period 2012-2022, in kilogrammes of oil equivalent (kgoe) per capita.
Gross inland energy consumption in Israel decreased almost every year, from 2 973 kgoe per capita in 2012 to 2 499 kgoe per capita in 2022. Exceptions were in 2015, 2018 and 2022, when it increased compared to the previous year. In Lebanon, gross inland energy consumption decreased from 1 914 kgoe per capita in 2012 to 1 670 kgoe per capita in 2018. Data are available only for those two years. Gross inland energy consumption in Algeria increased every year over the period 2012-2021 (no 2022 data available), except in 2015 and 2020, from 1 388 kgoe per capita in 2012 to 1 556 kgoe per capita in 2022.
In Tunisia, ups and downs in gross inland energy consumption per capita were observed over the period 2012-2022. A low point was reached in 2016 at 807 kgoe per capita whereas a peak was observed in 2018, at 998 kgoe per capita. In 2022, gross inland energy consumption was estimated at 982 kgoe per capita.
In Jordan, gross inland energy consumption trend was irregular, from 1 074 kgoe per capita in 2012, reaching a low point in 2015 at 900 kgtoe per capita, to 976 kgtoe per capita in 2018 (more recent data are not available).
In Egypt, gross inland energy consumption trend was mostly decreasing, despite two consecutive years of growth in 2014 and 2015. In 2012, gross inland energy consumption was at 927 kgoe per capita, peaked at 965 kgoe per capita in 2018 and went down to 910 kgoe per capita in 2021 (no 2022 data available).
In Morocco, gross inland energy consumption was relatively stable over the period 2012-2022, recording 590 kgoe per capita in 2012, reaching a peak in 2019 at 653 kgoe per capita before declining to 638 kgoe per capita in 2022.
In Palestine, gross inland energy consumption constantly increased between 2012 and 2016, reaching a peak at 415 kgoe per capita. Then, it decreased every year except 2019, and stood at to 390 kgoe per capita in 2020 (more recent data not available). Data for Libya are not available.
Renewable energy in gross final energy consumption
Gross final energy consumption is the total energy consumed by end users, such as households, industry and agriculture. It is the energy which reaches the final consumer's door. Energy consumption by the energy sector itself is therefore not included in the definition of final energy consumption.
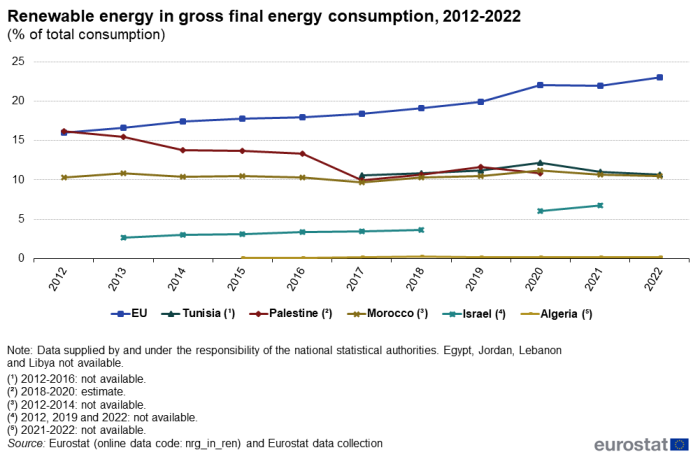
Figure 6 presents the proportion of renewable energy used in gross final energy consumption over the period 2012-2022.
In Tunisia, the share of renewable energy used increased constantly between from 10.6% in 2017 (no data prior to 2017 available) to 12.2% in 2020 but decreased in 2021 and 2022 to 10.7%.
Palestine had the highest share of renewable energy use in 2012 among the countries for which data are available, accounting for 16.2% of total energy consumption. This share progressively declined to 9.9% in 2017, but rebounded in 2018 and 2019, and declined again in 2020 to 10.9% (more recent data are not available).
Morocco experienced fluctuations in the share of renewable energy in gross final energy consumption between 2012 and 2022. It was 10.3% in 2012, decreased to a low point in 2017 at 9.7%, rose to a peak of 11.2% in 2020, and then declined to 10.5% in 2022.
In Israel, the share of renewable energy in gross final energy consumption constantly increased from 2.7% in 2013 to 6.8% in 2021 (2012, 2019 and 2022 data are not available).
In Algeria, the use of renewable energy in gross final energy consumption was marginal at 0.1% or 0.2% between 2015 and 2022 (no data available prior to 2015).
The EU showed a relatively constant increase in the share of renewable energy in gross final energy consumption, from 16.0% in 2012 to 23.0% in 2022, reflecting a consistent shift towards more sustainable energy sources.
(% of total consumption)
Source: Eurostat (nrg_in_ren) and Eurostat data collection.
Source data for tables and graphs
Data sources
The data for ENP-South countries are supplied by and under the responsibility of the national statistical authorities of each country on a voluntary basis. The data that are presented in this article result from an annual data collection cycle that has been established by Eurostat. Cooperation with Syria is currently suspended. These statistics are available free-of-charge on Eurostat's website, together with a range of different indicators covering most socio-economic areas.
Energy
For EU statistics, the main legislation covering the collection of statistics in relation to energy quantities is Regulation (EC) No 1099/2008 of the European Parliament and of the Council of 22 October 2008 on energy statistics. Since its adoption, it has been amended several times and a consolidated version is available. A summary of the relevant legislation is also available on Eurostat's website, under 'Legislation' on the dedicated section for Energy statistics.
Environment
Eurostat, in close partnership with the European Environment Agency (EEA), provides environmental statistics, accounts and indicators supporting the development, implementation, monitoring and evaluation of the EU's environmental policies, strategies and initiatives. Data on greenhouse gas emissions as reported under the United Nations framework convention on climate change (UNFCCC) are collected by the EEA. Eurostat collects official statistics in relation to a broad selection of subject areas, for example, waste, water, material flows and environmental protection expenditure.
The Kyoto Protocol, an environmental agreement adopted by many of the parties to the UNFCCC in 1997 to curb global warming, covers six greenhouse gases: carbon dioxide (CO2), methane (CH4) and nitrous oxide (N2O), which are non-fluorinated gases, and hydrofluorocarbons (HFCs), perfluorocarbons (PFCs) and sulphur hexafluoride (SF6), which are fluorinated gases. Converting them to carbon dioxide equivalents makes it possible to compare them and to determine their individual and total contributions to global warming. A new agreement on greenhouse gas emissions was reached in Paris in late 2015; this provides the basis for emissions mitigation and adaptation from 2020 onwards.
Eurostat's data on waste is collected from EU Member States on the basis of Regulation (2150/2002/EC) on waste statistics and is published every two years in line with common methodological recommendations. Landfill is the deposit of waste into or onto land; it includes specially engineered landfill sites and temporary storage of over one year on permanent sites. The definition covers both landfill in internal sites, in other words, where a generator of waste is carrying out its own waste disposal at the place of generation and in external sites.
The collection of water statistics within the EU is based on information demands linked to the Directive 2000/60/EC Water Framework Directive (WFD). Eurostat and the OECD jointly administer a questionnaire on inland waters among EU Member States, candidate countries and potential candidates. Data collection is voluntary although there is an initiative to establish a legal framework for the collection of water statistics.
A large amount of data and other information on water is accessible via WISE, the water information system for Europe, which is hosted by the European Environment Agency (EEA) in Copenhagen.
Context
The EU's long-term strategy for reducing greenhouse gas emissions was laid out in November 2018, with the aim of making Europe the world's first climate-neutral continent by 2050. In December 2019, the European Commission presented the European Green Deal, set out in Communication COM(2019) 640 final. The European Green Deal is a growth strategy that aims to transform the EU into a fair and prosperous society, with a modern, resource-efficient and competitive economy where there are no net emissions of greenhouse gases by 2050 and where economic growth is decoupled from resource use. The Green Deal is an integral part of this Commission's strategy to implement the United Nation's 2030 Agenda and the Sustainable Development Goals.
In June 2021, the European Climate Law, Regulation (EU) 2021/1119, was adopted. The European Climate Law makes the goal set out in the European Green Deal to become climate-neutral by 2050 a legal obligation for the EU and its Member States. It sets the framework for actions for reducing greenhouse gas emissions by at least 55% levels by 2030, compared with 1990 levels, and reach climate neutrality in the EU by 2050. The Climate Law is complemented by the European Climate Pact and the 2030 Climate Target Plan, enabling the EU to move towards a climate-neutral economy and implement its commitments under the Paris Agreement.
In order to deliver the European Green Deal and reduce the EU's greenhouse gas emissions by 55% by 2030, the European Commission proposed the 'Fit for 55' package in June 2021 which is a legally binding milestone laid down in the European Climate Law. The 'Fit for 55' package is the EU's key plan to turn the climate goals into EU law and comprises a set of proposals for revision of existing legislation and new initiatives in a wide range of areas. By October 2023, the final legislation of the 'Fit for 55' package had been adopted. The Joint Communication on Renewed Partnership with the Southern Neighbourhood – A new Agenda for the Mediterranean, accompanied by an Economic and Investment Plan for the Southern neighbours, of 9 February 2021 further guides cooperation with the ENP-South countries. Additional information on the policy context of the ENP is provided on the website of Directorate-General European Neighbourhood Policy and Enlargement Negotiations (DG NEAR).
In cooperation with its ENP partners, Eurostat has the responsibility to promote and implement the use of European and internationally recognised standards and methodology for the production of statistics, necessary for designing and monitoring policies in various areas. Eurostat manages and coordinates EU efforts to increase the capacity of the ENP countries to develop, produce and disseminate good quality data according to European and international standards.
Reliable and comparable data are essential for evidence-based decision-making. They are needed to monitor the implementation of the agreements between the EU and the ENP-South countries, the impact of policy interventions and the reaching of the Sustainable Development Goals (SDGs).
The main objective of Euro-Mediterranean cooperation in statistics is to enable the production and dissemination of reliable and comparable data, in line with European and international norms and standards.
The EU has been supporting statistical capacity building in the region for a number of years through bilateral and regional activities to strengthen statistical capacity. This takes the form of technical assistance to partner countries' national statistical authorities through targeted assistance programmes, such as the MEDSTAT programme (currently in its fifth cycle: MEDSTAT V (2022-2025), and activities such as training courses, working groups and workshops, exchange of best practice and the transfer of statistical know-how..
Direct access to
- All articles on non-EU countries
- European Neighbourhood Policy countries — statistical overview — online publication
- Statistical cooperation — online publication
- All articles on energy
- EU Energy statistics - an overview
- Climate change - driving forces
- Environment statistics introduced
- Waste statistics
- Water statistics
Books
Factsheets
- Statistics for a green future — factsheets on European Neighbourhood policy-South Countries — 2022 edition
- Basic figures on the European Neighbourhood Policy-South countries — 2022 edition
- Basic figures on the European Neighbourhood Policy-South countries — 2021 edition
Leaflets
- Basic figures on the European Neighbourhood Policy — South countries — 2020 edition
- Basic figures on the European Neighbourhood Policy — South countries — 2019 edition
- Basic figures on the European Neighbourhood Policy — South countries — 2018 edition
- Basic figures on the European Neighbourhood Policy — South countries — 2016 edition
- Basic figures on the European Neighbourhood Policy — South countries — 2015 edition
- International trade in goods for the European neighbourhood policy-South countries — 2018 edition
Factsheets
- Southern European Neighbourhood Policy countries (ENP-South) (enps) (ESMS metadata file — enps_esms)
- Greenhouse gas emissions by source sector (source: EEA) (ESMS metadata file — env_air_gge)
- Water statistics on national level (env_nwat) (ESMS metadata file — env_nwat)
- Municipal waste by waste management operations (ESMS metadata file — env_wasmun)
- Energy statistics — supply, transformation and consumption (ESMS metadata file — nrg_quant)
- European External Action Service — Middle South and North Africa (MENA)
- European External Action Service — European Neighbourhood Policy
- European Commission — Energy
- European Commission — Environment
- European Commission — A European Green Deal
- European Commission — Climate action
- European Commission — Forest strategy
- European Commission — Water
- International Energy Agency (IEA) —World Energy Outlook 2023
- MEDSTAT
Notes
- ↑ This designation shall not be construed as recognition of a State of Palestine and is without prejudice to the individual positions of the EU Member States on this issue.
