Archive:Functional and activity limitations statistics
Data extracted in: November 2022.
Planned article update: December 2023.
Highlights
About a quarter of the EU population experienced long-standing activity limitations due to health problems in 2021.
In 2021, males in the EU were less likely than females to report long-standing activity limitations.
Close to half of all persons in the EU aged 65 years or over reported limitations in household activities in 2019.
(%)
Source: Eurostat (hlth_silc_12)
This article presents an overview of limitations due to health issues reported by people in the European Union (EU). The first section focuses on general long-standing limitations in usual activities due to health problems. The second section looks at three specific types of limitations: functional (physical and sensory) limitations; limitations in personal care activities; and limitations in household activities. The third section is about care services provided to people with health problems at their homes. Data on functional and activity limitations are used as measures of disability (see the 'data sources' section for more information).
- The data concerning general long-standing limitations in usual activities due to health problems come from the EU statistics on income and living conditions (EU-SILC), relate to the 2021 reference year and cover persons aged 16 years or over.
- The data concerning specific types of functional and activity limitations and care services provided to people with health problems at their homes come from the European health interview survey (EHIS), relate to the 2019 reference year and cover persons aged 15 years or over.
This article is one of a set of statistical articles concerning health status in the EU which forms part of an online publication on health statistics.
Full article
Self-reported long-standing limitations in usual activities due to health problems
About one quarter of the EU population experienced long-standing limitations
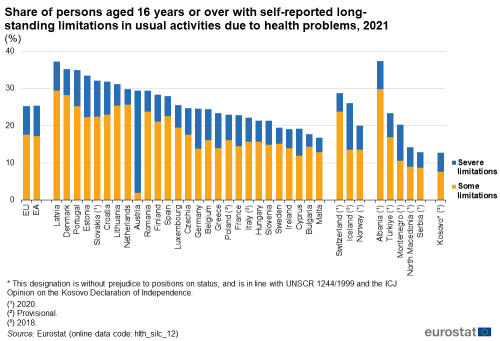
In the EU, 25.2 % of the population reported (some or severe) long-standing limitations in their usual activities due to health problems (hereafter referred to as long-standing limitations) in 2021; 17.6 % reported some long-standing limitations and 7.6 % reported severe long-standing limitations – see Figure 1.
Across the EU Member States in 2021, the share of people who reported some or severe long-standing limitations ranged from 16.7 % in Malta and 17.7 % in Bulgaria to 37.1 % in Latvia. By far the highest share of people reporting severe long-standing limitations (27.5 %) was registered in Austria, which was also where, by far, the lowest share of people reporting some long-standing limitations was registered (1.9 %). Estonia (11.2 %) and Germany (10.8 %) were the only other Member States where at least 10.0 % of the population reported severe long-standing limitations.
(%)
Source: Eurostat (hlth_silc_12)
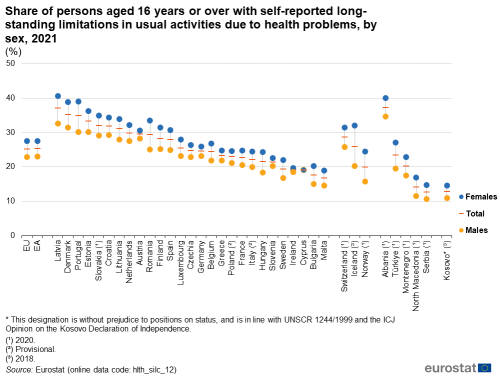
In 2021, males were less likely than females to report long-standing limitations – either some or severe – in nearly all of the EU Member States – see Figure 2. The largest gender gaps were recorded in Portugal, Romania and Latvia (more than 8.0 percentage points). Cyprus was an exception, as it had identical shares for males and females.
(%)
Source: Eurostat (hlth_silc_12)
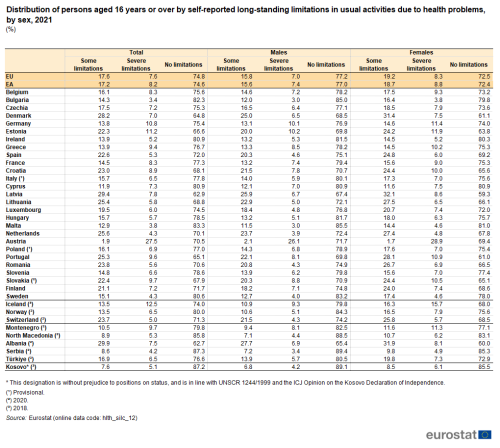
A further analysis shows that this gender gap was present in the EU in 2021 regardless of the severity of the limitations – see Table 1. The share of the population reporting severe long-standing limitations was 1.3 percentage points higher among females than among males, while for some long-standing limitations the gender gap was 3.4 percentage points.
- The gender gap for severe long-standing limitations was 2.8 percentage points in Austria and Portugal. Ireland was again an exception, with a slightly higher share for males than for females (0.1 percentage points difference).
- The gender gap for some long-standing limitations was highest in Denmark (6.4 percentage points), Latvia (6.2 percentage points) and Portugal (6.0 percentage points). Austria and Cyprus were the only EU Member States where the share was higher for males than for females (0.4 and 0.5 percentage points difference, respectively).
In this context, it should be remembered that the data are not age standardised and that a greater proportion of females than males are very old.
(%)
Source: Eurostat (hlth_silc_12)
More older people reported long-standing limitations than did younger people and the gender gap was also wider for older people
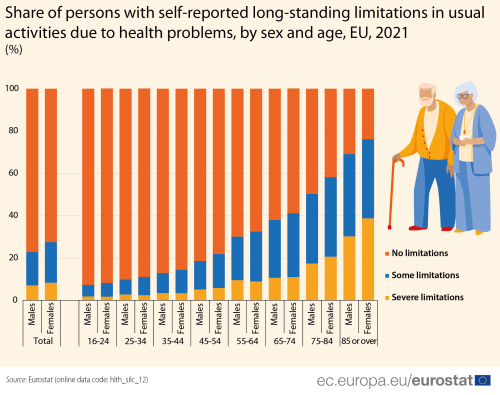
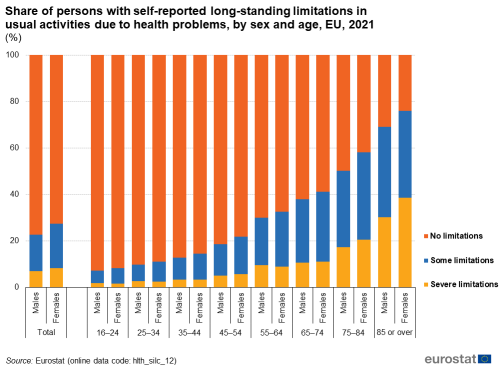
Self-reported long-standing limitations also have a distinct age pattern as people in higher age groups were more likely to report some or severe long-standing limitations than those in lower age groups – see Figure 3. In 2021, 7.7 % of the age group 16–24 years reported (some or severe) long-standing limitations, a share that was 73.6 % for people aged 85 years or over.
A gender health gap concerning (some and severe) long-standing limitations could be observed in all age groups in the EU in 2021.
- The gap was lowest for the youngest age groups (16–24, 25–34 and 35–44 years), with shares 0.8–1.6 percentage points higher for females.
- It was somewhat higher for the three age groups from 45 to 74 years, with shares 2.4–3.3 percentage points higher for females.
- It was notably higher among older people: 7.9 percentage points higher for females in the age group 75–84 years and 7.0 percentage points higher for females aged 85 years or over.
However, when focusing just on people reporting severe long-standing limitations, the gender gap in the EU in 2021 was relatively small (less than 1 percentage points) up to and including the age group 65–74 years and for some age groups reflected higher shares for males than for females. However, there was a larger gender gap for severe long-standing limitations in the age groups 75–84 years and 85 years or over as the shares for females were 3.2 and 8.5 percentage points, respectively, higher than for males.
(%)
Source: Eurostat (hlth_silc_12)
People with higher income levels were less likely to report long-standing limitations
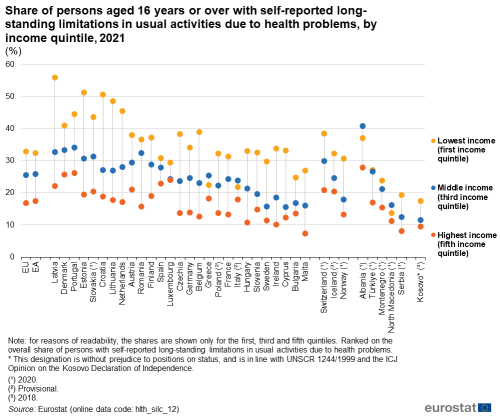
In the EU, 32.9 % of the population in the first income quintile (the 20 % of the population with the lowest income) reported long-standing limitations in 2021, compared with 30.6 % for the second quintile, 25.5 % for the third (middle) quintile, 21.2 % for the fourth quintile and 16.8 % for fifth (highest) income quintile (the 20 % of the population with the highest income). In other words, the prevalence of self-reported long-standing limitations was highest in the lowest income quintile and was progressively lower among higher income quintiles.
Figure 4 shows the share of the population that reported long-standing limitations and its relation to income: for reasons of readability, the figure shows the shares for the lowest, middle and highest quintiles only.
In 2021, almost all EU Member States showed a similar pattern to that observed for the EU: higher shares of people who reported long-standing limitations were recorded for the first (lowest) income quintile and lower shares for the fifth (highest) income quintile, while the shares for the third income quintile were in between – see Figure 4. Only two Member States deviated from this pattern: the population in the third income quintile was more likely to report long-standing limitations than the population in the lowest income quintile in Greece and Italy. It should be noted that this is a similar situation to that observed for self-perceived health status, where these two Member States were the exceptions to the general pattern that the share of the population reporting good or very good health was lowest among people in the first income quintile.
(%)
Source: Eurostat (hlth_silc_12)
The largest differences in the share of the population reporting long-standing limitations between the populations in the lowest and highest income quintiles in 2021 were observed in Latvia (33.7 percentage points), Croatia (31.9 percentage points), Estonia (31.8 percentage points) and Lithuania (30.8 percentage points). By contrast, relatively little difference was observed between the shares for the lowest and highest income quintiles in Spain (8.0 percentage points), Luxembourg (5.5 points), Greece (4.2 percentage points) and Italy (3.9 percentage points).
Long-standing limitations were less likely to be reported by people with a tertiary level of educational attainment
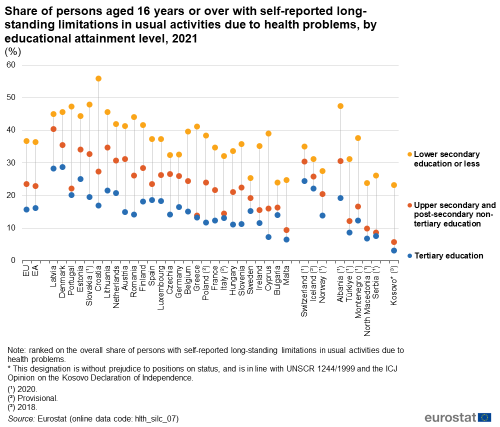
There are also clear differences when looking at the relationship between self-reported long-standing limitations and educational attainment levels – see Figure 5. In the EU, 36.7 % of the population having completed, at most, lower secondary education reported long-standing limitations in 2021; this can be compared with 23.5 % among people having completed upper secondary or post-secondary non-tertiary education and 15.7 % among people with a tertiary level of educational attainment. This health gap between educational attainment levels was apparent in all EU Member States, with the same general pattern as observed for the EU as a whole.
By far the largest gap in the share of the population reporting some or severe long-standing limitations between those with the highest and the lowest educational attainment levels was observed in Croatia (38.9 percentage points). The smallest gaps were observed in Sweden (10.1 percentage points) and Bulgaria (9.9 percentage points).
(%)
Source: Eurostat (hlth_silc_07)
Functional and activity limitations
The third wave of the EHIS was conducted for the 2019 reference year and surveyed persons aged 15 years or over. It included questions for the evaluation of health status of the population, which among other aspects, referred to the main physical and sensory functional limitations (for example, related to vision, hearing or walking). In addition, older persons (aged 65 years or over) were also asked whether they had difficulty in doing certain types of activities, including personal care activities (for example, eating or dressing) or household activities (for example, preparing meals or doing housework).
In the EU, three fifths (60.4 %) of the population reported no physical or sensory limitations, this share was less than one third (31.7 %) among older people. Looking in greater detail, more than three quarters (76.4 %) of older people reported no limitations in performing personal care activities and more than half (52.6 %) reported no limitations in performing household activities.
Two fifths of the EU’s population reported physical or sensory limitations
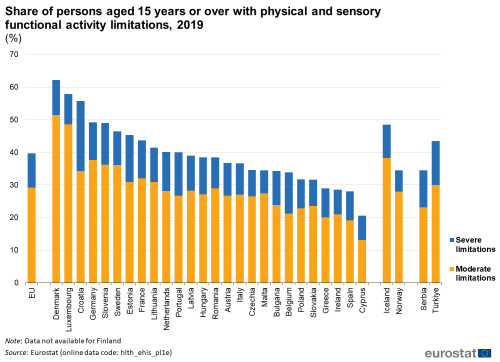
In 2019, 39.6 % of the EU population reported (moderate or severe) physical or sensory limitations; 29.1 % of the population reported moderate limitations of this type and another 10.6 % reported severe limitations of this type – see Figure 6.
Among the EU Member States, shares for (moderate or severe) physical or sensory limitations ranged in 2019 from 20.6 % in Cyprus to 62.2 % in Denmark. Severe physical or sensory limitations were most prevalent in Croatia, reported by 21.4 % of the population; the next highest share was 14.4 % in Estonia. By contrast, less than 8.0 % of the population in Ireland, Cyprus or Malta reported severe limitations of this type.
(%)
Source: Eurostat (hlth_ehis_pl1e)
Females were more likely than males to report physical or sensory limitations
An analysis by sex indicates that the share of females who reported (moderate or severe) physical or sensory limitations was higher than that of males: in 2019, this was observed in all EU Member States with the exceptions of Denmark and Ireland, where the respective shares were higher for males than for females by less than 1.0 percentage points – see Table 2. As far as severe limitations of this type are concerned, a similar pattern was observed across all Member States except two: in Denmark the shares were the same for males and females; in Sweden, the share was 0.6 percentage points higher for males than for females.
In 2019, by far the highest share for females with severe physical or sensory limitations was recorded Croatia (24.0 %), while shares below 10.0 % were recorded in Czechia, Malta, Cyprus and Ireland (where the lowest share, 7.8 %, was recorded). Among males, the equivalent shares ranged from 18.0 % in Croatia to 5.7 % in Malta.
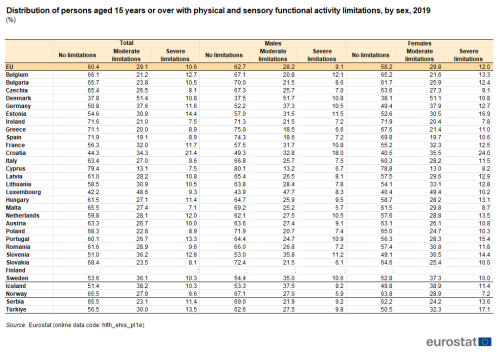
(%)
Source: Eurostat (hlth_ehis_pl1e)
More than two thirds of people aged 65 years or over in the EU reported physical and sensory functional limitations
Age is another important factor that may explain differences in activity limitations. In the EU, 19.4 % of young people (aged 15–24 years) reported physical or sensory limitations in 2019. This share was higher for successively older age groups, peaking at 68.3 % among people aged 65 years or over.
- In 25 EU Member States, the smallest share of people reporting physical or sensory limitations was among people aged 15–24 or 25–34 years. The only exception was Lithuania, where the lowest share was observed for people aged 35–44 years. The lowest share was 2.8 % among people aged 15–24 years in Cyprus.
- In all Member States, the largest share of people reporting physical or sensory limitations was among older people (aged 65 years or over). The highest share was 87.7 % among older people in Croatia.
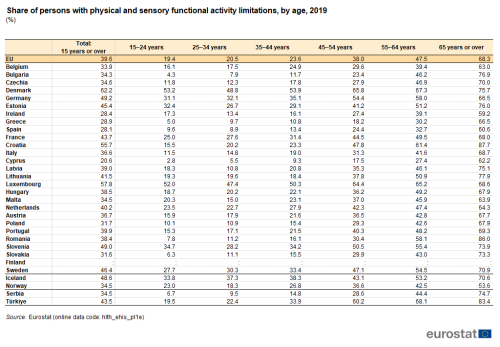
(%)
Source: Eurostat (hlth_ehis_pl1e)
Close to a quarter of persons aged 65 years or over reported limitations in personal care activities
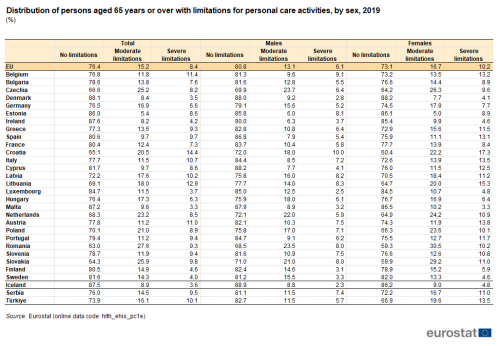
Figure 7 shows that 23.6 % of the EU population aged 65 years or over reported (moderate or severe) limitations in personal care activities in 2019: 15.2 % reported moderate limitations and 8.4 % severe limitations.
In four EU Member States, one third or more of older people reported having (moderate or severe) limitations in performing personal care activities in 2019: Romania (37.0 %), Slovakia (35.7 %), Croatia (34.9 %) and Czechia (33.4 %). This share was lowest in Denmark, at 11.9 %.
In Croatia, 14.4 % of people aged 65 years or over reported severe limitations in personal care activities in 2019, the highest share among the EU Member States, ahead of Lithuania (12.9 %). This share was below 5.0 % in six Member States, with the lowest share being 3.3 % in Malta.
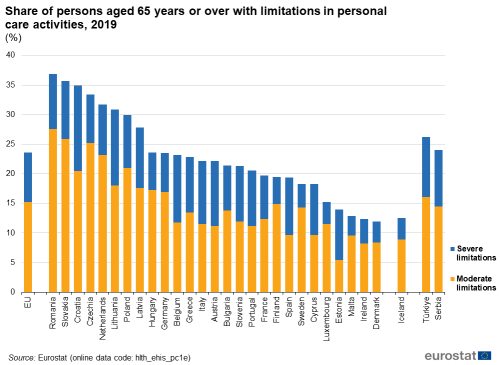
(%)
Source: Eurostat (hlth_ehis_pc1e)
Close to half of all people aged 65 years or over in the EU reported limitations in household activities
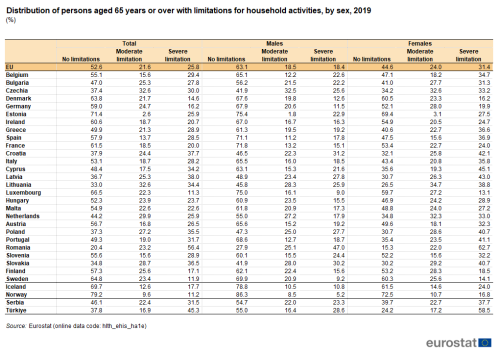
More than one fifth (21.6 %) of older people in the EU reported moderate limitations in household activities in 2019 and just over a quarter (25.8 %) reported severe limitations: the combined share with moderate or severe limitations was 47.4 % – see Figure 8.
- More than half of older people in 12 EU Member States reported (moderate or severe) limitations in household activities. By far, the highest share was recorded in Romania, at 79.6 %; the next highest was 67.0 % in Lithuania. A relatively low proportion of older people reported limitations in household activities in Denmark (36.2 %), Sweden (35.2 %), Luxembourg (33.5 %) and Estonia (28.6 %).
- Restricting the analysis to severe limitations, by far the highest share was in Romania, where more than half (56.4 %) of people aged 65 years or over reported such limitations for household activities; the next highest share among the Member States was 38.0 % in Latvia. This share was lowest in Sweden (11.9 %) and Luxembourg (11.3 %).
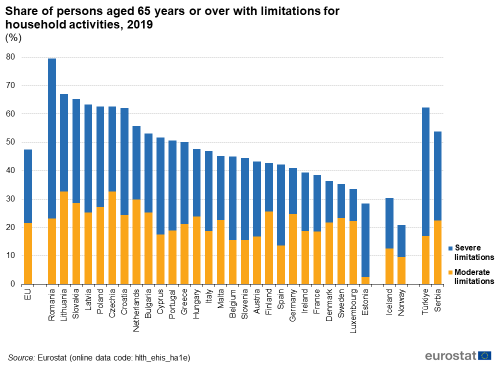
(%)
Source: Eurostat (hlth_ehis_ha1e)
Among older people, limitations with respect to personal care or household activities were more prevalent among females
The share of older people aged 65 years or over reporting limitations in personal care or household activities differed between the two sexes – see Tables 4 and 5. In 2019, older females exhibited higher (moderate or severe) rates than older males in the EU: 26.9 % of females reported limitations for personal care activities compared with 19.2 % of males; 55.4 % of females reported limitations for household activities compared with 36.9 % of males. Again, it should be remembered that the data are not age standardised and that a greater proportion of females than males are very old.
This pattern – higher rates for females than for males — was observed in most EU Member States for limitations in personal care activities. The only exceptions in 2019 were Hungary, Sweden, Estonia and Denmark – see Table 4.
(%)
Source: Eurostat (hlth_ehis_pc1e)
Concerning limitations for household activities, all EU Member States recorded higher rates for females than for males in 2019 – see Table 5.
(%)
Source: Eurostat (hlth_ehis_ha1e)
Limitations with respect to personal care or household activities were more prevalent among older people with a lower level of educational attainment
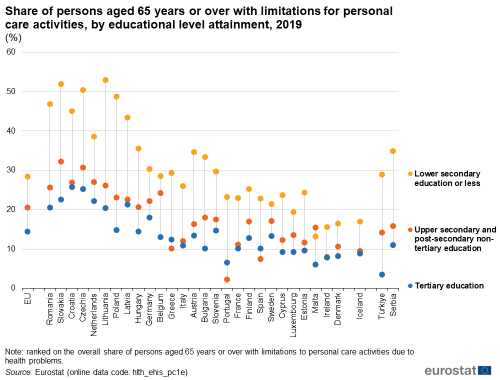
In the EU, the share of older persons (aged 65 years or over) reporting limitations in personal care activities was highest for those with, at most, lower secondary education (28.4 %). The share for older people having completed upper secondary education or post-secondary non-tertiary education was 20.5 % while for older people with a tertiary level of educational attainment the share was 14.5 % – see Figure 9.
- Malta was an exception in that older people having completed, at most, lower secondary education were not the most likely to report limitations in personal care activities; the share was higher among people having completed upper secondary education or post-secondary non-tertiary education.
- Greece, Spain and Portugal were also exceptions, in that older people with a tertiary level of educational attainment were not the least likely to report limitations in personal care activities; the share was lower among people having completed upper secondary education or post-secondary non-tertiary education.
The largest gaps between educational attainment levels in the share of older people reporting limitations in personal care activities in 2019 were recorded in Poland (33.8 percentage points) and Lithuania (32.6 percentage points). The narrowest gaps were in Denmark (8.3 percentage points), Sweden (8.2 percentage points), Ireland (7.7 percentage points) and Malta (7.1 percentage points).
(%)
Source: Eurostat (hlth_ehis_pc1e)
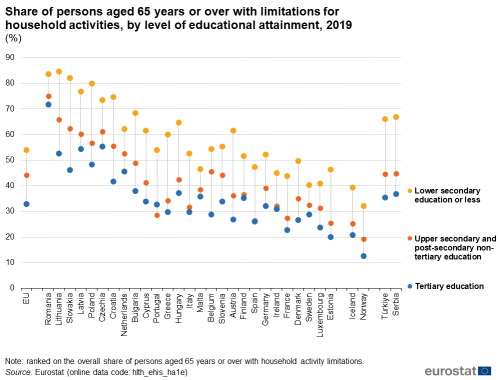
The educational level also had an impact on the share of older persons reporting limitations in household activities: 54.0 % of the EU population aged 65 years or over having completed, at most, lower secondary education reported having moderate or severe limitations in undertaking household activities. This share was lower for people having completed upper secondary education or post-secondary non-tertiary education (44.2 %) and lowest for people with a tertiary level of educational attainment (32.9 %) – see Figure 10.
Among the EU Member States, the share of older persons reporting limitations in household activities in 2019 was always highest for those having completed, at most, lower secondary education. Generally, the lowest share was for older people with a tertiary level of educational attainment, although this was not the case in Portugal.
The largest gaps between educational attainment levels in the share of older people reporting limitations in household activities in 2019 were recorded in Slovakia (35.8 percentage points) and Austria (34.7 percentage points). The narrowest gaps were in Romania (11.9 percentage points), Sweden (11.5 percentage points) and Malta (10.6 percentage points).
(%)
Source: Eurostat (hlth_ehis_ha1e)
Home care services
Continuing the analysis of the limitations faced by older people in undertaking personal and household activities, an indicator on the use of home care services for personal needs was compiled for persons aged 65 years or over. These data record the use of home care services provided to people with health problems. A wide range of health and social services are covered, such as the provision of medical or non-medical in-home supporting care services, home help with housework, and home delivery of meals (so-called ‘meals on wheels’).
Around one in ten older people used home care services for personal needs in 2019
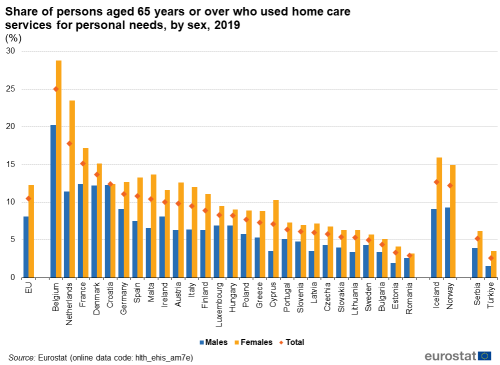
Overall, 10.5 % of the EU population aged 65 years or over in 2019 used in-home care services for personal needs – see Figure 11. The share ranged from less than 5 % in Romania, Estonia and Bulgaria up to 17.8 % in the Netherlands and 25.0 % in Belgium.
(%)
Source: Eurostat (hlth_ehis_am7e)
There was a clear picture as regards differences between the sexes in relation to the share of older people who used care services at their homes. In 2019, 12.3 % of older females used home care services for personal needs as did 8.1 % of older males. Once more it should be remembered that the data are not age standardised and that a greater proportion of females than males are very old.
Across all EU Member States, the share of the population aged 65 years or over who used home care services was consistently higher for females than males in 2019. The largest difference, 12.1 percentage points, was observed in the Netherlands, followed by Belgium (8.6 percentage points). This gender gap was narrowest in Romania (0.6 percentage points) and Croatia (0.1 points).
Similar to the pattern observed with respect to limitations in personal care and household activities, among older people in the EU, those having completed, at most, lower secondary education were most likely to have used home care services
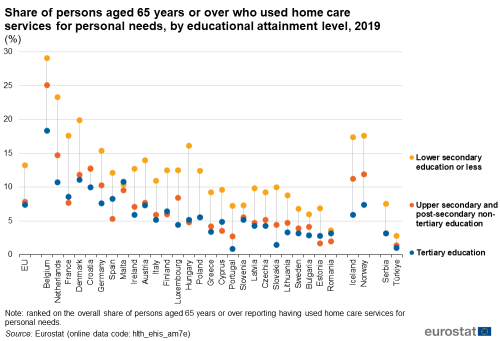
Looking at educational attainment levels, the share of older persons in the EU reporting that they used home care services was highest among those having completed, at most, lower secondary education: the share was 13.2 % in 2019. The shares were notably lower for people having completed upper secondary and post-secondary non-tertiary education (7.8 %) or with a tertiary level of educational attainment (7.4 %) – see Figure 12.
- Nearly all EU Member States showed a similar pattern, with the highest shares of people aged 65 years or over who reported that they used home care services being recorded for those having completed, at most, lower secondary education. The only exception was Malta, where the share was somewhat higher for older people with a tertiary level of educational attainment.
- A majority of Member States (18) recorded the lowest shares of people aged 65 years or over who reported that they used home care services among people with a tertiary level of educational attainment; for eight Member States the lowest share was among people having completed upper secondary and post-secondary non-tertiary education; in Poland the share was equally low for these two levels.
The largest gaps between educational attainment levels in the share of older people reporting in 2019 that they used home care services were recorded in the Netherlands (12.6 percentage points), Hungary (11.3 percentage points), Belgium (10.8 percentage points) and France (9.9 percentage points). The narrowest gaps were in Romania (1.6 percentage points) and Malta (1.3 percentage points).
(%)
Source: Eurostat (hlth_ehis_am7e)
In the EU, the use of home care services hardly varied by degree of urbanisation
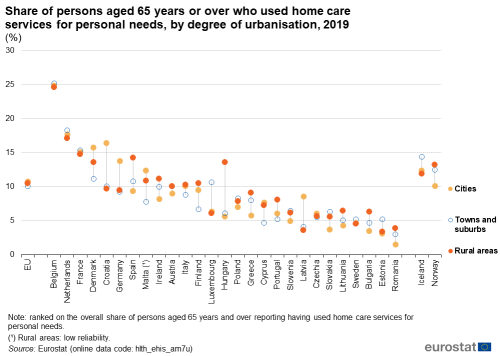
In 2019, older people living in cities in the EU were marginally more likely to have used home care services (10.8 %) than those living in rural areas (10.5 %) or towns and suburbs (10.1 %) – see Figure 13.
Several EU Member States also reported very narrow ranges in this share when analysed by degree of urbanisation in 2019, for example in Belgium, Czechia, France and Sweden. Among Member States where there was a larger range, there were few common characteristics: each of the three degrees of urbanisation had the highest or lowest shares in several Member States. The largest gaps by degree of urbanisation were in Hungary and Croatia:
- in Hungary, the highest share was in rural areas (13.6 %) while the lowest was in cities (5.6 %);
- in Croatia, the reverse was observed, as the highest share was in cities (16.4 %) and the lowest in rural areas (9.7 %).
Source: Eurostat (hlth_ehis_am7u)
Source data for tables and graphs
Data sources
Self-reported general long-standing limitations in usual activities due to health problems
The data used in this article concerning self-reported general long-standing limitations in usual activities due to health problems are derived from EU-SILC. This is the source of comparative statistics on income distribution and social inclusion in the EU. It provides annual data for the EU Member States as well as most EFTA and enlargement countries on income, poverty, social exclusion and other aspects of living conditions.
The reference population for EU-SILC is limited to private households and their current members residing in the territory of the surveying country at the time of data collection. People living in collective households and institutions are generally excluded from the reference population. All household members are surveyed, but only those aged 16 years or over are interviewed.
The variables collected are used to assess the limitations people have experienced – because of health problems – in carrying out usual activities for at least six months; the resulting measure is called the global activity limitation indicator (GALI). This is used as a proxy to measure disability and to calculate the healthy life years indicator. GALI, together with variables on self-perceived health and chronic morbidity (see the article on Self-perceived health statistics) constitute the minimum European health module.
The source is documented in more detail in this background article which provides information on the scope of the data, its legal basis, the methodology employed, as well as related concepts and definitions.
Specific types of functional and activity limitations and home care services
The data concerning specific types of functional and activity limitations and the use of home care services come from the EHIS. This source is documented in more detail in this background article which provides information on the scope of the data, its legal basis, the methodology employed, as well as related concepts and definitions. The general coverage of the EHIS is the population aged 15 years or over living in private households. The third wave of the EHIS was conducted for the 2019 reference year.
Physical and sensory functional limitations refer to the extent of the severity of at least one limitation self-reported by the population in what concerns vision, hearing and walking. Respondents evaluated the extent of their difficulties on the following scale: no difficulty, some difficulty (in this article referred to as moderate limitations), a lot of difficulty and cannot do at all (both referred to as severe limitations).
Limitations in personal care activities show the severity of difficulties in at least one personal care activity covering eating, getting in and out of a bed or a chair, dressing and undressing, using a toilet, bathing or showering. The self-reported data cover the population aged 65 years or over.
Limitations in household activities show the severity of difficulties in at least one household activity covering preparing meals, using the telephone, shopping, managing medication, carrying out light housework, carrying out occasional heavy housework, taking care of finances and everyday administrative tasks. The self-reported data cover the population aged 65 years or over. It should be noted that there may be reasons other than health reasons behind difficulties doing household activities.
The indicator on home care services shows the use of any type of home (health or social) care services. It includes only formal care services provided by professional health or social workers (not by family members or friends) and refers to the 12 months prior to the interview.
Limitations of the data
All of the indicators presented in this article are derived from self-reported data so they are, to a certain extent, affected by respondents’ subjective perception as well as by their social and cultural background.
EU-SILC and the EHIS do not cover the institutionalised population, for example, people living in health and social care institutions who are more likely to face limitations than the population living in private households. It is therefore likely that, to some degree, both of these data sources under-estimate the share of the population facing limitations.
Furthermore, the indicators presented are not age-standardised and thus reflect the current national age structures. Finally, despite substantial and continuous efforts for harmonisation, the implementation of EU-SILC and EHIS is organised nationally, which may impact on the results presented, for example, due to differences in the formulation of questions or their precise coverage.
Context
The specific objectives of the European strategy on the rights of people with disabilities for 2021–2030 are for people with disabilities to
- move and live freely within the EU,
- get the right support to be able to have a good life,
- live independently,
- be part of the community together with other people,
- make their own decisions about their lives,
- have the same chances to study and work as all other people,
- have access to health care and other important things and services,
- be treated in a fair way and with respect.
The EU is also a signatory of the United Nations Convention on the Rights of Persons with Disabilities (CRPD).
Indicators on functional and activity limitations are included in the health status chapter of the European core health indicators (ECHI).
Direct access to
Online publications
Health status
Methodology
General health statistics articles
- Health (hlth), see:
- Health status (hlth_state)
- Functional and activity limitations (hlth_fal)
SILC
- Income and living conditions (ESMS metadata file – ilc_esms)
- Health variables of EU-SILC (ESMS metadata file – hlth_silc_01_esms)
- EU statistics on income and living conditions (EU-SILC) methodology
- Health variables in EU-SILC
EHIS
- European health interview survey (ESMS metadata file – hlth_det_esms)
- European health interview survey
- European Health Interview Survey (EHIS wave 3) – Methodological manual – 2020 edition
- Legal framework from 2021: EU statistics on income and living conditions
- Commission Regulation (EU) 2018/255 of 19 February 2018 implementing Regulation (EC) No 1338/2008 of the European Parliament and of the Council as regards statistics based on the European Health Interview Survey (EHIS)
Health
- European Commission – Directorate-General for Health and Public Safety – Public health, see:
- Regulation (EU) 2021/522 of the European Parliament and of the Council of 24 March 2021 establishing a Programme for the Union’s action in the field of health (‘EU4Health Programme’) for the period 2021–2027
Disability