Data extracted in March 2021.
Planned article update: September 2022.
Highlights
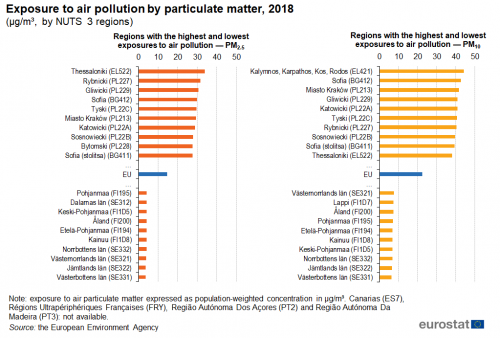
In 2018, the highest level of air pollution for fine particulate matter was recorded in Thessaloniki, in Greece, where the annual average was 2.3 times as high as the EU average.
Southern and mountain regions of the EU tended to have the highest levels of soil loss as a result of water erosion.
Climate change and environmental degradation are two of the most serious threats to the European Union (EU) and the wider world. The United Nations (UN’s) 2030 Agenda for Sustainable Development is a long-term strategy that seeks, among other socioeconomic and environmental goals, to protect the Earth from environmental degradation, through sustainable consumption and production, coupled with urgent action on climate change. The agenda introduced a set of 17 Sustainable Development Goals (SDGs); to monitor progress towards these goals the UN has adopted 231 (unique) indicators.
The European Green Deal is the EU’s growth strategy to become a modern, resource-efficient and sustainable economy — the first climate-neutral continent by 2050 — it is fully consistent with the SDGs that are concerned with the environment. The European Green Deal seeks to turn climate and environmental challenges into opportunities, for example, by: undertaking to reduce net emissions of greenhouse gases to zero; ensuring economic growth is decoupled from resource use; cutting pollution; restoring biodiversity. The EU’s Biodiversity Strategy for 2030 aims to ensure legal protection for at least 30 % of its land and sea area as part of a trans-European nature network.
The first section of this article provides a description of landscapes in the EU, focusing on protected areas and fragmented landscapes. The second section details information on air pollution and in particular exposure to fine particulate matter that may cause or aggravate, among other conditions, a range of respiratory and cardiovascular diseases. The article concludes with statistics on soil, analysed in relation to soil sealing (imperviousness), soil erosion and changes in soil moisture.
Landscape/biodiversity
Historically, human activity was generally assumed to have had little lasting impact on the land or the environment, as many people held a common belief that nature could restore or replenish itself. However, land has become a natural and economic resource used for multiple purposes: agriculture and forestry; mining; manufacturing; construction; distributive trades, transport and other services; as well as for residential and leisure use. The effects of certain phenomena — rising temperatures, the rapid disappearance of vast areas of forest, the gradual desertification of certain regions, or sprawling urban developments — have contributed towards increasing awareness. Land is a finite resource and its use constitutes one of the principal drivers of environmental change, with potential impacts on the climate, ecosystems, biodiversity and the overall quality of life.
Natura 2000
Natura 2000 is a network of areas that have been designated as protected sites under the Birds Directive and the Habitats Directive. The target is to ensure the long-term sustainability of the habitats and species they have been set up to protect. The Birds Directive established a protection regime for all bird species naturally occurring in the EU. It included classification by EU Member States of special protection areas (SPA) for particularly threatened bird species and for all migratory birds. This approach was extended through the Habitats Directive, which provided for the establishment of sites of community importance (SCI); it aims to support the conservation of habitat types and species listed in two annexes. Over time, SCIs must also be designated as special areas of conservation. Together, the SPAs and the SCIs/SACs make up the Natura 2000 network. The sites in the Natura 2000 network are the contribution from Member States to the pan-European Emerald Network of the Bern Convention on the Conservation of European Wildlife and Natural Habitats.
Map 1 indicates how large the Natura 2000 sites are in each NUTS level 1 region in 2019 and also indicates the different types of area within these sites. The four regions with the largest area of Natura 2000 sites were Centro (55 600 km²) in Spain, Norra Sverige (49 300 km²) in Sweden, Manner-Suomi (42 100 km²) in Finland and Sur (28 700 km²) in Spain. The smallest Natura 2000 area was in Åland (11 km²) in Finland, which is also one of the smallest regions in terms of its total area.
More data and information on protected areas, protected species and habitats, ecosystems and biodiversity can be found here.
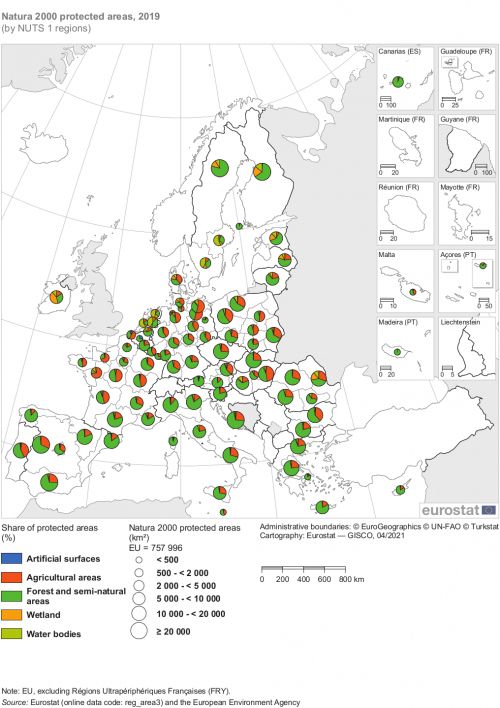
(by NUTS 1 regions)
Source: (reg_area3) and the European Environment Agency
In 2019, forest and semi-natural areas was the most common type of land cover within Natura 2000 sites in 74 or the 91 NUTS level 1 regions for which data are available in Map 1. In fact, more than half of the area of the Natura 2000 sites was forest or semi-natural areas in 68 regions, with this share exceeding 90.0 % in Corse (France; 93.0 %), Westösterreich (Austria; 93.3 %), Canarias (Spain; 95.2 %), Åland (Finland; 95.3 %) and Região Autónoma Da Madeira (Portugal; 99.0 %). In 11 regions, mainly in Germany (five regions) and France (three regions), the most common land cover of Natura 2000 sites was agricultural, with this share peaking at 79.1 % in the small (in terms of area) German region of Bremen. In five regions — three in the Netherlands and two in Sweden — the most common land cover type in Natura 2000 sites was water bodies, peaking at 58.4 % in West-Nederland. Ireland was the only region in the EU where wetlands were the most common land cover type in Natura 2000 sites, with a 42.5 % share.
As noted above concerning Åland, some regions have small areas designated as Natura 2000 sites partly because the regions themselves are small. Figure 1 presents information on Natura 2000 sites at the more detailed NUTS level 3. As well as listing the 20 areas with the largest protected areas, this figure provides standardised information, by comparing the area of Natura 2000 sites in each region with the region’s total area.
At NUTS level 3, the three regions with by far the largest Natura 2000 protected areas in 2019 were Lappi in Finland and the Swedish regions of Norrbottens län and Västerbottens län; the protected areas in all three of these regions were mainly forest and semi natural areas, but they also had quite large wetlands and water bodies. However, none of these three regions were included in the 20 regions with the largest share of their area designated as Natura 2000 sites. Among the 1 151 regions for which data are available, there were 19 where more than half of the total area was protected. This share reached 72.0 % in Primorsko-goranska županija (Croatia) and 73.5 % in Tulcea (Romania): in the former, most of the protected areas were forest and semi natural areas; in the latter, wetland areas were particularly large, along with relatively large protected agricultural areas and also forest and semi natural areas. By contrast, there were 27 regions (mainly urban) where less than 1.0 % of the total area was designated as a Natura 2000 site; the lowest share across NUTS level 3 regions in the EU was 0.04 % in Gliwicki (Poland).
More data and information on Europe’s forests can be found here.
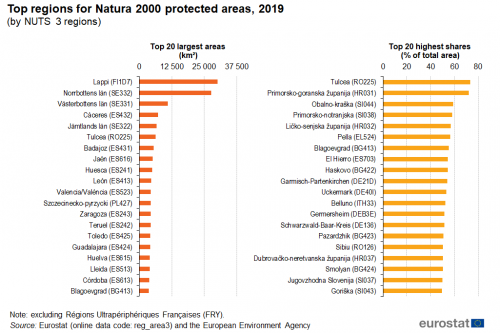
(by NUTS 3 regions)
Source: (reg_area3) and the European Environment Agency
Fragmented landscapes
One of the impacts of increasing settlements and other man-made developments is that natural habitats have become fragmented by various elements, including natural ones (such as hedges) and artificial ones (such as roads and built up areas).
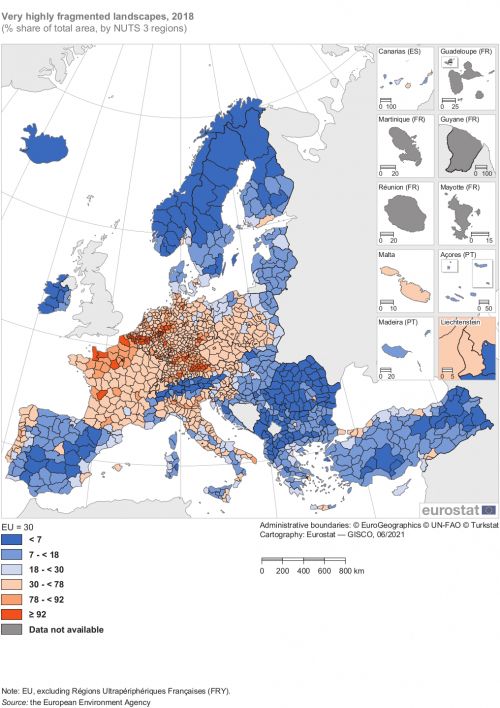
One measure of the extent of artificial elements, which identifies very highly fragmented landscapes, is produced by the European Environment Agency. The indicator can be seen as a measure of the extent to which points within an area of land are accessible to each other, without encountering artificial surfaces such as roads or built up areas. A very highly fragmented landscape is an area with more than 50 landscape elements per 1 000 km².
In the EU, 29.5 % of the total area in 2018 was classified as very highly fragmented. In general, shares of very highly fragmented landscapes above the EU average were recorded across all or nearly all of France, the Benelux Member States, Germany, Czechia and Malta, most regions in Italy, Austria, Poland and Slovenia, as well as many regions in Denmark and Portugal. Among the EU Member States where a relatively large proportion of regions had shares of very highly fragmented landscapes that were below the EU average, it was common to find that their capital regions had an above average share; this was observed in Bulgaria, Ireland, Greece, Spain, Croatia, Latvia, Hungary, Slovakia and Finland. As such, Estonia, Lithuania and Sweden were the only Member States where none of the regions recorded a share of very highly fragmented landscapes above the EU average, not even in the capital region. Note that no data are available for Cyprus, Romania or the outermost regions of France.
Among the 1 121 NUTS level 3 regions for which data are presented in Map 2, in a small majority (602) at least half of the area was classified as very highly fragmented. The share was at least 93.0 % in 112 regions (as shown with the darkest shade of orange in the map), among which 30 regions had a share of 100.0 %. These regions that were exclusively made up of very highly fragmented areas were mainly in Germany (23 regions), with the others in Belgium (four regions), Spain (Ceuta and Melilla) and France (Hauts-de-Seine). By contrast, in 99 regions the share of very highly fragmented landscapes was below 10.0 % (as shown with the darkest shade of blue in the map), with this measure falling below 1.0 % in Lappi (Finland), Jämtlands län and Norrbottens län (both Sweden).
Air pollution
Air pollution refers to the release into or the presence in the air of pollutants (particles or gases): it may be anthropogenic (human-induced) or of natural origin. Examples of human-induced activities that lead to air pollution include the burning of fossil fuels (such as in conventionally-powered vehicles), industrial processes (including electricity generation), agriculture or the treatment of waste. Examples of events that lead to naturally occurring air pollution include volcanic eruptions, desert dust, forest fires or sea-salt spray. Air pollution has the potential to harm both human health and the environment: particulate matter (PM), nitrogen dioxide and ground-level ozone are known to pose particular health risks.
Regions with concentrated economic activity and/or a high population density are likely to have a greater impact on the environment in general and air pollution in particular. However many other factors, other than just economic or population size, impact on the extent of air pollution. For example, climatic conditions play a role, influencing energy demand for heating or cooling. Low-quality solid fuels and low-efficiency appliances can increase exposure to particulate matter, both indoors and outdoors. As well as having an impact on the environment, long-term and peak exposures to pollutants may impact humans directly, for example impacting human health. Particulates can be carried deep into the lungs where they can cause inflammation and a worsening of the condition of people with heart and lung diseases. According to the recommendations of the World Health Organisation (WHO), the annual mean concentration is the best indicator for PM-related health effects.
Although air quality in the EU has generally improved in recent decades, some urban populations remain exposed to high concentrations of air pollutants, for example, as a result of industrial and transport activities.
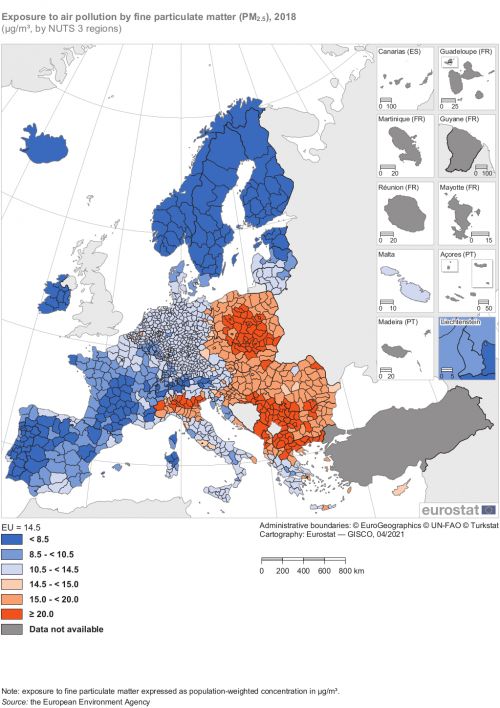
Map 3 presents information for NUTS level 3 regions concerning average concentration levels of fine particulate matter (PM2.5 — particles with a diameter of 2.5 micrometres or less) to which the population is exposed. In 2018, the highest population exposures were generally recorded in regions located across several southern and eastern EU Member States, principally Bulgaria, Czechia, Greece, Croatia, northern Italy, Poland and Romania, but also in isolated regions of Hungary and Slovakia. By contrast, the lowest values were concentrated in many or all of the regions in Estonia, Ireland, Spain, France, Austria, Portugal, Finland and Sweden, with isolated regions in Belgium and Latvia also recording particularly low exposure.
Looking in more detail, approximately one fifth of NUTS level 3 regions in the EU (218 out of 1 155 regions for which data are available) had an average exposure to fine particulate matter that was less than the WHO target value of 10.0 µg/m³; 264 regions had an average exposure below 10.5 µg/m³ (shown by the two darkest blue shades in Map 3). By contrast, 93 regions presented average exposure to at least 20.0 µg/m³ of fine particulate matter (double the WHO target; as shown by the darkest shade of orange in Map 3), with 18 of these regions having exposure to at least 25.0 µg/m³ (in other words, above the EU’s limit value).
In 2018, the highest exposure to air pollution by particulate matter (PM2.5) among NUTS level 3 regions was registered in Thessaloniki (Greece; 33.9 µg/m³), as can be seen in the left hand half of Figure 2. The other regions in the top 10 were principally located in Poland (seven regions), along with two regions located in Bulgaria. The top six regions all had exposure levels that were more than double the EU average (14.5 µg/m³). The lowest values of exposure to PM2.5 were recorded in Västerbottens län and Jämtlands län, in northern Sweden (3.6 µg/m³). The other regions in the bottom 10 were all in Finland (five regions) or Sweden (three regions); in fact, the 22 regions with the lowest exposure (5.1 µg/m³ or less) were all in Finland or Sweden.
The right hand side of Figure 2 shows a similar analysis for a broader definition of particulate matter, expanded to include also medium and coarser particles with a diameter up to 10 micrometres or less (PM10). As for PM2.5, a Greek region topped the list for exposure to PM10 in 2018, this time Kalymnos, Karpathos, Kos, Rodos. Another similarity with the top 10 for PM2.5 is that the list for PM10 contains only regions from Bulgaria, Greece and Poland. In fact, 9 of the 10 regions are common to both lists. At the bottom of the list the similarities persist, with the same two Swedish regions having the lowest exposure to PM10 as for PM2.5, and again 9 out of 10 regions appearing in both lists. One difference between the lists for exposure to PM2.5 and to PM10 is that for the latter, none of the regions had a level of exposure that was more than double the EU average (22.5 µg/m³).
More data and information on European air quality can be found here.
Soils
Soil is a vital resource that supports the production of food, while helping to regulate water quality and quantity and plays a role in species diversity. It is also an important factor in mitigating climate change, as it stores carbon (providing the second largest sink after the oceans). However, changes in land cover and land use have the potential to result in carbon losses, for example, as a result of draining peatlands, intensive agriculture or soil sealing.
Sealed soil surfaces
There is growing competition for finite land resources which has, in most EU Member States, resulted in increased use of land for urban or industrial developments as well as related infrastructure. These changes have potentially significant implications for soil functions (including drainage, carbon storage and sequestration). Soil sealing (or imperviousness) is defined as the covering of soil surfaces with impervious materials as a result of urban development and infrastructure construction (buildings, other constructions and laying completely/partially impermeable artificial materials such as asphalt, metal, glass, plastic or concrete). There are a range of factors that may affect the extent of soil sealing, among which: land availability; population size, density and distribution; housing type preferences; average numbers of occupants per household; and spatial planning.
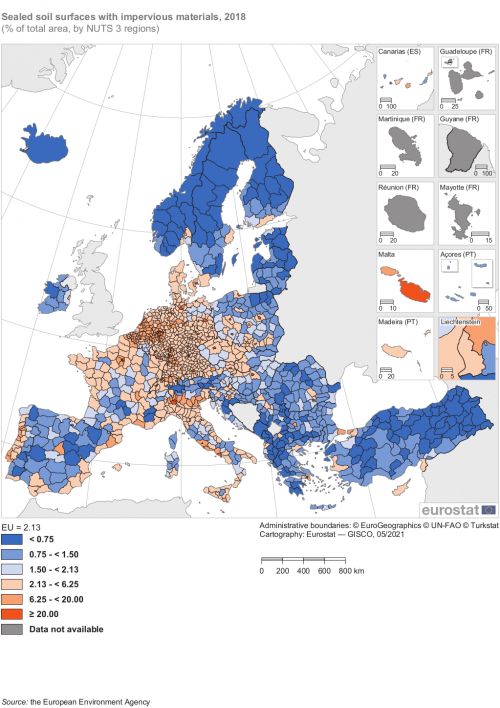
The indicator shown in Map 4 provides information on the share of the total area impacted by soil sealing (as a result of artificial and urban land use). In total, there were 88 565 km² of sealed surfaces in the EU in 2018, equivalent to 2.13 % of the EU’s total area. These data should be considered as provisional, as the mapping for 2018 had access to higher resolution imagery than that used for previous years and, at the time of writing, is still under review.
Paris (France) had the highest share of sealed soil surfaces
An analysis by NUTS level 3 regions reveals that the largest areas of sealed soil surfaces were unsurprisingly recorded in some of the most built-up areas of the EU. Note that the administrative boundaries that are used to delimit each region may play an important role in determining the sealed surface area, as some regions are constrained within the boundaries of their city centre (for example Paris covers a relatively small area), whereas other regions may extend into their suburbs and beyond. In absolute terms, the highest areas of sealed soil surfaces in 2018 were recorded in the Spanish regions of Madrid (592 km²) and Barcelona (516 km²), followed by Nord in France (468 km²). There were five regions in the EU where the area of sealed soil surfaces was within the range of 417-433 km²: Gironde, Bouches-du-Rhône (both France), Roma (Italy), Área Metropolitana de Lisboa (Portugal) and Středočeský kraj (which encircles the Czech capital region of Praha).
The information presented in Map 4 concerns the share of sealed soil surfaces in the total area of each region. In 2018, the highest rate was recorded in the French capital region, Paris, at 69.9 %. There were only three other regions in the EU — two of which were in the suburbs of Paris — where the share of sealed soil surfaces was above 50 % in 2018: Seine-Saint-Denis, Hauts-de-Seine (both in France) and Kentrikos Tomeas Athinon (which forms part of the Greek capital).
Among the 1 164 NUTS level 3 regions for which data are available, there were 87 regions of the EU where the share of sealed soil surfaces relative to total area was at least 20 % in 2018 (as shown by the darkest shade of orange in the map). These regions were predominantly concentrated across Denmark, Germany, Greece, France, Italy, the Netherlands and Poland, including five of their capital regions (the exceptions were for Italy and the Netherlands). This group also included the capital regions of Belgium, Czechia, Hungary, Malta, Austria and Romania, as well as the Spanish regions of Ceuta and Melilla.
By contrast, there were 82 regions in the EU (shown with the darkest shade of blue in Map 4) where the share of sealed soil surfaces relative to the total area was less than 0.75 % in 2018. These regions included more than half of all regions in Estonia, Latvia, Finland and Sweden, as well as many mountain regions (for example in Greece, France or Austria).
Across the EU, there were on average 198 m² of sealed soil surfaces per inhabitant in 2018. It is interesting to note that the environmental impact of sealed soil surfaces — using this measure — was reversed, insofar as some of the lowest ratios were generally recorded in the most densely-populated regions of the EU. For example, the three lowest ratios were in the French, Greek and Romanian capital regions, with 34 m² of sealed soil surfaces per inhabitant in Paris, 48 m² per inhabitant in Kentrikos Tomeas Athinon and 51 m² per inhabitant in Bucureşti. At the other end of the range, the coastal Portuguese region of Alentejo Litoral had 579 m² of sealed soil surfaces per inhabitant.
Soil erosion
Having looked at the impact of soil sealing from artificial and urban land use, this section analyses another environmental impact on soils. Soil erosion — the physical displacement of soil particles — principally occurs as a result of water or wind processes; the analysis in Map 5 covers soil loss as a result of water erosion.
With climate change leading to more extreme weather events, there is an increased risk that storms and prolonged periods of rainfall or drought will result in higher levels of soil erosion. Processes like rain splash, overland flow/sheet wash and rill formation can remove soil, leading to, among other results: the potential loss of fertile topsoil; the breakdown of soil structures (and associated losses of soil carbon); a reduction in the level of stored water; an increased risk of flooding or landslides; the pollution of water bodies; and negative impacts on habitats and biodiversity.
Severe soil erosion by water is defined as a situation where non-artificial areas — agricultural areas, forest and semi-natural areas (excluding beaches, dunes, sand plains, bare rock, glaciers and perpetual snow cover) — are at risk of being subject to the removal of upwards of 10 tonnes of soil per hectare per year. Estimates made by the European Commission’s Joint Research Centre (JRC) indicate that, on average, 2.5 tonnes of soil was lost per hectare of non-artificial areas in the EU as a result of water erosion in 2016.
In Crotone (Italy), an estimated 20.3 tonnes of soil was lost per hectare of non-artificial areas as a result of water erosion in 2016
Among the 1 154 NUTS level 3 regions for which data are available, there were 343 regions where soil loss among non-artificial areas was at least as high as the EU average; these regions are shaded orange in Map 5. There is a relatively clear North–South divide in terms of soil loss as a result of water erosion, with above average erosion concentrated in the south. There is also an apparent, but less uniform, East–West divide, with clusters of regions in some eastern EU Member States recording above average soil loss. None of the regions in northern Member States had an above average soil loss, while among western Member States such regions were mainly concentrated in mountainous or hilly regions of southern Germany, southern France and Austria. In general, the risk of soil erosion was particularly pronounced in regions where the local topography was composed of lengthy, steep slopes, or in regions around the Mediterranean Sea that were particularly prone to soil erosion by water because of long dry periods followed by heavy bursts of intense precipitation on steep slopes with fragile soils.
The majority of regions with above average soil loss as a result of water erosion stretched from northern Portugal, through much of Spain and southern France, into Italy, Austria and southern Germany, and then down through south-western Hungary, Slovenia and parts of Croatia towards Greece. Practically all of the purely island regions in the Mediterranean — whether in Spain, France, Italy, Malta, Croatia, Greece or Cyprus — also had above average soil erosion. Note that some Croatian islands (such as Cres) and Greek islands (such as Thasos and Samothraki) that are combined in regions with mainland areas also had below average soil erosion for the whole region to which they belong. Relatively large clusters of regions with above average soil loss were also found in southern Poland/north-eastern Slovakia (around the Tatra Mountains), northern and central Romania, and northern Bulgaria.
The darkest shade of orange in Map 5 indicates regions where soil loss as a result of water erosion was at least 6.4 tonnes per hectare; in total, 118 NUTS level 3 regions were estimated to have such a level of soil loss, among which were 58 that experienced severe soil erosion, in other words with loss of at least 10.0 tonnes per hectare. The regions with severe soil erosion were mainly located in Italy (34 regions), Austria (eight regions) and Greece (six regions), although there were also some regions in France, Spain, Slovenia and Croatia. The highest levels of soil loss as a result of water erosion — mainly resulting from their topography — were in the Austrian regions of Osttirol (28.2 tonnes per hectare) and Tiroler Oberland (26.7 tonnes per hectare).
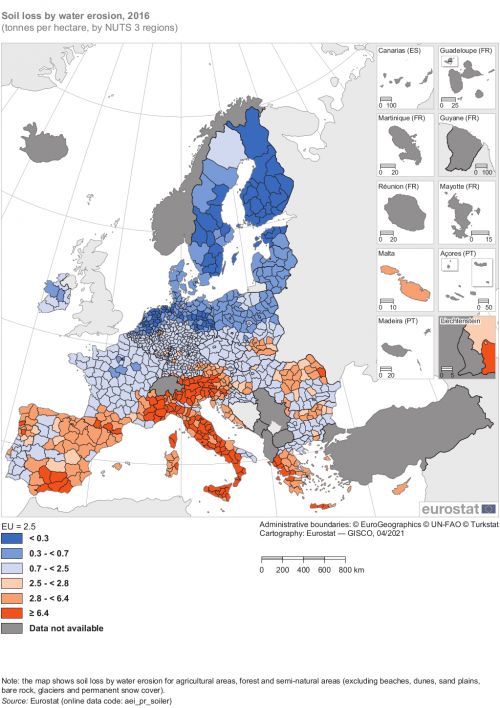
(tonnes per hectare, by NUTS 3 regions)
Source: Eurostat (aei_pr_soiler)
Soil moisture
Alongside soil erosion, soil moisture is also impacted by climate change. A deficit of soil moisture, for example during a drought, impacts on vegetation, both naturally occurring and cultivated. This has a variety of consequences, for example on the productivity of agricultural land for food supply, as well as the vulnerability of an area to wind and water erosion and to forest fires.
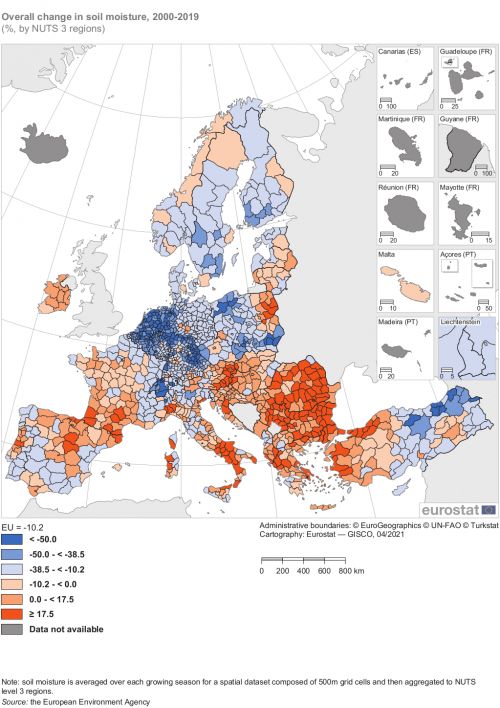
Map 6 indicates the extent to which the soil moisture level in 2019 was different to that in 2000. As such, it does not reflect whether a region has a high or low level of soil moisture, but the extent to which this differed in two years that were nearly two decades apart. Overall, soil moisture in the EU was 10.2 % lower in 2019 than it had been in 2000.
The distribution of NUTS level 3 regions around the EU average was quite uneven: 705 regions had a larger (than the EU) negative difference between 2000 and 2019 in soil moisture (those shaded blue in the map); 149 regions recorded a negative difference in soil moisture that was equal to or smaller than that observed for the EU (shown with the lightest shade of orange in the map); one region had no difference in soil moisture content and 300 regions had a positive difference in soil moisture (as shown by the two darker shades of orange).
The largest negative differences in soil moisture between 2000 and 2019 — where the level of moisture in 2019 was less than half the level in 2000 (as shown by the darkest shade of blue in the map) — were concentrated in relatively central regions (on a North–South axis) within the EU. The 116 NUTS level 3 regions with soil moisture in 2019 that was less than 50 % of its 2000 level were in a band running from Belgium (11 regions), through the Netherlands (28 regions) and Germany (69 regions), into Poland (seven regions); the only other region with such a large negative difference in soil moisture was Biella in northern Italy. The largest negative difference in soil moisture was in Eisenach, Kreisfreie Stadt in Germany.
The largest positive differences — where soil moisture was at least 17.5 % higher in 2019 than it had been in 2000 — were estimated for 117 regions. Although these were spread across 11 EU Member States, these regions were mainly found in Romania (29 regions), Bulgaria (22 regions), Italy (18 regions), Greece (17 regions) and Austria (11 regions); there was also a cluster of regions either side of the Spanish–French border and another in north-eastern Poland. The two regions where the positive difference in soil moisture was greatest were Prahova in Romania (56.1 % higher in 2019) and Yambol in Romania (50.6 % higher).
Source data for figures and maps
Data sources
The EU set up a (regional) monitoring system — the EU SDG Indicator set 2021 — which is led by Eurostat. It is a set of 100 indicators that are reviewed on an annual basis. These indicators are used to monitor progress towards the SDGs in an EU context and also form the basis for the annual publication Sustainable development in the European Union — Monitoring report on progress towards the SDGs in an EU context.
Protected areas
Data on protected areas reflect initiatives to protect birds and natural habitats in the EU within the Natura 2000 network. The aim of the network is to ensure the long-term survival of the EU’s most valuable and threatened species and habitats, listed under both the Birds Directive and the Habitats Directive. The European Environment Agency (EEA) compiles and publishes data for all Natura 2000 sites.
More information on Natura 2000 can be found here and the Natura 2000 Network viewer can be found here.
Fragmented landscapes
One of the impacts of increasing settlements/other developments (such as infrastructure) is that natural habitats become fragmented. The EEA produces data concerning landscape fragmentation due to transport infrastructure and sealed areas, in other words pressure on landscape from mobility and urbanisation. The indicator compiled by the EAA concerns land fragmentation due to artificial landscape surfaces, rather than due to natural ones; furthermore, it only considers artificial surfaces (such as roads and built up areas) and not all man made barriers, such as fences and walls. The indicator can be seen as a measure of the extent to which points within an area of land are accessible to each other, without encountering artificial surfaces such as roads or built up areas. From the perspective of biodiversity, it should be noted that the existence of an artificial surface may or may not be a barrier for accessibility in practice, for example depending on whether or not a species can fly or be transported by the wind. The extent to which movement between different parts of a landscape is interrupted by artificial surfaces is reflected in what is referred to as the effective mesh density: the more artificial surfaces that exist, the higher the effective mesh density and therefore the higher the fragmentation.
More information on fragmented landscapes and pressure on ecosystems can be found here.
Air pollution
The EEA is the source for the statistics presented on air pollution from particulate matter (PM). Based on the size of the particles, various categories of particulate matter can be defined. Two measures are used in this article: PM2.5 for particles with a diameter of 2.5 micrometres or less and PM10 for particles with a diameter of 10 micrometres or less. Air quality may be assessed by the concentration of various pollutants in ambient air.
There are no safe thresholds below which there are not health impacts from particulate matter. The EU set exposure reduction targets and limit values for various air pollutants in Directive 2008/50/EC of the European Parliament and of the Council of 21 May 2008 on ambient air quality and cleaner air for Europe. For PM2.5 an annual average of 25µg/m³ was set as the annual limit value and an annual average of 20µg/m³ as an indicative limit value. For PM10, the annual limit value was set at 40µg/m³, with a daily limit value of 50µg/m³(not to be exceeded more than 35 days per year). The World Health Organisation (WHO) set a non-binding guideline value whereby annual average concentrations of PM2.5 should not exceed 10µg/m³ in order to protect human health and annual average concentrations of PM10 should not exceed 20µg/m³ (note that the WHO also provided interim targets, designed to help gauge progress over time). Directive (EU) 2016/2284 of the European Parliament and of the Council of 14 December 2016 on the reduction of national emissions of certain atmospheric pollutants which entered into force on 31 December 2016 sets national emission reduction commitments for PM2.5 for each EU Member State.
More information on air quality can be found here.
Soils
The EEA is the source for the statistics presented on sealed soil surfaces (imperviousness) for built-up areas. The data presented are based on the Copernicus high resolution layer, which is designed to capture the percentage of soil sealing as a result of land take for artificial land use.
As noted earlier in this article, the data concerning sealed soil surfaces for 2018 are provisional. For the mapping of the latest reference year, higher resolution input imagery was available. Consequently, soil sealing could be more precisely mapped.
More information on sealed soil surfaces can be found here.
The JRC is the source of information for the data presented on soil erosion. The dataset only considers soil erosion from rain splash, overland flow (also known as sheet wash) and rill formation. The information is published for NUTS level 3 regions.
More information on soil erosion can be found here.
Data on soil moisture are compiled by the European Drought Observatory, which is part of the Joint Research Centre (JRC); data are available from the EEA. The soil water content values that form the basis for the calculation of soil moisture indicators are derived from the LISFLOOD hydrological model of the JRC. LISFLOOD is a model for large and trans-national European river catchments and is part of the European Flood Awareness System. LISFLOOD uses daily meteorological observations and weather forecasts.
More information on soil moisture can be found here.
Indicator definitions
Protected areas
The area of Natura 2000 protected areas is compiled for a total and for five types of bioregions: artificial surfaces, agricultural areas, forest and semi-natural areas, wetlands and water bodies. Along with the area in absolute value, the area is shown as a percentage of the total area (land and inland water areas) in a particular region or country.
The data for Natura 2000 protected areas can be further disaggregated by considering areas that are covered by each of the two directives (the Birds Directive and the Habitats Directive).
Fragmented landscapes
This indicator measures landscape fragmentation due to transport infrastructure and sealed areas. The effective mesh density is a measure of landscape fragmentation. It gives the effective number of meshes (or landscape patches) per 1 000 km².
The values are positive real numbers. For convenience and practical considerations, small connectivity values are rounded to 0, yielding a density of 100 000 (meshes per 1 000 km²). For grid cells completely covered by built-up areas and infrastructure the density is set (by convention) to -2; in other words, -2 represents positive infinity.
For the assessment, density values were grouped into five fragmentation classes (very low, low, medium, high and very high) by performing the following steps:
- selecting 90 % of the density value range (in other words, ignoring the upper and lower 5th percentiles);
- running geometric interval classification;
- rounding threshold values.
The thresholds for the fragmentation classes are outlined below.
| Density values (number of meshes per 1 000 km2) | Fragmentation class |
|---|---|
| 0-1.5 | Very low |
| 1.5-10 | Low |
| 10-50 | Medium |
| 50-250 | High |
| > 250 | Very high |
The data shown in this article relate to the share of the total area with very high fragmentation.
Air pollution
The PM2.5 and PM10 population-weighted concentrations that are shown as an indication of population exposure have been obtained from interpolated maps according to the methodology described in ETC/ATNI (2020) and references therein (ETC/ATNI, 2020, European air quality maps for 2017 — PM10, PM2.5, ozone, NO2 and NOx spatial estimates and their uncertainties, Eionet report — ETC/ATNI 2019/9, European topic centre on air pollution, transport, noise and industrial pollution).
Soils
The data concerning sealed soil surfaces were produced using automatic derivation based on a calibrated normalised difference vegetation index (NDVI). These are per-pixel estimates of impermeable cover of soil (soil sealing) and represent the degree of imperviousness (on a scale of 0-100 %).In order to show developments over time, an index has been compiled showing the degree of imperviousness in 2006 with the value of 100: values for the most recent year which are above 100 indicate that the degree of imperviousness has increased whereas values below 100 indicate that the degree of imperviousness has decreased.
The data concerning soil erosion are produced on the basis of an empirical computer model (RUSLE2015) and therefore represent estimated values of soil erosion rather than actual measurements. The model is based on high quality and peer reviewed published input layers for soil erodibility, rainfall erosivity, topography, land cover and conservation practices. Generally, artificial, sandy, rocky and icy surfaces as well as wetlands and water bodies have been excluded from the area on which the indicator is based.
The first stage of the compilation of the soil moisture indicator is the estimation of daily soil water content for individual grid cells. The LISFLOOD model simulates soil moisture in two surface layers (the skin layer and the root zone) for two types of areas (forested and other). These four soil moisture values are averaged to derive a single soil water content value for each grid cell. The value of the soil water content is then converted into the soil moisture index which ranges between 0 (the wilting point, in other words dry) and 1 (above the field capacity, in other words wet). The indicator shown in this article is the overall change in the annual average index between 2000 and 2019.
Context
Broad environmental policies and actions
The European Green Deal (COM(2019) 640 final) provides a roadmap for delivering a sustainable EU economy. To overcome the challenges of climate change and environmental degradation, the EU’s new growth strategy aims to transform the EU into a modern, resource-efficient and competitive economy where: there are no net emissions of greenhouse gases by 2050; economic growth is decoupled from resource use; no person and no place is left behind. It is hoped that this can be done by turning climate and environmental challenges into opportunities across all policy areas.
Since the 2015 adoption of the 2030 Agenda for Sustainable Development, the EU has made progress towards delivering the SDGs. The EU is fully committed to implementing the agenda, and has embarked on a transition towards a low-carbon, climate-neutral, resource-efficient and circular economy. In particular, the EU’s 2030 climate and energy framework sets out the objectives of: a 40 % cut in greenhouse gas emissions; a 32 % share of energy from renewable sources; and a 32.5 % improvement in energy efficiency (compared with 1990 levels).
Biodiversity
The European Commission has identified five main issues that are thought to be driving a loss of biodiversity: changes in land and sea use, overexploitation, climate change, pollution and invasive alien species. The EU Biodiversity Strategy for 2030 — Bringing nature back into our lives (COM(2020) 380 final) aims to ensure that the EU’s biodiversity will be on the path to recovery by 2030 for the benefit of people, the planet, the climate and the economy, in line with the 2030 Agenda for Sustainable Development and with the objectives of the Paris Agreement on Climate Change. As part of the strategy, the EU has planned, among other targets: legal protection of at least 30 % of its land and sea area as part of a trans-European nature network; the protection of all remaining EU primary and old-growth forests; that at least 10 % of agricultural area is under high-diversity landscape features; that three billion new trees are planted in the EU; that at least 25 000 km of free-flowing rivers are restored.
Clean air
The European Commission adopted a Clean Air Policy Package in 2013. This aimed to achieve full compliance with existing air quality legislation by 2020 and further improve the EU’s air quality by 2030 and thereafter. Its long-term objective is to achieve levels of air quality that do not result in unacceptable impacts on, and risks to, human health and the environment.
In 2021, the European Commission adopted, as part of the European Green Deal, an EU Action Plan: 'Towards zero pollution for air, water and soil' (COM(2021) 400 final) to better prevent, remedy, monitor and report on pollution.
Soil protection
The European Commission adopted a strategy in 2006 to ensure a high level of soil protection. A communication titled Thematic Strategy for Soil Protection (COM(2006) 231 final) outlined the objectives of protecting soil functions and preventing further soil degradation in the EU, underlining the essential role that soil plays as a natural resource and recognising the threats that are posed by soil erosion. The European Commission has sought to mitigate the negative impact of sealing on soil functions by developing a set of best practices. The European Commission will put forward plans to update the EU’s soil thematic strategy in 2021.
European Green Deal
During 2021, a large number of legislative initiatives are planned in relation to the European Green Deal. Under the heading ‘Fit for 55 package’, a wide range of existing EU legislation on climate and energy issues will be reviewed in order to bring it into line with the target to reduce emissions by at least 55 % by 2030 (compared with 1990 levels). Various initiatives related to the circular economy are planned, for example concerning eco-design and sustainable products. Among other initiatives concerning biodiversity, the European Commission is preparing (at the time of writing) an action plan for the development of organic production. Concerning smart mobility, specific actions that the Commission intends to put forward in the second half of 2021 include revisions of the regulation on the trans-European transport network and of the directive on intelligent transport systems. Alongside these new initiatives, the European Commission is working on REFIT initiatives to make existing legislation simpler, less costly and future proof: a number of these initiatives relate to waste (such as waste shipments or packaging), industrial emissions, and statistics (on agriculture and fisheries).
In total, EUR 22.8 billion (in 2018 prices) have been budgeted specifically for environment and climate action between 2021 and 2027, including EUR 10.0 billion which has been allocated to the Just Transition Fund as part of the European Recovery Instrument (also known as Next Generation EU). The European Recovery Instrument is designed to support EU Member States to recover, repair and emerge stronger from the crisis. The Just Transition Fund is one pillar of the Just Transition Mechanism which aims to help Member States accelerate the transition to a green economy and thereby to boost their economies.
Alongside this funding specifically for the environment and climate change, the 2021-2027 multiannual financial framework and the European Recovery Instrument include funding for other headings that impact directly or indirectly on the environment. For example, the 2021-2027 framework includes EUR 77.9 billion for the European Agricultural Fund for Rural Development (EAFRD) and the European Recovery Instrument a further EUR 7.5 billion for the same fund. The EAFRD is expected to help farmers and rural areas to deliver the green transition and support investments and reforms essential to the EU’s environmental targets.
Maps can be explored interactively using Eurostat’s statistical atlas (see user manual).
This article forms part of Eurostat’s annual flagship publication, the Eurostat regional yearbook.
Explore further
Other articles
Database
Thematic section
Publications
Selected datasets
- Exposure to air pollution by particulate matter (source: EEA) (sdg_11_50)
Methodology
Manuals and further methodological information
- Environment statistics — methodology
- Land use/cover statistics (LUCAS) — methodology
- Methodological manual on territorial typologies — Eurostat — 2018 edition
- Redesign sample for Land Use/Cover Area Frame Survey (LUCAS) — Eurostat — 2018 edition
Metadata
- Air pollutants by source sector (ESMS metadata file — env_air_emis_esms)
- Land cover and land use, landscape (ESMS metadata file — lan_esms)
- The EU SDG indicator set 2021
External links
- Air quality in Europe — 2020 report (European Environment Agency — EEA)
- Biodiversity Information System for Europe (European Commission and the European Environment Agency)
- Copernicus global land surface (European Commission — JRC)
- CORINE land cover (European Environment Agency — EEA)
- European Climate Adaptation Platform (Climate-ADAPT) (European Commission and the European Environment Agency)
- European Environment Agency — EEA indicators
- Environment (European Commission — Directorate-General for Environment)
- European Green Deal
- European soil data centre (European Commission — JRC)
- INSPIRE (Infrastructure for spatial information in Europe)
- Land use (European Environment Agency — EEA)
- The Europe Forest Information System for Europe (FISE) (European Environment Agency — EEA)
Legislation
- Directive 2001/81/EC of 23 October 2001 on national emission ceilings for certain atmospheric pollutants (NEC Directive) (Summary)
- Directive 2008/50/EC of the European Parliament and of the Council of 21 May 2008 on ambient air quality and cleaner air for Europe
- Summaries of EU legislation: cleaner air for Europe
- Summaries of EU legislation: national emission limits for certain air pollutants

