This is a machine translation provided by the European Commission’s eTranslation service to help you understand this page. Please read the conditions of use.
This special page shows all uploaded files.
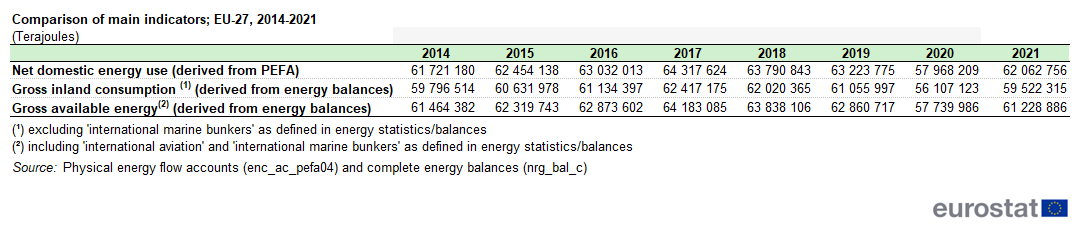
,_2021,_Terajoule.png)
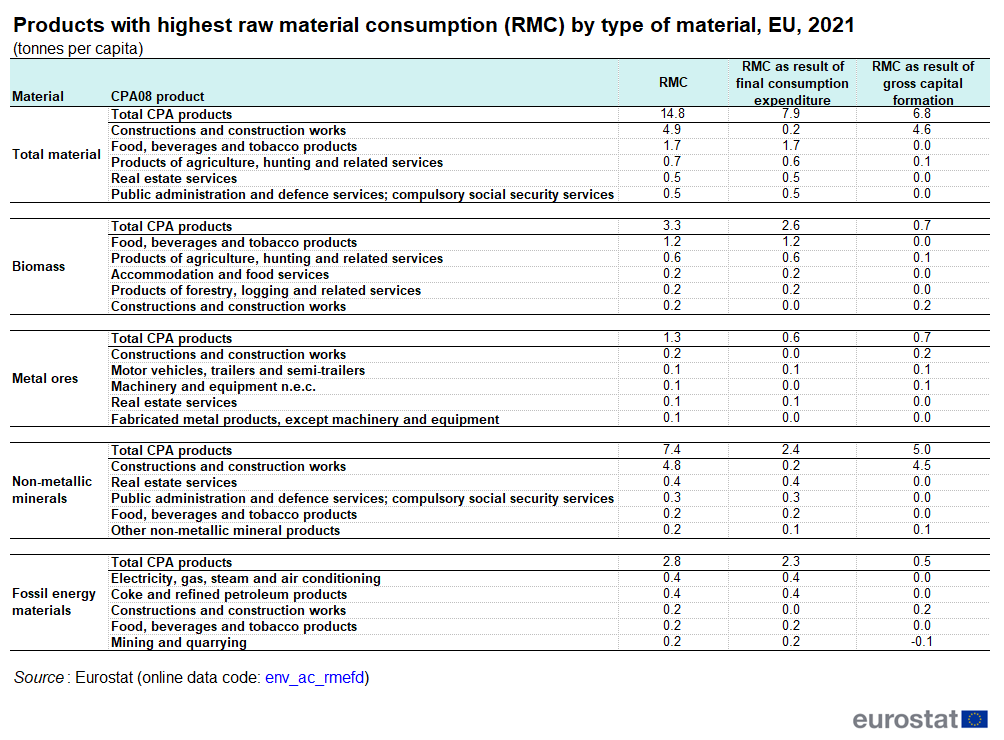
_by_type_of_material,_EU,_2021.png)
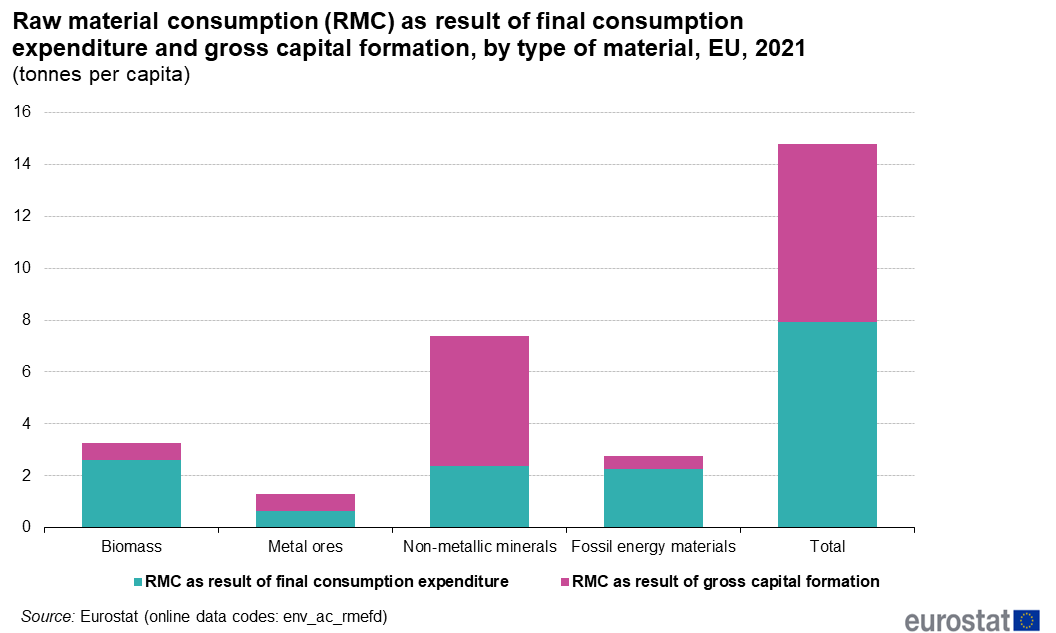
_as_result_of_final_consumption_expenditure_and_gross_capital_formation,_by_type_of_material,_EU,_2021_(tonnes_per_capita).png)
.png)
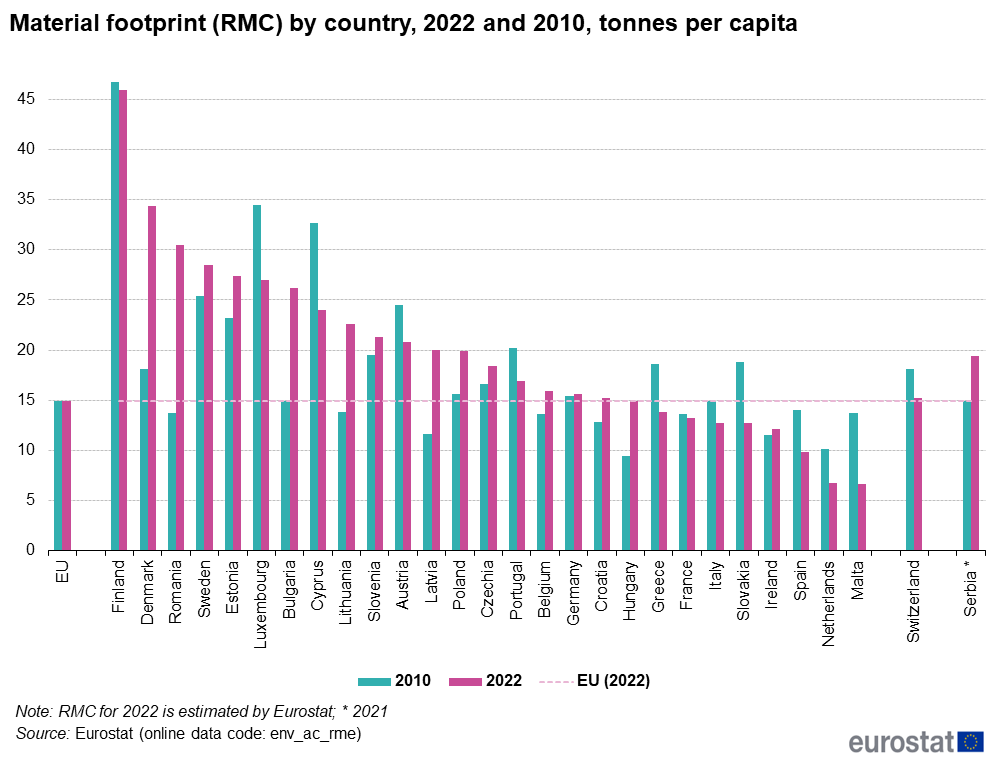
_by_country,_2022_and_2010,_t_per_cap.png)
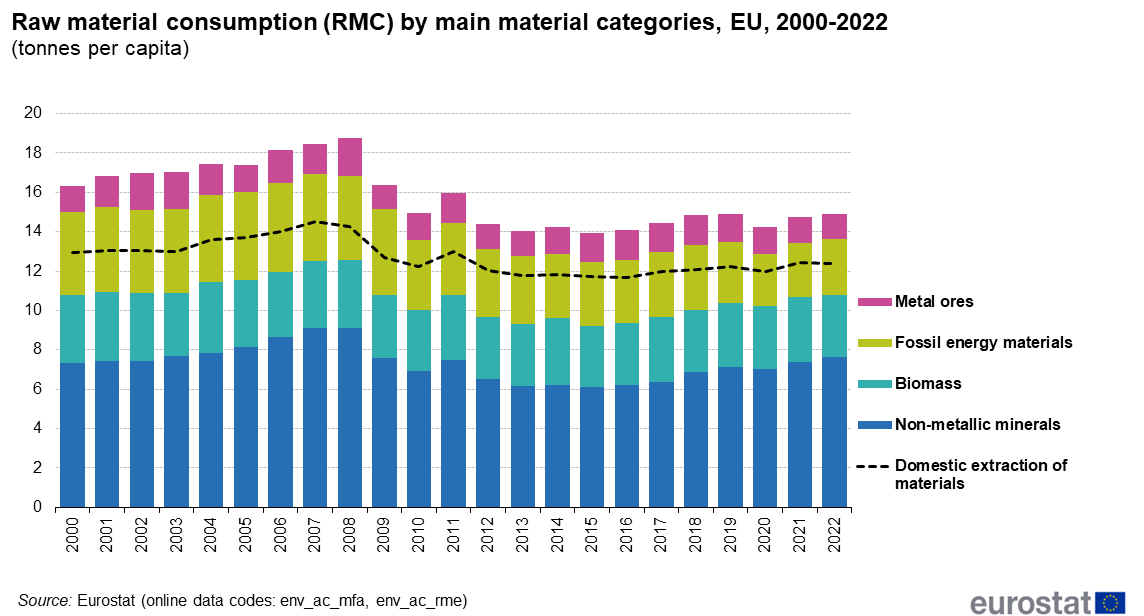
_by_main_material_categories,_EU,_2000-2022_(t_per_cap).png)


.png)
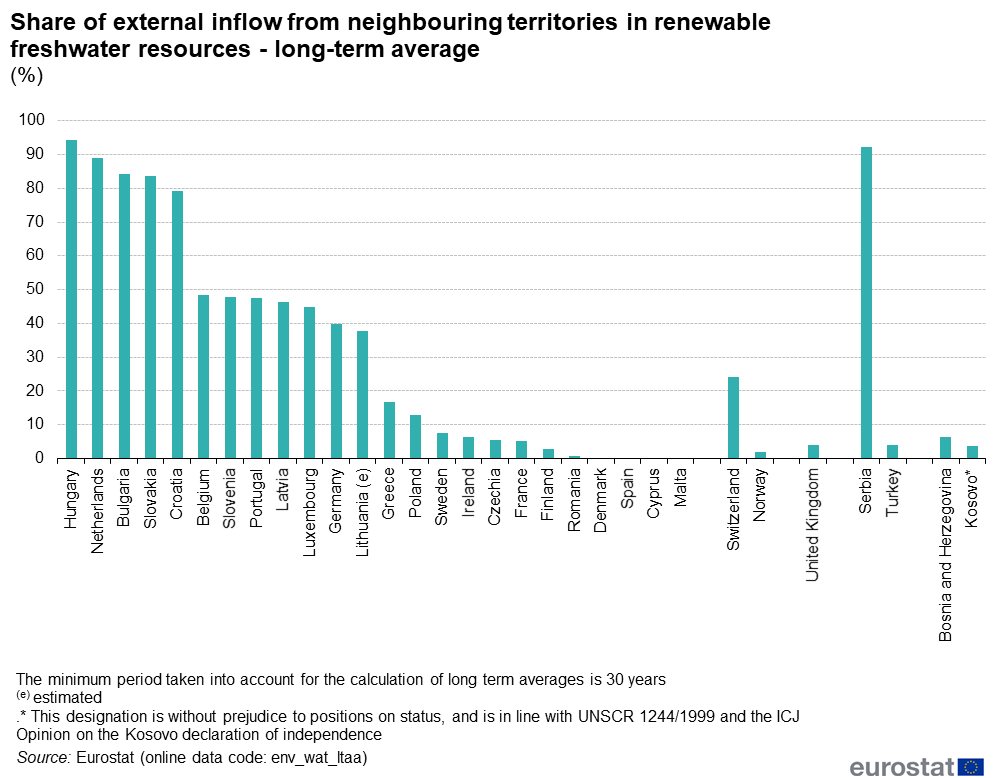
.pnger_resources_-_long-term_average_(%25).png)
.png)
.png)

.png)


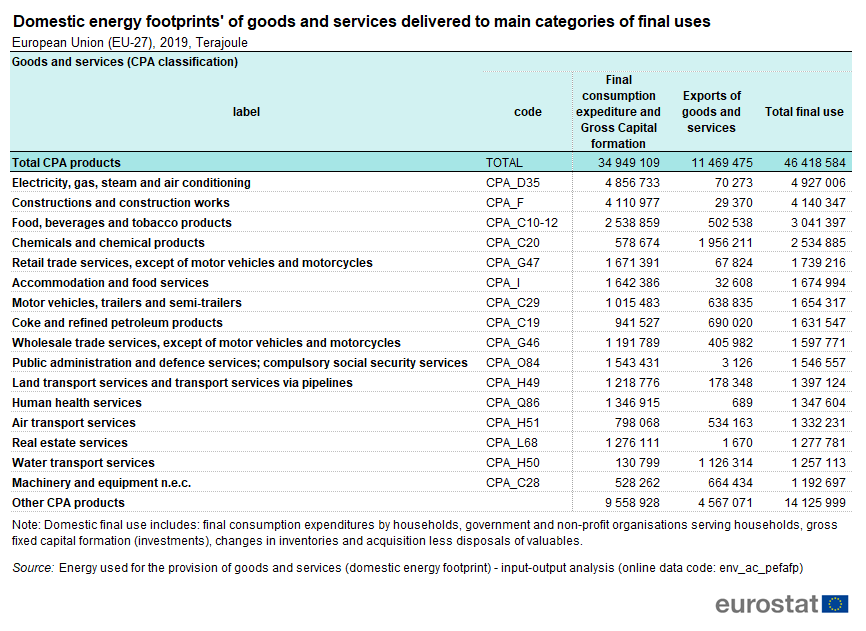
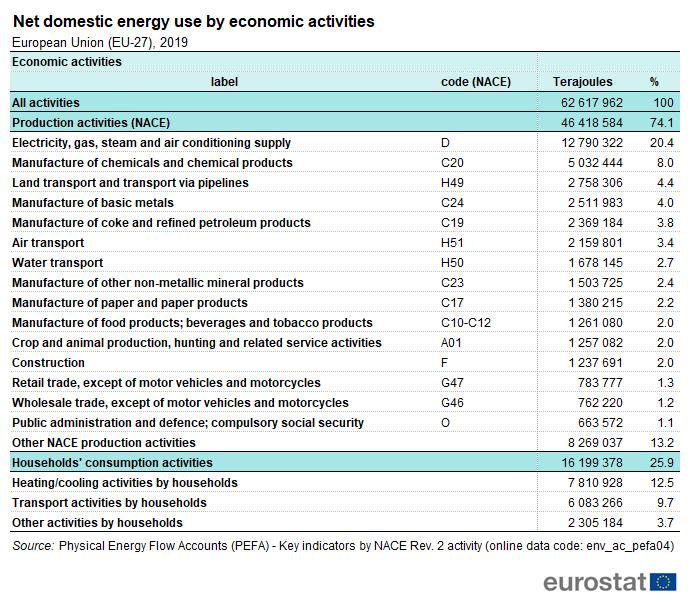
,_2019,_Terajoule.png)

,_2019.png)
.png)

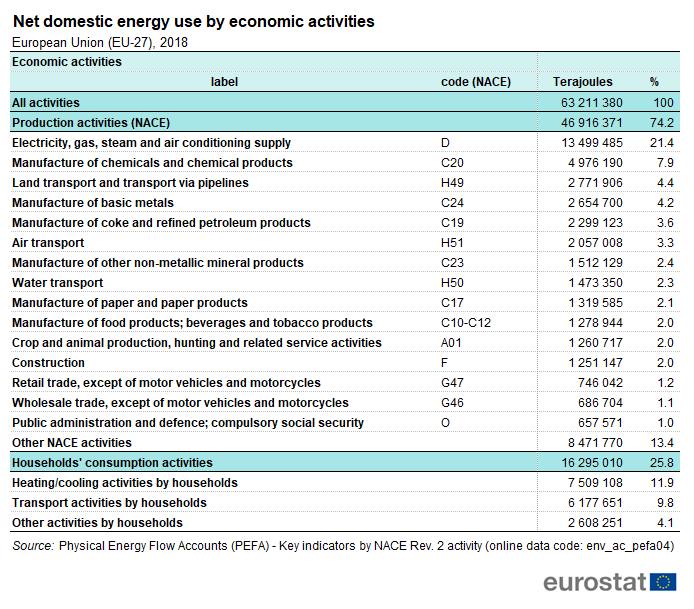
,_2018.png)
.png)

,_2017.png)
.png)
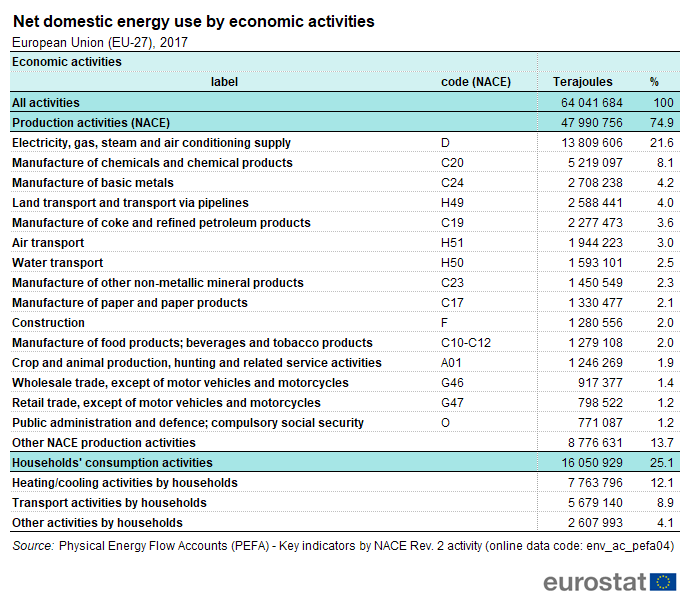
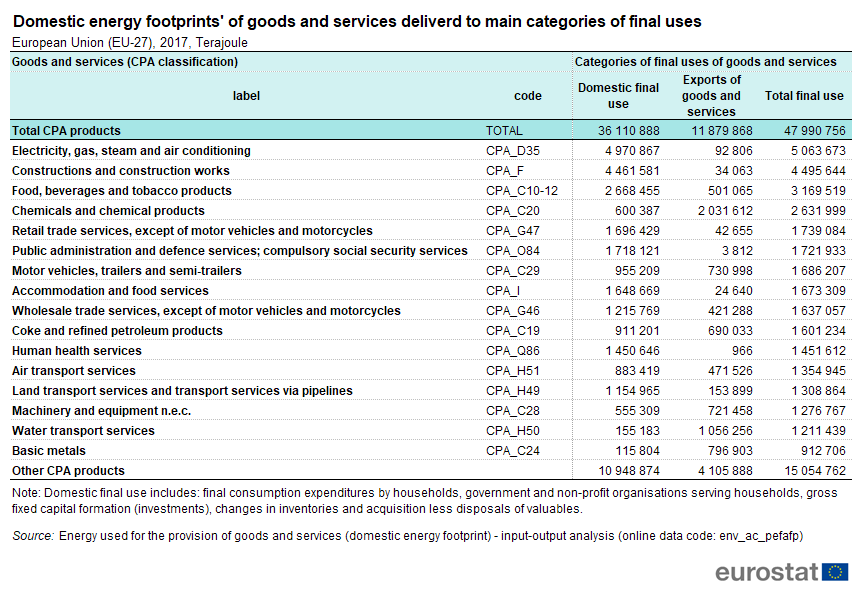
,_2017,_Terajoule.png)
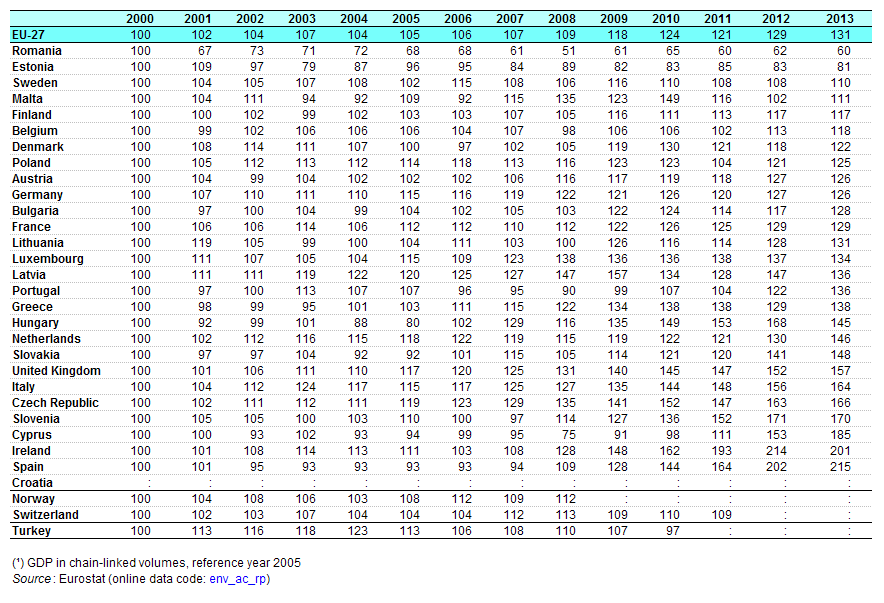
_by_country_2000-2013.png)
.png)
.png)
.png)