Reference metadata describe statistical concepts and methodologies used for the collection and generation of data. They provide information on data quality and, since they are strongly content-oriented, assist users in interpreting the data. Reference metadata, unlike structural metadata, can be decoupled from the data.
Eurostat, the statistical office of the European Union
1.2. Contact organisation unit
E1: Agriculture and fisheries
1.3. Contact name
Confidential because of GDPR
1.4. Contact person function
Confidential because of GDPR
1.5. Contact mail address
2920 Luxembourg LUXEMBOURG
1.6. Contact email address
Confidential because of GDPR
1.7. Contact phone number
Confidential because of GDPR
1.8. Contact fax number
Confidential because of GDPR
2.1. Metadata last certified
18 June 2024
2.2. Metadata last posted
27 February 2024
2.3. Metadata last update
27 February 2024
3.1. Data description
The data describe the structure of agricultural holdings providing the general characteristics of farms and farmers and information on their land, livestock and labour force. They also describe production methods, rural development measures and agro-environmental aspects that look at the impact of agriculture on the environment.
The data are used by public, researchers, farmers and policy-makers to better understand the state of the farming sector and the impact of agriculture on the environment. The data follow up the changes in the agricultural sector and provide a basis for decision-making in the Common Agricultural Policy (CAP) and other European Union policies.
The statistical unit is the agricultural holding (farm). The aggregated results are disseminated through statistical tables. The data are presented at different geographical levels and over periods.
The data collections are organised in line with the EU legislation. For 2020 (the agricultural census), 2023 and 2026, they are organised in line with the Regulation (EU) 2018/1091 and have a new structure, consisting of a core data set and several modules. The data are as comparable and coherent as possible across European countries.
3.2. Classification system
Data are arranged in tables using many classifications. Please find below information on most classifications.
The farm typology means a uniform classification of the holdings based on their type of farming and their economic size. Both are determined on the basis of the standard gross margin (SGM) (until 2007) or standard output (SO) (from 2010 onward) which is calculated for each crop and animal. The farm type is determined by the relative contribution of the different productions to the total standard gross margin or the standard output of the holding. For the legal acts governing the typology system from 1990 onwards, please consult List of Regulations and Decisions underlying the farm structure surveys in the annex of item 6.1.
The territorial classification uses the NUTS classification to break down the regional data. The regional data is available at NUTS level 2.
3.3. Coverage - sector
The statistics cover agricultural holdings undertaking agricultural activities as listed in item 3.5 below and meeting the minimum coverage requirements (thresholds) as listed in item 3.6 below.
3.4. Statistical concepts and definitions
Both the censuses and the sample surveys are aimed at producing a variety of information on specific CAP targets, as well as providing a basis for extrapolating Farm Accountancy Data Network (FADN) data.
A set of characteristics and definitions are set in legislation, please consult List of Regulations and Decisions underlying the farm structure surveys in the annex of the item 6.1. Some exceptions are nevertheless recorded. For 1990-2005, see annex Exceptions and explanations on the characteristics of FSS surveys 1990-2005. Since 2007, see the national methodological reports.
Information regarding the following groups of characteristics is available:
Land area and its utilisation: size and distribution of the land area of the holding, in particular utilised agricultural area (UAA) which comprises arable land, permanent grassland, permanent crops and kitchen gardens.
Livestock: animals kept on the holding (cattle, sheep, goats, pigs, poultry, equidae and other animals expressed in heads or in livestock units (LSU) where 1 LSU is the grazing equivalent of one adult dairy cow).
Machinery and equipments necessary to cultivate the land or manage the holding activity.
Secondary activities (activities directly related to the holding using the resources and/or products of the holding) and agro-environmental aspects.
For 2020, the list of core variables is set in Annex III of Regulation (EU) 2018/1091.The descriptions of the core variables as well as the lists and descriptions of the variables for the modules collected in 2019/2020 are set in Commission Implementing Regulation (EU) 2018/1874. The following groups of variables are collected:
for core: location of the holding, legal personality of the holding, manager, type of tenure of the utilised agricultural area, variables of land, organic farming, irrigation on cultivated outdoor area, variables of livestock, organic production methods applied to animal production;
for the module "Labour force and other gainful activities": farm management, family labour force, non-family labour force, other gainful activities directly and not directly related to the agricultural holding;
for the module "Rural development": support received by agricultural holdings through various rural development measures;
for the module "Animal housing and rural development module":animal housing, nutrient use and manure on the farm, manure application techniques, facilities for manure.
A complete glossary of agricultural statistics is available for users.
The statistical population consists of agricultural holdings which meet the minimum requirements set up in the IFS/FSS legislative framework.
For 2020, the data cover in each country the agricultural holdings and common land agricultural units that meet at least one of the physical thresholds set in Annex II of Regulation (EU) 2018/1091 with regard to the size of agricultural land or the number of livestock units.
Where those thresholds did cover at least 98 % of the total national UAA (excluding kitchen gardens) and 98 % of the total national livestock units (LSU), countries extended the frame by establishing lower and/or additional thresholds. The countries in this situation answered "Yes" to the national quality report item 3.6.1.2. However these countries had to collect only the core and not also the module data on the frame extension, so the module data do not necessarily ensure the 98 % minimum UAA and LSU requirements in those countries.
By way of exception, where those thresholds cover more than 98 % of the national agricultural production (measured by the Standard Output), those countries established higher physical or corresponding economic thresholds, still complying with the 98% minimum UAA and LSU requirements. These countries answered "Yes" to the national quality report item 3.6.1.1.
The attached file presents the thresholds used by the EU countries and Norway to cover core data in IFS 2020.
The following graph illustrates the thresholds used by the EU countries, Norway and Iceland to cover core data, for IFS 2020. The information is provisional for Iceland.
From 2010 until 2016, following the entry into force of Regulation (EC) No 1166/2008, all countries included all holdings above at least one threshold of a set of thresholds. For the set of thresholds (set by legislation), as well as for the specific thresholds applied by countries between 2007 and 2013, see Farm structure survey - survey coverage. Countries which used a survey threshold above one hectare UAA were allowed to fix this threshold at a level that excludes only the smallest agricultural holdings which together contribute 2 % or less to the total UAA excluding common land and 2 % or less to the total number of farm livestock units (LSU).
Until the FSS 2007, in accordance with Regulation (EEC) No 571/88, the countries which applied a threshold of above one hectare of utilised agricultural area (UAA) committed themselves to fix this threshold at a level excluding only the smallest holdings, which together contributed 1 % or less to the total standard gross margin (SGM).
The 2020 agricultural census covers the European Union, Iceland, Norway, Switzerland. For earlier years, data from candidate countries and potential candidates are also received.
See for which country and year the data are available on Eurostat website, in the FSS glossary article.
3.8. Coverage - Time
FSS has been carried out since 1966.
The online database is only available from 1990 onwards. See for which country and year the data are available on Eurostat website, in the FSS glossary article.
The label for Germany has been changed in July 2023 from "Germany (until 1990 former territory of the FRG)" to "Germany".
3.9. Base period
The FSS data have been processed with SGM coefficients/SO coefficients (calculated as a 3-year average in the case of SGM and 5-year average in the case of SO).
The 2020 data are processed with 2017 SO coefficients (calculated as a 5-year average of the period 2015-2019).
the units of measurement for the variables (area in hectares, livestock in (1000) heads or LSU (livestock units), labour force in persons or AWU (annual working units), standard output in Euro, places for animal housing etc.) and
the number of agricultural holdings having these characteristics.
FSS data are available for the following years: 1989/1990, 1993, 1995, 1997, 1999/2000, 2003, 2005, 2007, 2009/2010, 2013 and 2016. The agricultural censuses are in line with the FAO recommendations and are carried out every 10 years. The intermediate surveys are organised 3 (until 2007) or 2 times (since 2010) between the censuses. The exact reference periods are determined in legislation.
For 2020, 2023 and 2026, the reference periods are provided in Article 10 of Regulation (EU) 1091/2018. Article 19 of the same Regulation provides derogations for Greece and Portugal, where the references to the year 2020 shall be replaced by references to the year 2019, if necessary. In practice, only Portugal used this derogation. For 2020, 2023 and 2026, the reference periods are:
Reference period for land variables The use of land refers to the reference year 2019/2020. In the case of successive crops from the same piece of land, the land use refers to a crop that is harvested during the reference year, regardless of when the crop in question is sown.
Reference period for variables on irrigation and soil management practices The 12-month period ending on a day within the reference year 2019/2020. That day varies across countries.
Reference day for variables on livestock and animal housing A reference day within the reference year 2019/2020. That day varies across countries.
Reference period for variables on manure management A period of 12-month that includes the reference day used for livestock and animal housing. That period varies across countries.
Reference period for variables on labour force The 12-month period ending on a day within the reference year 2019/2020. That period varies across countries.
Reference period for variables on rural development measures The three-year period ending on 31 December 2019/2020.
Reference day for all other variables A reference day within the reference year 2019/2020. That day varies across countries.
The following tables present for 2020 the reference days/periods used by EU countries, Iceland and Norway for specific groups of variables. The information for Iceland is provisional.
For 2010, 2013 and 2016, the reference periods are provided in Article 8 of the Regulation (EC) No 1166/2008. Article 16 of the same Regulation provides derogations for Greece, Spain and Portugal, where the references to the year 2010 are replaced by references to the year 2009. For more information on the comparability of reference periods in 2013 across countries and between 2013 and 2010 by country, see Farm structure survey - reference periods.
The surveys 1990 and 2000 covered a period between 1 December 1988 and 1 March 1991, respectively 1 December 1998 and 1 March 2001, thus the actual survey varied from country to country. See for which country and year the data is available on Eurostat website in the FSS glossary article.
6.1. Institutional Mandate - legal acts and other agreements
The rules governing the farm structure surveys are laid down in a number of Council Regulations and Commission Regulations and Decisions.
The annex List of the Regulations and Decisions underlying the FSS presents all legal acts by survey year and type of information provided (organisation of surveys, characteristics, definitions, tables, deadlines for data transmission, typology). For the latest data collections, the legislation is (also) presented on a dedicated page, see section "Farm structure".
The NUTS classification is originally based on the establishment of a common classification of territorial units for statistics. The Regulation also specifies the stability of the classification for at least three years. Stability makes sure that data refer to the same regional unit for a certain period of time. This is crucial for statistics, in particular for time-series. However, sometimes national interests require changing the regional breakdown of a country. When this happens the country concerned informs the European Commission about the changes. The Commission in turn amends the classification at the end of period of stability according the rules of the NUTS Regulation. Therefore, the subsequent regular amendments to the annexes were adopted by Commission Regulation (EC) No 105/2007, Commission Regulation (EU) No 31/2011, Commission Regulation (EU) No 1319/2013, Commission Regulation (EU) 2016/2066 and Commission Delegated Regulation 2019/1755, establishing the NUTS versions 2007, 2010, 2013, 2016 and 2021. In addition, the NUTS classification was completed with the regional breakdowns of the countries that joined the EU (please see Regulation (EC) No 1888/2005 and Regulation (EC) No 176/2008), and updated by Commission Regulation (EU) No 868/2014, Commission Regulation (EU) No 1046/2012. For more information, see the NUTS website.
Regulation (EC) No 223/2009 on European statistics, amended by Regulation (EU) 2015/759 stipulates the need to establish common principles and guidelines ensuring the confidentiality of data used for the production of European statistics and the access to those confidential data with due account for technical developments and the requirements of users in a democratic society.
7.2. Confidentiality - data treatment
In the tables disseminated on Eurostat website, a cell is confidential if:
the (extrapolated) number of holdings that contribute to the cell (extrapolated) value is less than or equal to a certain threshold and/or
the n largest (extrapolated) holdings represent more than a certain percentage k% of the cell (extrapolated) value.
A confidential value is replaced with ":c".
For non-confidential cells:
until IFS 2020, the extrapolated number of holdings and all values of variables in cells are rounded to the closest multiple of 10.
starting with IFS 2023, the extrapolated number of holdings and all values of variables in cells falling in interval [1,7] are rounded to 5, while if they are at least 8 they are rounded to the nearest multiple of 10.
Because of the confidentiality treatment, the sum of the individual cells does not systematically match with the value of the "total" cell.
The following graphs present the rules used by countries to identify confidentiality cells when they disseminate national data, for IFS 2020. For Iceland, the information is provisional.
The following graphs present the methods used by countries to protect confidential data cells when they disseminate national data, for IFS 2020. For Iceland, the information is provisional.
The following graphs present the methods of perturbation used by countries when they disseminate national data, for IFS 2020. For Iceland, the information is provisional.
8.1. Release calendar
There is no fixed release deadline for Integrated Farm Statistics. Only transmission deadlines are set in legislation.
In line with the Community legal framework and the European Statistics Code of Practice, Eurostat disseminates European statistics on Eurostat's website (see principle 10 - 'Accessibility and clarity') respecting professional independence and in an objective, professional and transparent manner in which all users are treated equitably. The detailed arrangements are governed by the Eurostat protocol on impartial access to Eurostat data for users.
Results are disseminated 2 years after the reference year.
The FSS results have been published in a series of statistical books, pocketbooks, Eurostat yearbooks and Statistics Explained articles, including a complete glossary:
Data for censuses carried out every 10 years are sometimes available in a three-level geographical breakdowns of the whole country, the regions and the districts; while data for intermediate sample-based surveys are only available upon the two-levels of country and regions.
Since FSS 1999/2000, information about local farm location is collected in most countries, so the data can also be disseminated by NUTS and are robust regarding the changes in the NUTS definition.
The FSS 2009/2010 information is in line with the NUTS 2010 classification: Commission Regulation (EU) No 31/2011 amending the NUTS classification from January 2003.
The FSS 2016 information is in line with the NUTS 2013 classification.
The IFS 2020 information is in line with the NUTS 2021 classification.
FSS/IFS surveys do not cover the whole territory but only the land covered by the agricultural holdings. So the land use data without link with farm characteristics should be downloaded by the user from the relevant domain.
Production of paper and on-line publications in countries
The following graphs present the shares of countries that produced paper and on-line publications for IFS 2020. For Iceland, the information is provisional.
10.3. Dissemination format - online database
The main dissemination outlet is the website of Eurostat. Aggregates at regional (NUTS 2), national and European level are published under node "Farm structure" (ef). The results span a considerable number of variables, broken down by groups of holdings formed according to several of the classification characteristics on which data were collected or compiled.
The following graph presents the share of countries publishing an online database including IFS 2020 data. The information for Iceland is provisional.
In 2017, the Working Group on the Structure of Agricultural Holdings supported the release of the Farm Structure Survey (FSS) data in the form of scientific use files. The adopted methodology is common to all countries and also outlines specific measures requested by some countries.
The following graph presents the share of countries with accessible microdata at national level, for IFS 2020. The information for Iceland is provisional.
The following graph presents the share of countries having a national handbook on methodology, for IFS 2020. The information for Iceland is provisional.
Countries and Eurostat perform a systematic data validation. See item 18.4.
For the national quality reports, see items 10.6 and 10.7.
Peer reviews in Eurostat concluded in 2008 and in 2024.
An Internal Audit was undertaken in Eurostat in 2013.
The following graph presents the quality assurance and assessment procedures in countries, for IFS 2020. The information for Iceland is provisional.
11.2. Quality management - assessment
Data are collected from reliable sources applying high standards with regard to the methodology and ensuring a high degree of comparability.
The national methodological reports (quality reports), sent by the countries for each survey, comprise information on each of the quality aspects defined by Eurostat. The quality reports are aligned to the European Standard Quality Reporting Structure.
The following graph presents the share of countries having a national quality management system, for IFS 2020. The information for Iceland is provisional.
12.1. Relevance - User Needs
The users are all the stakeholders in the Common Agricultural Policy (CAP) and other policy areas such as environment, regional development, climate change and health:
policy makers: DG Agriculture, National Ministries of Agriculture, European Parliament etc.;
reviewers, assessers, analysts;
professional groups (unions, press);
researchers.
12.2. Relevance - User Satisfaction
The following graphs present the share of countries that conducted an user satisfaction survey and the level of satisfaction in the countries that conducted an user satisfaction survey, for IFS 2020. The information for Iceland is provisional.
12.3. Completeness
According to the Regulation (EC) No 2018/1091 and Regulation (EC) No 1166/2008, if a country determines that a variable has a low or zero prevalence, the variable may be excluded from the data collection. For each data collection, the countries send a file by indicating the list of non-existent (NE) and non-significant (NS) variables with related reasons and the used sources. These lists can be accessed on Eurostat's website.
The value of a NS variable is not significant compared to the whole population, because it is for example not grown/raised due to climate conditions or it is not profitable enough.
For designating a variable non-significant, Eurostat recommends the following general thresholds:
area is less than 0.01% of total UAA;
the LSU is under 0.5-1% of total LSU;
the share of holdings with the variable in question (e.g. "more that 50% of the value of the final production self-consumed by the holder", "other gainful activities") is less than 2% of total number of holdings.
However, the designation of a variable as NS is subjective and it is not possible to give a threshold fully applicable to all countries and all variables. In other words, thresholds are different for different agricultural crops and livestock units in different countries.
12.3.1. Data completeness - rate
Not applicable for Integrated Farm Statistics as the not collected variables (not-significant variables and not-existent variables) are completed with 0.
13.1. Accuracy - overall
Regulation (EC) No 2018/1091 and Regulation (EC) No 1166/2008 require the estimates to be representative at the level of NUTS2 regions and by farm type and by size of agricultural holdings. This means that the estimates should be reliable and can be disseminated without quality concerns at NUTS2 regions. This does however not hold for lower geographical levels, e.g. NUTS 3, unless for countries which stratify by NUTS 3. The sample surveys are usually stratified at NUTS 2 level.
The results of sample surveys are extrapolated with one (sometimes two) weighting factor(s) for a wide range of characteristics. Therefore the accuracy of estimates is affected by sampling errors. In addition, accuracy is also affected by non-sampling errors which cause both variability and bias in the estimates.
13.2. Sampling error
Regulation (EC) No 2018/1091 provides sets of precision requirements, each set corresponding to each core and module data collections. For 2020, the precision requirements apply to all NUTS 2 regions with at least 10 000 holdings in the relevant population of the core/module. For a NUTS 2 region with fewer than 10 000 holdings, those precision requirements apply instead to the associated NUTS 1 region, provided that the associated NUTS 1 region contains at least 1 000 holdings in the relevant population of the core/module. The precision requirements are applied only if the prevalence of the variable surpasses a certain threshold in the respective region. A precision requirement at national level apply for main crop and livestock variables of the 2020 modules with no applicable precision requirement for any NUTS 2 and NUTS 1 regions for any variable.
Regulation (EC) No 1166/2008 provides for two sets of precision requirements, one for the FSS sample (i.e. non-census) surveys and another for the SAPM (survey on agricultural production methods) in 2010. For the FSS, precision requirements are defined for a list of 21 variables; these precision requirements apply to all NUTS 2 regions with at least 10 000 holdings. For a NUTS 2 region with fewer than 10 000 holdings, those precision requirements apply instead to the associated NUTS 1 region, provided that the associated NUTS 1 region contains at least 1 000 holdings. For the SAPM, a reduced list of 10 variables is defined. The precision requirements are applied only if the prevalence of the variable surpasses a certain threshold in the respective region.
Eurostat publishes estimates for many more variables than those for which precision requirements are set in regulations and for many types of population breakdowns, while the variables determining these breakdowns are not stratification variables in the sampling design. Since some cells' estimates, being of poor quality, likely send misleading messages to data users, the following EU quality rating system is implemented for cells' estimates:
for totals of continuous variables and some ratios- the coefficient of variation (relative standard error) flag system: -below 24.99% - estimates are released; -25.0% - 34.99% - estimates are released with warning, to be used with caution; released cell values are followed by letter 'u'; -35.0% and more - too unreliable, estimates are not released; cells are flagged with 'u'.
for proportions, shares and some ratios - the standard error flag system: -below 12.49 percentage points - estimates are released; -12.5 percentage points - 17.49 percentage points - estimates are released with warning, to be used with caution; released cell values are followed by letter 'u'; -17.5 percentage points and more - too unreliable, estimates are not released; cells are flagged with 'u'.
Counts are first converted to proportions, standard errors are estimated for the corresponding proportions and the quality rating system for proportions is applied.
The following graphs present information on countries that apply the EU quality rating system, that apply another quality rating system and that do not apply a quality rating system, for the 2020 data. The information is provisional for Iceland.
13.2.1. Sampling error - indicators
The national quality reports/national methodological reports provide the relative standard errors (RSEs) for the main crop and livestock variables, for which precision requirements are set in legislation. The reports also provide details on the methods used by countries for the estimation of the RSEs. Finally, the reports indicate the reasons for possible cases where precision requirements are applicable and estimated RSEs are above the thresholds (the reason is usually the variability of the variables between the sampling design and the data collection).
Eurostat does not disseminate the sampling errors (the RSEs) for the data in tables, but calculates and uses the RSEs to suppress or indicate low reliability of the data in tables.
13.3. Non-sampling error
See sub-categories below.
13.3.1. Coverage error
The national methodological reports/quality reports provide reasons and treatments on coverage errors.
13.3.1.1. Over-coverage - rate
The national methodological reports/quality reports provide over-coverage rates.
The following graphs present the type of holdings included in the frame but not belonging to the population of the core, in countries, for IFS 2020. The information for Iceland is provisional.
The following graphs present the actions undertaken by countries to minimise the over-coverage errors, for IFS 2020. The information for Iceland is provisional.
13.3.1.2. Common units - proportion
Not applicable.
13.3.2. Measurement error
The national methodological reports/quality reports provide reasons and treatments on measurement errors.
The national methodological reports/quality reports provide reasons and treatments on non-response errors.
Non-response errors are generally very low because the legislation in place obliges response with fines in many countries in case of non-response.
13.3.3.1. Unit non-response - rate
The national methodological reports/quality reports provide unit non-response rates.
13.3.3.2. Item non-response - rate
The national methodological reports/quality reports provide information on item non-response rates.
13.3.4. Processing error
The national methodological reports/quality reports provide reasons and treatments on processing errors.
Processing errors are low because the on-line surveys and questionnaires embedded in IT applications include consistency checks and validation rules.
The following graphs present the sources of processing errors in countries, for IFS 2020. The information for Iceland is provisional.
The following graphs present the imputation methods used by countries, for IFS 2020. The information for Iceland is provisional.
13.3.5. Model assumption error
Seasonal adjustment is not applicable. On the other hand, a few countries apply calibration but the related error is not estimated.
14.1. Timeliness
The deadlines for the transmission of FSS data are set by legislation.
For IFS 2020, Member States shall transmit validated core and module data and a quality report to the Commission (Eurostat) within 15 months after the end of the reference year.
For the FSS 2013 and 2016, Member States transmitted validated survey data to the Commission within 12 months of the end of the survey year. Data relating to the rural development measures could be transmitted to the Commission separately within 18 months of the end of the survey year.
Results are disseminated following validation, confidentiality treatment and tabulation, 2 years after the reference year.
Comparability across countries is considered high. Harmonisation of concepts and methods is ensured by a number of Commission Regulations and Decisions providing detailed information on list of variables/characteristics, on rules and procedures that should be followed and on time-frame within which FSS/IFS should be conducted. The same data are available for all countries. Besides, the censuses carried out every 10 years are in line with the FAO recommendations enhancing this way the comparability with countries outside Europe including USA and Japan.
Comparability problems between European countries concern:
1. Survey coverage
Each country is allowed, in line with the legislation, to set up thresholds at a level that excludes very small holdings, as long as the conditions for minimum coverage are guaranteed. Consequently, all countries have set up a system of country-specific alternative thresholds, which ensure that the requested minimum coverage is respected. For IFS 2020, the data on core and module variables cover all holdings above the thresholds set in the Regulation (EU) 2018/1091, with the exception of some countries that raised the thresholds. The data on core variables cover at least 98% of the utilised agricultural area (without kitchen gardens) and at least 98% of the livestock units in each country. However the data on module variables do not have this minimum coverage in all countries.
Overview of the coverage, comparability possibilities and limitations for each group of countries, in 2020
Group A: Countries with core and module data on main frame plus frame extension
Countries: AT BG CY EL HR HU IT LV MT PL PT RO
Group B: Countries with core data on main frame and frame extension and module data only on main frame
Countries: ES LT SI
Group C: Countries with core and module data only on main frame
Countries: BE CH CZ DE DK EE FI FR IE IS LU NL NO SE SK
Coverage
Both core and module data cover the agricultural holdings accounting for at least 98% of the total utilised agricultural area (without kitchen gardens) and at least 98% of the total livestock units of the country.
The core data cover the agricultural holdings accounting for at least 98% of the total utilised agricultural area (without kitchen gardens) and at least 98% of the total livestock units of the country.
While the module data do not meet these coverage requirements, the data coverage still complies with the minimum requirements of Regulation (EU) 2018/1091, which requires for modules only data on main frame.
Both core and module data cover the agricultural holdings accounting for at least 98% of the total utilised agricultural area (without kitchen gardens) and at least 98% of the total livestock units of the country
Comparability of data between countries
+ 2020 core and module data are comparable with the core and module data of the other countries from Groups A and C
+ 2020 core data are comparable with the core data of the countries from Group B
- 2020 module data are not comparable with the module data of the countries from Group B
+ 2020 core and module data are comparable with the core and module data of the other countries from Group B
+ 2020 core data are comparable with the core data of the countries from Groups A and C
- 2020 module data are not comparable with the module data of the countries from Group A and C
+ 2020 core and module data are comparable with the core and module data of the other countries from Groups A and C
+ 2020 core data are comparable with the core data of the countries from Group B
- 2020 module data are not comparable with the module data of the countries from Group B
Comparability between core and module data within the same country
+ within the country, the totals of core variables are computed on the same population scope as the totals of module variables, therefore, the totals of core and module variables can be interpreted in relation
- within the country, the totals of core variables are computed on a larger population scope than the totals of module variables, therefore, the totals of core and module variables cannot be interpreted in relation
+ within the country, the totals of core variables are computed on the same population scope as the totals of module variables, therefore, the totals of core and module variables can be interpreted in relation
For 2020, according to Regulation (EU) 2018/1091, the countries transmit the cell code of the 1 Km2 INSPIRE statistical units grid for pan-European usage.
For 2009/2010 and 2013, the methodology for geo-referencing the agricultural holdings is based on the geographical coordinates. Regulation (EC) No 1166/2008 defines the "location of the holding" as the latitude and longitude coordinates within an arc of 5 minutes that avoid the direct identification of an individual holding. If a latitude and longitude location contains only one agricultural holding, then this holding shall be attributed to a neighbouring location, which contains at least one other agricultural holding. In each country the geographical coordinates were attributed to each holding using distinct methodologies.
3. Common land
The way common land has been included in the data collections has an impact on the comparability of number of holdings, average size of holdings and livestock densities across countries and by dimensions within each country. In countries where all common land can be clearly rented by or allotted to an agricultural holding (based on written or oral agreements), it is not considered any more common land in statistics, but land normally used by the agricultural holding. In countries where common land is neither rented by, nor allotted to the agricultural holding, this land is actual common land in statistics and 3 different options (or some combination of these) to record common land areas have been used. For the presentation of the methods and options used by countries and the comparability problems for the period until 2013, see article Farm structure survey - common land. For 2016 and 2020, see the national quality/methodological reports.
The following graphs present the share of countries that collect common land data, and their used sources, for IFS 2020. The information for Iceland is provisional.
The following graph presents the countries that collect common land data, for IFS 2020. The information is provisional for Iceland.
The following table presents the methods used by countries to record data on common land, for IFS 2020. The information is provisional for Iceland.
National methods used to record common land data
IFS 2020
AT
Common land is included in the land of agricultural holdings renting or being allotted the land based on written or oral agreements.
BG
Common land is included in the land of agricultural holdings based on a statistical model.
CY
Common land is included in the land of agricultural holdings based on a statistical model.
DE
Common land is included in separate records representing virtual entities without managers.
EL
Common land is included in separate records representing virtual entities without managers.
ES
Common land is included in the land of agricultural holdings renting or being allotted the land based on written or oral agreements. Common land is included in the land of agricultural holdings based on a statistical model.
FR
Common land is included in the land of agricultural holdings based on a statistical model.
HR
Common land is included in the land of agricultural holdings renting or being allotted the land based on written or oral agreements. Common land is included in separate records representing virtual entities without managers.
HU
Common land is included in the land of agricultural holdings renting or being allotted the land based on written or oral agreements.
IE
Common land is included in separate records representing virtual entities without managers.
IT
Common land is included in separate records representing virtual entities without managers.
PL
Common land is included in separate records representing virtual entities without managers.
PT
Common land is included in the land of entities meeting the definition of agricultural holdings, having own managers.
RO
Common land is included in the land of agricultural holdings renting or being allotted the land based on written or oral agreements. Common land is included in the land of entities meeting the definition of agricultural holdings, having own managers.
SI
Common land is included in the land of agricultural holdings based on a statistical model.
IS
Common land is included in the land of entities meeting the definition of agricultural holdings, having own managers.
4. Annual working unit (AWU)
The AWU (the number of working hours and days in a year for a full-time job) varies across countries. Annual working units are used to calculate the farm work on the agricultural holdings. For the analysis of comparability of AWU across countries in FSS 2013, see article Farm structure survey - measurement errors. For 2016 and 2020, see the national quality/methodological reports.
5. Other gainful activities not related to holdings
For IFS 2020, Eurostat required countries to collect other gainful activities not related to holdings only for sole holder holdings where the holder is single manager. However some countries collect and transmit the data to Eurostat additionally on sole holders where holder is co-manager with their spouse or family member.
6. Animal housing and manure management (AHMM)
For IFS 2020, Eurostat required countries to collect the variables on AHMM only for holdings with at least one of the following: bovine animals, pigs, sheep, goats, poultry. However some countries collect and transmit the data to Eurostat additionally for holdings without animals because an important part of nutrients are used in holdings without livestock.
7. Irrigation
The area of crops which have actually been irrigated at least once during the 12 months prior to the reference day of the survey do not include crops under glass or other (accessible) protective cover and kitchen gardens which are almost always irrigated. If more than one crop is grown in a field during the harvest year, the area should only be indicated once: for the main crop, if irrigation was used for it, or otherwise for the most important irrigated secondary or successive crop. For 2010 and 2020, the volume of water that has been used for irrigation on the holding during the 12 months prior to the reference date of the survey, regardless of the source, is provided using data estimation, imputation, or modelling methods. This might affect comparability across countries.
See in addition the annex Exceptions and explanations on the characteristics of FSS surveys 1990 - 2005 in item 3.4.
15.1.1. Asymmetry for mirror flow statistics - coefficient
Not applicable, because there are no mirror flows in Integrated Farm Statistics.
15.2. Comparability - over time
The time series analysis in agricultural domain is mostly oriented to economic and social aspects of the agriculture such as the evolution of the labour force, the level of investment on the farms regarding environmental issues and the most relevant type of tenancy on the agricultural sector.
1. Real changes in the evolution of agricultural holdings
There is a decreasing trend in the number of agricultural holdings that appears in general over all European countries. Among the most important reasons to explain the changes over time are the abandonment of the agricultural activity, the lack of profitability of some crops and the increase of energy crops, based on the demand and subsidies. A time series analysis over a three year period helps to understand the impact of the agricultural policy on the agricultural practices i.e. the discontinuation of subsidies can lead to a quick and drastic decrease in the area used for the cultivation of a specific crop.
2. Methodological reasons affecting comparability over time
The length of the farm structure time series is variable between the countries. In some countries, the online time series go back to 1990, while other countries started only in 2013. The core data are comparable in the time series mostly as long as the country did not change the coverage thresholds between years. The module data are comparable in the time series mostly as long as the country did not change the coverage thresholds between years and as long as the 2020 module data cover the agricultural holdings accounting for at least 98% of the total utilised agricultural area (without kitchen gardens) and at least 98% of the total livestock units of the country.
Overview of the coverage, comparability possibilities and limitations for each group of countries, in 2020
Group A: Countries with core and module data on main frame plus frame extension
Countries: AT BG CY EL HR HU IT LV MT PL PT RO
Group B: Countries with core data on main frame and frame extension and module data on main frame
Countries: ES LT SI
Group C: Countries with core and module data on main frame
Countries: BE CH CZ DE DK EE FI FR IE IS LU NL NO SE SK
Comparability of the country’s data in the time series
+2020 core and module data are comparable in the time series, unless the country changed the coverage thresholds
+2020 core data are comparable in the time series, unless the country changed the coverage thresholds
- 2020 module data are not comparable in the time series
+2020 core and module data are comparable in the time series, unless the country changed the coverage thresholds
2.1. Change of survey coverage From 2007 onwards "maintaining land in good agricultural and environmental conditions" became an agricultural activity.
The change of legal requirements on data collection coverage (see item 3.6) led to changes of thresholds in some countries between 2007 and 2010 and between 2016 and 2020.
The graph below presents the impact of the change of survey coverage on the comparability of the national core data between 2016 and 2020. The information is provisional for Iceland.
Significant changes on survey coverage between 2013 and 2016:
Italy changed the thresholds for agricultural holdings between the 2013 and 2016 surveys. This change had a significant impact on number of holdings and labour force:
While the dataset shows that the number of holdings increased by 13.4% between 2013 and 2016, in reality, when comparing over the same coverage, the number of holdings increased by only 1.8% between the two years.
While apparently the labour force directly employed by the holdings increased by 5.2%, it actually increased by only 2.6% between 2013 and 2016.
Malta: The number of holdings in 2016 and 2013 is underestimated as in these two years the surveys did not include a part of holdings i.e. mainly those which in 2010 only maintained land in good agricultural and environmental conditions. The comparability over time is not affected for most indicators; exceptions are number of holdings, fallow land and kitchen gardens.
Netherlands: Between 2013 and 2016, the statistical office changed the registers used to identify the agricultural holdings. The change of registers has almost no effect on arable land, permanent crops and most livestock indicators. It has a high impact on sheep, equidae and "other land" and a limited impact on goats and cattle. The decrease of sheep is caused by the exclusion in 2016 of holdings which keep sheep mostly for nature preservation or for hobby farming and not sheep for meat or milk.
Between 2010 and 2013, an additional adjustment of thresholds took place in some countries (Belgium, France, Croatia, Italy, Luxembourg, Malta, Poland, Finland and Iceland).
2.2. Change of method or methodological problems on the collection of common land data
Common land has not been consistently covered by all countries before 2010, despite that it has been covered by legislation at least since 1988. Regulation (EC) No 1166/2008 made it clearer that the data on the UAA should cover common land in all countries. Therefore, since 2010, common land has been included in the surveys by countries in a more harmonised way.
Nonetheless, over the years, some countries changed the methodology of collection of information on common land or faced problems on the identification of common land units.
The following graph presents the impact of the change of common land methods on the comparability of the national data between 2016 and 2020. The information is provisional for Iceland.
Between 2013 and 2016, the methodology changed at the level of the EU: in 2016 the common land was newly recorded under the new tenancy type "common land". This triggered some fluctuations in the utilised agricultural area classified in the various classes of tenure. In addition:
Cyprus made a change in the methods used to collect data on common land in 2016 and as consequence revised the data for 2013.
Croatia also made a change in the methods, however mentioned that the decrease of common land between 2016 and 2013 is caused by the fact that a part of common land is purchased or rented out and is no longer common land.
Italy newly considered in 2016 the option of a municipality or institution managing its own land.
Poland newly collected in 2016 data on common land (from administrative sources) in the form of common land units. Common land was no longer added to the leased land but recorded separately. To avoid that farmers keep reporting common land under leased land, the training of interviewers as well as the methodological manual underlined that the area of the agricultural land does not contain common land. For more information, see the national methodological reports 2016.
2.3. Change of the definition of agricultural holding
The modifications undertaken by countries on the definition of agricultural holding were mostly minor and had only a negligible impact on the number of holdings.
Concerning the changes between 2016 and 2020, Regulation (EU) 2018/1091 newly considers agricultural holdings with only fur animals. However some countries do not raise fur animals. Some other countries, even if they raise fur animals, do not include agricultural holdings with only fur animals in their data collection because such agricultural holdings do not meet the thresholds. The reason is that the thresholds for animals are expressed in livestock units (LSU) and fur animals are not associated LSU coefficients. Also, such holdings do not contribute towards the minimum coverage of 98% of the total LSU of the country.
Concerning the changes between 2013 and 2016, Germany newly covered holdings with more than 1000 places for poultry, even if they have no agricultural activities (including no poultry breeding) in the reference period.
2.4. Change of the reference period Some countries changed the reference periods by still meeting the provisions of the regulations.
The folowing graph presents the impact of the change of reference periods for main variables on the comparability of the national data between 2016 and 2020. The information is provisional for Iceland.
Concerning the changes between 2013 and 2016:
In Belgium, the reference day for livestock variables changed from 15 May to 15 October, while the reference period for labour force variables changed from 1 May - 30 April to 1 October – 30 September.
In Bulgaria, the reference day for livestock variables changed from 1 November to 1 September, while the reference period for labour force variables changed from 1 October - 30 September to 1 September – 31 August.
In Spain, the rural development measures concern 2 years in FSS 2016 (instead of 3 years in FSS 2013). The new Common Agricultural Policy entered into force late and some countries did not have time to implement the system in 2014.
In Montenegro, the reference day for livestock variables changed from 31 May to 1 November, while the reference period for land and labour force variables changed from 1 June - 31 May to 1 November – 31 October.
In Portugal, the reference day for livestock variables is a fixed date (compared to 2013 when it was the day of the interview).
The article Farm structure survey - reference periods presents the changes between 2010 and 2013 in the countries where they occurred. The modifications undertaken by countries on the reference periods/days in 2013 compared to 2010 were mostly minor and most probably had only a negligible impact on the number of holdings. However, for specific variables such as pigs, the modification of the reference period/day, for example from 1 December 2010 to 31 December 2013 has some effect on data comparability over time.
2.5. Change in the list of characteristics See Annex List of Regulations and Decisions underlying the IFS/FSS in item 6.1 for the Regulations on the lists of characteristics in various survey years.
2.6. Change in concepts and classifications
IFS 2020 brings the following changes:
Legal personality of the agricultural holding In 2020, there is a new class (“shared ownership”) for the legal personality of the holding compared to 2016, which trigger fluctuations of holdings in the classes of sole holder holdings and group holdings.
Buffaloes In 2020, buffaloes are clearly included in the dairy cows while in 2016 they might be included or not in the dairy cows.
Other livestock n.e.c. In 2016, deer were included in this class, but in 2020 they are classified separately. Also in 2016, there was a class for the collection of equidae. That has been dropped and equidae are included in IFS in "other livestock n.e.c."
Livestock units In 2016, turkeys, ducks, geese, ostriches and other poultry fowls n.e.c. were considered each one in a separate class with a coefficient of 0.03 for all the classes except for ostriches (coefficient 0.035). In 2020, the coefficients were adjusted accordingly, with turkeys remaining at 0.03, ostriches remaining at 0.35, ducks adjusted to 0.01, geese adjusted to 0.02 and other poultry fowls n.e.c. adjusted to 0.001. See Glossary:Livestock unit (LSU) - Statistics Explained (europa.eu).
Organic animals While in FSS only fully compliant (certified converted) animals were included, in IFS 2020 both animals under conversion and fully converted are to be included.
Oil seeds of hemp In IFS, they are included under “Other oil seed crops” while in FSS 2016 they were included under “Hemp”.
From FSS 2009/2010 onwards, the classification of fruit and berry plantations changed from
- Fruit and berry plantations temperate climate
- Fruit and berry plantations subtropical climate
to
- Fruit species temperate climate
- Fruit species sub-tropical climate
- Berry species.
FSS 1999/2000 introduced a new concept of "group holdings" with an impact on the classification between family and non-family labour force.
2.7. Changes in the geographical breakdowns From 1999/2000 onwards, the data are displayed based on the NUTS classification. 2020 data use NUTS 2021 classification. 2016 data use NUTS 2013 classification. 2009/2010 and 2013 data use NUTS 2013 classification; 2007 and 2005 data use NUTS 2010 classification. 2007 data use 2006 NUTS classification.
Up to 1997, the geographical breakdowns of the countries are based on specific regions and districts.
15.2.1. Length of comparable time series
Not available.
15.3. Coherence - cross domain
Eurostat undertakes cross-check analyses of IFS/FSS statistics against animal and crop (ACS) production statistics. The main reasons for the differences between FSS/IFS and the other data collections are:
Different coverage Countries are using different coverage of agricultural holdings in the different data collections because the data collections have different aims. FSS/IFS is a structural data collection which is intended to gather information on the farm size and main land use as well as all the factors involved at farm level while the production surveys reflect multiple cropping areas and actual production during the reference year. So a main reason for the differences in the results is the different extent of coverage explained mostly by the different thresholds used by countries in different data collections. Full consistency between the data collections is not expected, but there is an aim to improve coherence between the figures of the agricultural statistical domains.
Different sources The main sources used are territorial surveys, administrative sources and a combination of them with diverse methods of grossing up. The use of administrative sources is an important factor of differences for pulses, fallow land and permanent crops. Better integration between administrative sources and surveys is sought.
Variability of the estimates produced from sample surveys Crops which have a very small cultivation area and higher sampling errors tend to show larger discrepancies. This happens particularly in the case of flowers and ornamental plants, other arable crops, some cereals and sunflowers. Industrial crops are also affected, for example, the area for tobacco, hemp, flax, aromatic plants, etc. Among animals, bovine over two years old (males and heifers) are affected.
Different concepts and definitions
Land use The IFS/FSS does not cover the whole territory but only land belonging to agricultural holdings. The total farm area covers utilised agricultural area (arable land, kitchen gardens, permanent grassland and permanent crops), area covered by mushrooms, unutilised agricultural area, wooded area and other land (occupied by buildings, farmyards, tracks, ponds, rock, etc).
Utilised agricultural area Some discrepancies in the utilised agricultural area are mainly due to the treatment of common land. See item 15.1 for the treatment of common land in IFS/FSS. The ownership/management of farms by public entities should be included under the scope of both IFS/FSS and crop production surveys to reduce discrepancies. On arable land,differences are detected also due to other minor reasons such as pulses/fodder classification, fallow land concept or other items that could be grouped in different ways. Arable crops and vegetables of the ACS use sown/harvested area which in most cases is bigger than the main area in the IFS/FSS. In crop production surveys, the figures for area refer to area under cultivation/ harvested area whereas in IFS/FSS the area shall be counted only once (main area). This means that in IFS/FSS, although the area is used more than once in a certain calendar year it is counted only for the main crop on that area. So, in case of combined or successive cropping the area is counted in a different way than in ACS. The main crop is the crop with the highest value of the production or - if that is not determining enough - which occupies the ground for the longest time. The overall variability between planted and harvested area is not well known, usually less than 20% for cereals in Europe, but depends on several factors such as the method of preparation, the time and manner of sowing, the kind of land on which the crop is grown, and the climatic conditions of the particular section. Also, the area sown or planted for the harvest of a given crop may change throughout the growing season. Issues such as use for purposes other than grain, abandonment, extreme weather damage, or unusual economic conditions might also create a problem for the areas recorded in the different data collections. Cultivated area in IFS/FSS for vegetables, melons and strawberries must be recorded only once even in the case of successive harvests whereas the area in crop production statistics is recorded as many times as it is cropped. This can be an important reason for different results especially for vegetables. As regards permanent crops, the difference between intensive and extensive fruit farms is explained by planting density, fertiliser application, irrigation for higher production per area, etc. The IFS/FSS data collection includes young fruit and berry plantations which are not yet in production, abandoned permanent crops with a possibility of reversibility and isolated trees. However, all these areas are excluded in the crop production survey and this is another source of the discrepancies in some countries. As regards organic farming, Eurostat collects data on organic farming from national Certification and Inspection bodies. This data collection can differ from the IFS/FSS data on organic farming due to the different statistical unit (for organic statistics the unit is the certified agricultural holding) and to the data collection methodology (organic farming data is taken from administrative registers). In order to increase coherence between IFS/FSS and ACS, the FSS and then the IFS Handbooks were redrafted to harmonise as much as possible with the definitions and notes of the ACS Handbook, what is more, the proposal for the list of variables for 2020 onwards has been further harmonised with the ACS crop lists.
Animals It is known that seasonal effects can appear for all species and in every production stage. Due to these effects the total number of heads and the production level recorded changes based on the different months of the year. The bovine animalsusually operate on a fairly stable cycle between the climatic seasons, unlike swine, sheep and goats. However, during the survey, farmers tend to supply late responses and to estimate the number of animals that they had at the time. Therefore, in relation to "2 years old heifers" and "other cows, bovine 2 years and older", several inconsistencies appear to be based on misclassification due to shortcomings on providing accurate replies regarding the age at disaggregated level. For pigs, seasonality factors such as heat stress can affect the litter size and thus the production flow in a later production phase. Understanding seasonal effects helps to follow up the changes in the number of heads and consequently a higher meat production level during some periods of the year. The enumeration of sheep and goatsis one of the most affected by seasonality. Usually the more lambs that can be born into a flock, the more profitable the operation is. This means mainly that maintaining ewes can be supported by the sale of many lambs. Obviously, this affects the inconsistencies on the total number of sheep and other sheep figures produced in summer and at the end of the year. Additionally, these variations are linked to the slaughtering and the big consumption of these species according to the market demand. The seasonally different figures show that sheep, goats and pigshad maximum slaughtering in December and January indicating high demand for meat in these months while they declined to the lowest levels in August and September.
15.3.1. Coherence - sub annual and annual statistics
Not applicable to Integrated Farm Statistics, because there are no sub annual data collections in agriculture.
15.3.2. Coherence - National Accounts
Not applicable, because Integrated Farm Statistics have no relevance for national accounts.
15.4. Coherence - internal
The data are internally consistent. This is ensured by the application of a wide range of validation rules and stable definitions of the variables/dimensions.
The results of the structure surveys of agricultural holdings are disseminated through statistical tables on Eurostat website. A wide range of tables are available crossing various dimensions and variables of time, area size, economic size, or geographical breakdowns. All the tables are derived from the same sets of individual data, which guarantees their coherence.
The following graph presents the share of countries that analysed the coherence at micro level for IFS 2020. The information for Iceland is provisional.
Some coordination exists between surveys in some countries to avoid that farms need to answer multiple questionnaires with the same kind of questions.
The data at farm level are validated by countries and Eurostat using strict rules. The aggregated data are checked and validated as well.
The 2013, 2016 and 2020 data were disseminated as preliminary and then as final. Data may be published even if they are missing for certain data providers or flagged as provisional or of low reliability for certain data providers. They are replaced with final data once transmitted and validated; European aggregates are updated for consistency with new country data.
All reported errors (once validated) result in corrections of the disseminated data.
The data may be subject to subsequent revisions. Whenever new data are provided and validated, the already disseminated data are updated.
Currently, the impact of major revisions is not analysed and the time series breaks caused by major revisions are not flagged. Major revisions are documented and are communicated through the explanatory notes.
Regional data
In ef_main tables, the 2007 data were revised to set the NUTS classification from NUTS 2006 version to NUTS 2010 version.
17.2.1. Data revision - average size
Not available.
18.1. Source data
Countries collect data through two kinds of statistical coverage:
an agricultural census (AC) every 10 years,
several sample-based data collections between them.
However, for certain variables, the countries may use samples for every year.
The sampling rate depends on country and year. It varies between 2.5% and 100% of the total population of agricultural holdings. In a few countries, every year is a census, see the data collections between 1999/2000 and 2016 in the Glossary: Farm structure survey.
Countries complement the data from surveys with data from administrative sources. The use of administrative sources is for the first time enshrined in Regulation (EC) No 1166/2008. According to Article 4 of Regulation (EC) No 1166/2008, provided that the information from the administrative source is of at least equal quality to information obtained from statistical surveys, countries are allowed to use information from:
administrative sources associated with the cultivation of genetically modified crops and the specific rural development measures referred to in Annex III of the Regulation (EC) No 1166/2008.
the Integrated Administration and Control System (IACS),
the System for the Identification and Registration of Bovine Animals,
the System for the Identification and Registration of Ovine and Caprine Animals,
the Vineyard register,
Organic Farming registers,
administrative sources associated with specific rural development measures and allows the use of other sources, methods and innovative approaches (e.g. modelling to estimate specific variables).
Moreover, in case countries decide to use other administrative sources than those specified above, or decide to use innovative approaches and methods, they can do so on condition that the Commission will be informed in advance and will be provided with a description of the used sources/methods and of the quality of the data.
The following graph presents the frequency with which countries update their national frames before the data collections, for IFS 2020. The information is provisional for Iceland.
For 2013, the article Farm structure survey - administrative sources provides a description of the administrative sources used, of their purpose and quality, and of the difficulties and measures taken to overcome them.
18.2. Frequency of data collection
The agricultural census is conducted every 10 years. The decennial agricultural census is complemented by sample or census-based data collections organised every 3-4 years in-between.
18.3. Data collection
The methods used to collect the data vary in countries depending on national practices.
The following graph presents the methods of data collection used by countries, for IFS 2020. The information for Iceland is provisional.
18.4. Data validation
Data at Eurostat are checked by successive steps on:
the structure of the data set;
the internal relationship between fields (validation rules);
the raw aggregated results;
the cross-check with other agricultural statistics;
the cross-check with FSS data from previous years;
the applicability of precision requirements and whether precision requirements are met for the applicable cases;
the data analysis (outliers, distributions, weights etc.);
the review and validation of the quality reports/national methodological reports.
For the complete overview of the validation workflow in FSS 2016 and IFS 2020, see annexes Validation workflow FSS 2016 and Validation workflow IFS 2020.
Only data and metadata having been entirely validated can be disseminated. Afterwards some errors may be detected during a specific analysis and the dataset revised.
The following graphs present the type of validation checks in countries, for IFS 2020. The information for Iceland is provisional.
The aggregation can be simple summing up, but in case of sample surveys, the extrapolation factors provided by the countries for each holding are taken into account.
Some countries collected some variables (e.g. crop, livestock) from all holdings (census) while some other variables (e.g. labour force) from sample of holdings. In this case, the data from a table covering only crop and livestock variables will be slightly different from the same data from another table combining crop and livestock variables with labour force variables. For example, the total number of holdings from the first table will be slightly different from the total number of holdings from the second table. This is because in the second table, the number of holdings is an estimate based on a sample. In the first table, the number of holdings is more precise because it is based on census. The data discrepancies of the same total between the two tables increase the higher the level of detail of the data.
A few countries apply calibration (based on administrative sources) to improve the coverage and the data quality. For FSS 2013, see article Farm structure survey - administrative sources.
See also 18.5. Data compilation.
18.6.1. Seasonal adjustment
Not applicable to Integrated Farm Statistics, because it collects structural data on agriculture.
List of abbreviations
CAP – Common Agricultural Policy
CAPI – Computer Assisted Personal Interview
CATI – Computer Assisted Telephone Interview
CAWI – Computer Assisted Web Interview
FSS – Farm Structure Survey
IACS – Integrated Administration and Control System
IFS – Integrated Farm Statistics
LSU – Livestock units
NACE – Nomenclature of Economic Activities
NUTS – Nomenclature of territorial units for statistics
The data describe the structure of agricultural holdings providing the general characteristics of farms and farmers and information on their land, livestock and labour force. They also describe production methods, rural development measures and agro-environmental aspects that look at the impact of agriculture on the environment.
The data are used by public, researchers, farmers and policy-makers to better understand the state of the farming sector and the impact of agriculture on the environment. The data follow up the changes in the agricultural sector and provide a basis for decision-making in the Common Agricultural Policy (CAP) and other European Union policies.
The statistical unit is the agricultural holding (farm). The aggregated results are disseminated through statistical tables. The data are presented at different geographical levels and over periods.
The data collections are organised in line with the EU legislation. For 2020 (the agricultural census), 2023 and 2026, they are organised in line with the Regulation (EU) 2018/1091 and have a new structure, consisting of a core data set and several modules. The data are as comparable and coherent as possible across European countries.
27 February 2024
Both the censuses and the sample surveys are aimed at producing a variety of information on specific CAP targets, as well as providing a basis for extrapolating Farm Accountancy Data Network (FADN) data.
A set of characteristics and definitions are set in legislation, please consult List of Regulations and Decisions underlying the farm structure surveys in the annex of the item 6.1. Some exceptions are nevertheless recorded. For 1990-2005, see annex Exceptions and explanations on the characteristics of FSS surveys 1990-2005. Since 2007, see the national methodological reports.
Information regarding the following groups of characteristics is available:
Land area and its utilisation: size and distribution of the land area of the holding, in particular utilised agricultural area (UAA) which comprises arable land, permanent grassland, permanent crops and kitchen gardens.
Livestock: animals kept on the holding (cattle, sheep, goats, pigs, poultry, equidae and other animals expressed in heads or in livestock units (LSU) where 1 LSU is the grazing equivalent of one adult dairy cow).
Machinery and equipments necessary to cultivate the land or manage the holding activity.
Secondary activities (activities directly related to the holding using the resources and/or products of the holding) and agro-environmental aspects.
For 2020, the list of core variables is set in Annex III of Regulation (EU) 2018/1091.The descriptions of the core variables as well as the lists and descriptions of the variables for the modules collected in 2019/2020 are set in Commission Implementing Regulation (EU) 2018/1874. The following groups of variables are collected:
for core: location of the holding, legal personality of the holding, manager, type of tenure of the utilised agricultural area, variables of land, organic farming, irrigation on cultivated outdoor area, variables of livestock, organic production methods applied to animal production;
for the module "Labour force and other gainful activities": farm management, family labour force, non-family labour force, other gainful activities directly and not directly related to the agricultural holding;
for the module "Rural development": support received by agricultural holdings through various rural development measures;
for the module "Animal housing and rural development module":animal housing, nutrient use and manure on the farm, manure application techniques, facilities for manure.
A complete glossary of agricultural statistics is available for users.
The statistical population consists of agricultural holdings which meet the minimum requirements set up in the IFS/FSS legislative framework.
For 2020, the data cover in each country the agricultural holdings and common land agricultural units that meet at least one of the physical thresholds set in Annex II of Regulation (EU) 2018/1091 with regard to the size of agricultural land or the number of livestock units.
Where those thresholds did cover at least 98 % of the total national UAA (excluding kitchen gardens) and 98 % of the total national livestock units (LSU), countries extended the frame by establishing lower and/or additional thresholds. The countries in this situation answered "Yes" to the national quality report item 3.6.1.2. However these countries had to collect only the core and not also the module data on the frame extension, so the module data do not necessarily ensure the 98 % minimum UAA and LSU requirements in those countries.
By way of exception, where those thresholds cover more than 98 % of the national agricultural production (measured by the Standard Output), those countries established higher physical or corresponding economic thresholds, still complying with the 98% minimum UAA and LSU requirements. These countries answered "Yes" to the national quality report item 3.6.1.1.
The attached file presents the thresholds used by the EU countries and Norway to cover core data in IFS 2020.
The following graph illustrates the thresholds used by the EU countries, Norway and Iceland to cover core data, for IFS 2020. The information is provisional for Iceland.
From 2010 until 2016, following the entry into force of Regulation (EC) No 1166/2008, all countries included all holdings above at least one threshold of a set of thresholds. For the set of thresholds (set by legislation), as well as for the specific thresholds applied by countries between 2007 and 2013, see Farm structure survey - survey coverage. Countries which used a survey threshold above one hectare UAA were allowed to fix this threshold at a level that excludes only the smallest agricultural holdings which together contribute 2 % or less to the total UAA excluding common land and 2 % or less to the total number of farm livestock units (LSU).
Until the FSS 2007, in accordance with Regulation (EEC) No 571/88, the countries which applied a threshold of above one hectare of utilised agricultural area (UAA) committed themselves to fix this threshold at a level excluding only the smallest holdings, which together contributed 1 % or less to the total standard gross margin (SGM).
The 2020 agricultural census covers the European Union, Iceland, Norway, Switzerland. For earlier years, data from candidate countries and potential candidates are also received.
See for which country and year the data are available on Eurostat website, in the FSS glossary article.
FSS data are available for the following years: 1989/1990, 1993, 1995, 1997, 1999/2000, 2003, 2005, 2007, 2009/2010, 2013 and 2016. The agricultural censuses are in line with the FAO recommendations and are carried out every 10 years. The intermediate surveys are organised 3 (until 2007) or 2 times (since 2010) between the censuses. The exact reference periods are determined in legislation.
For 2020, 2023 and 2026, the reference periods are provided in Article 10 of Regulation (EU) 1091/2018. Article 19 of the same Regulation provides derogations for Greece and Portugal, where the references to the year 2020 shall be replaced by references to the year 2019, if necessary. In practice, only Portugal used this derogation. For 2020, 2023 and 2026, the reference periods are:
Reference period for land variables The use of land refers to the reference year 2019/2020. In the case of successive crops from the same piece of land, the land use refers to a crop that is harvested during the reference year, regardless of when the crop in question is sown.
Reference period for variables on irrigation and soil management practices The 12-month period ending on a day within the reference year 2019/2020. That day varies across countries.
Reference day for variables on livestock and animal housing A reference day within the reference year 2019/2020. That day varies across countries.
Reference period for variables on manure management A period of 12-month that includes the reference day used for livestock and animal housing. That period varies across countries.
Reference period for variables on labour force The 12-month period ending on a day within the reference year 2019/2020. That period varies across countries.
Reference period for variables on rural development measures The three-year period ending on 31 December 2019/2020.
Reference day for all other variables A reference day within the reference year 2019/2020. That day varies across countries.
The following tables present for 2020 the reference days/periods used by EU countries, Iceland and Norway for specific groups of variables. The information for Iceland is provisional.
For 2010, 2013 and 2016, the reference periods are provided in Article 8 of the Regulation (EC) No 1166/2008. Article 16 of the same Regulation provides derogations for Greece, Spain and Portugal, where the references to the year 2010 are replaced by references to the year 2009. For more information on the comparability of reference periods in 2013 across countries and between 2013 and 2010 by country, see Farm structure survey - reference periods.
The surveys 1990 and 2000 covered a period between 1 December 1988 and 1 March 1991, respectively 1 December 1998 and 1 March 2001, thus the actual survey varied from country to country. See for which country and year the data is available on Eurostat website in the FSS glossary article.
Regulation (EC) No 2018/1091 and Regulation (EC) No 1166/2008 require the estimates to be representative at the level of NUTS2 regions and by farm type and by size of agricultural holdings. This means that the estimates should be reliable and can be disseminated without quality concerns at NUTS2 regions. This does however not hold for lower geographical levels, e.g. NUTS 3, unless for countries which stratify by NUTS 3. The sample surveys are usually stratified at NUTS 2 level.
The results of sample surveys are extrapolated with one (sometimes two) weighting factor(s) for a wide range of characteristics. Therefore the accuracy of estimates is affected by sampling errors. In addition, accuracy is also affected by non-sampling errors which cause both variability and bias in the estimates.
Two kinds of units are generally used:
the units of measurement for the variables (area in hectares, livestock in (1000) heads or LSU (livestock units), labour force in persons or AWU (annual working units), standard output in Euro, places for animal housing etc.) and
the number of agricultural holdings having these characteristics.
The aggregation can be simple summing up, but in case of sample surveys, the extrapolation factors provided by the countries for each holding are taken into account.
Some countries collected some variables (e.g. crop, livestock) from all holdings (census) while some other variables (e.g. labour force) from sample of holdings. In this case, the data from a table covering only crop and livestock variables will be slightly different from the same data from another table combining crop and livestock variables with labour force variables. For example, the total number of holdings from the first table will be slightly different from the total number of holdings from the second table. This is because in the second table, the number of holdings is an estimate based on a sample. In the first table, the number of holdings is more precise because it is based on census. The data discrepancies of the same total between the two tables increase the higher the level of detail of the data.
Countries collect data through two kinds of statistical coverage:
an agricultural census (AC) every 10 years,
several sample-based data collections between them.
However, for certain variables, the countries may use samples for every year.
The sampling rate depends on country and year. It varies between 2.5% and 100% of the total population of agricultural holdings. In a few countries, every year is a census, see the data collections between 1999/2000 and 2016 in the Glossary: Farm structure survey.
Countries complement the data from surveys with data from administrative sources. The use of administrative sources is for the first time enshrined in Regulation (EC) No 1166/2008. According to Article 4 of Regulation (EC) No 1166/2008, provided that the information from the administrative source is of at least equal quality to information obtained from statistical surveys, countries are allowed to use information from:
administrative sources associated with the cultivation of genetically modified crops and the specific rural development measures referred to in Annex III of the Regulation (EC) No 1166/2008.
the Integrated Administration and Control System (IACS),
the System for the Identification and Registration of Bovine Animals,
the System for the Identification and Registration of Ovine and Caprine Animals,
the Vineyard register,
Organic Farming registers,
administrative sources associated with specific rural development measures and allows the use of other sources, methods and innovative approaches (e.g. modelling to estimate specific variables).
Moreover, in case countries decide to use other administrative sources than those specified above, or decide to use innovative approaches and methods, they can do so on condition that the Commission will be informed in advance and will be provided with a description of the used sources/methods and of the quality of the data.
The following graph presents the frequency with which countries update their national frames before the data collections, for IFS 2020. The information is provisional for Iceland.
For 2013, the article Farm structure survey - administrative sources provides a description of the administrative sources used, of their purpose and quality, and of the difficulties and measures taken to overcome them.
Results are disseminated 2 years after the reference year.
The deadlines for the transmission of FSS data are set by legislation.
For IFS 2020, Member States shall transmit validated core and module data and a quality report to the Commission (Eurostat) within 15 months after the end of the reference year.
For the FSS 2013 and 2016, Member States transmitted validated survey data to the Commission within 12 months of the end of the survey year. Data relating to the rural development measures could be transmitted to the Commission separately within 18 months of the end of the survey year.
Results are disseminated following validation, confidentiality treatment and tabulation, 2 years after the reference year.
Comparability across countries is considered high. Harmonisation of concepts and methods is ensured by a number of Commission Regulations and Decisions providing detailed information on list of variables/characteristics, on rules and procedures that should be followed and on time-frame within which FSS/IFS should be conducted. The same data are available for all countries. Besides, the censuses carried out every 10 years are in line with the FAO recommendations enhancing this way the comparability with countries outside Europe including USA and Japan.
Comparability problems between European countries concern:
1. Survey coverage
Each country is allowed, in line with the legislation, to set up thresholds at a level that excludes very small holdings, as long as the conditions for minimum coverage are guaranteed. Consequently, all countries have set up a system of country-specific alternative thresholds, which ensure that the requested minimum coverage is respected. For IFS 2020, the data on core and module variables cover all holdings above the thresholds set in the Regulation (EU) 2018/1091, with the exception of some countries that raised the thresholds. The data on core variables cover at least 98% of the utilised agricultural area (without kitchen gardens) and at least 98% of the livestock units in each country. However the data on module variables do not have this minimum coverage in all countries.
Overview of the coverage, comparability possibilities and limitations for each group of countries, in 2020
Group A: Countries with core and module data on main frame plus frame extension
Countries: AT BG CY EL HR HU IT LV MT PL PT RO
Group B: Countries with core data on main frame and frame extension and module data only on main frame
Countries: ES LT SI
Group C: Countries with core and module data only on main frame
Countries: BE CH CZ DE DK EE FI FR IE IS LU NL NO SE SK
Coverage
Both core and module data cover the agricultural holdings accounting for at least 98% of the total utilised agricultural area (without kitchen gardens) and at least 98% of the total livestock units of the country.
The core data cover the agricultural holdings accounting for at least 98% of the total utilised agricultural area (without kitchen gardens) and at least 98% of the total livestock units of the country.
While the module data do not meet these coverage requirements, the data coverage still complies with the minimum requirements of Regulation (EU) 2018/1091, which requires for modules only data on main frame.
Both core and module data cover the agricultural holdings accounting for at least 98% of the total utilised agricultural area (without kitchen gardens) and at least 98% of the total livestock units of the country
Comparability of data between countries
+ 2020 core and module data are comparable with the core and module data of the other countries from Groups A and C
+ 2020 core data are comparable with the core data of the countries from Group B
- 2020 module data are not comparable with the module data of the countries from Group B
+ 2020 core and module data are comparable with the core and module data of the other countries from Group B
+ 2020 core data are comparable with the core data of the countries from Groups A and C
- 2020 module data are not comparable with the module data of the countries from Group A and C
+ 2020 core and module data are comparable with the core and module data of the other countries from Groups A and C
+ 2020 core data are comparable with the core data of the countries from Group B
- 2020 module data are not comparable with the module data of the countries from Group B
Comparability between core and module data within the same country
+ within the country, the totals of core variables are computed on the same population scope as the totals of module variables, therefore, the totals of core and module variables can be interpreted in relation
- within the country, the totals of core variables are computed on a larger population scope than the totals of module variables, therefore, the totals of core and module variables cannot be interpreted in relation
+ within the country, the totals of core variables are computed on the same population scope as the totals of module variables, therefore, the totals of core and module variables can be interpreted in relation
For 2020, according to Regulation (EU) 2018/1091, the countries transmit the cell code of the 1 Km2 INSPIRE statistical units grid for pan-European usage.
For 2009/2010 and 2013, the methodology for geo-referencing the agricultural holdings is based on the geographical coordinates. Regulation (EC) No 1166/2008 defines the "location of the holding" as the latitude and longitude coordinates within an arc of 5 minutes that avoid the direct identification of an individual holding. If a latitude and longitude location contains only one agricultural holding, then this holding shall be attributed to a neighbouring location, which contains at least one other agricultural holding. In each country the geographical coordinates were attributed to each holding using distinct methodologies.
3. Common land
The way common land has been included in the data collections has an impact on the comparability of number of holdings, average size of holdings and livestock densities across countries and by dimensions within each country. In countries where all common land can be clearly rented by or allotted to an agricultural holding (based on written or oral agreements), it is not considered any more common land in statistics, but land normally used by the agricultural holding. In countries where common land is neither rented by, nor allotted to the agricultural holding, this land is actual common land in statistics and 3 different options (or some combination of these) to record common land areas have been used. For the presentation of the methods and options used by countries and the comparability problems for the period until 2013, see article Farm structure survey - common land. For 2016 and 2020, see the national quality/methodological reports.
The following graphs present the share of countries that collect common land data, and their used sources, for IFS 2020. The information for Iceland is provisional.
The following graph presents the countries that collect common land data, for IFS 2020. The information is provisional for Iceland.
The following table presents the methods used by countries to record data on common land, for IFS 2020. The information is provisional for Iceland.
National methods used to record common land data
IFS 2020
AT
Common land is included in the land of agricultural holdings renting or being allotted the land based on written or oral agreements.
BG
Common land is included in the land of agricultural holdings based on a statistical model.
CY
Common land is included in the land of agricultural holdings based on a statistical model.
DE
Common land is included in separate records representing virtual entities without managers.
EL
Common land is included in separate records representing virtual entities without managers.
ES
Common land is included in the land of agricultural holdings renting or being allotted the land based on written or oral agreements. Common land is included in the land of agricultural holdings based on a statistical model.
FR
Common land is included in the land of agricultural holdings based on a statistical model.
HR
Common land is included in the land of agricultural holdings renting or being allotted the land based on written or oral agreements. Common land is included in separate records representing virtual entities without managers.
HU
Common land is included in the land of agricultural holdings renting or being allotted the land based on written or oral agreements.
IE
Common land is included in separate records representing virtual entities without managers.
IT
Common land is included in separate records representing virtual entities without managers.
PL
Common land is included in separate records representing virtual entities without managers.
PT
Common land is included in the land of entities meeting the definition of agricultural holdings, having own managers.
RO
Common land is included in the land of agricultural holdings renting or being allotted the land based on written or oral agreements. Common land is included in the land of entities meeting the definition of agricultural holdings, having own managers.
SI
Common land is included in the land of agricultural holdings based on a statistical model.
IS
Common land is included in the land of entities meeting the definition of agricultural holdings, having own managers.
4. Annual working unit (AWU)
The AWU (the number of working hours and days in a year for a full-time job) varies across countries. Annual working units are used to calculate the farm work on the agricultural holdings. For the analysis of comparability of AWU across countries in FSS 2013, see article Farm structure survey - measurement errors. For 2016 and 2020, see the national quality/methodological reports.
5. Other gainful activities not related to holdings
For IFS 2020, Eurostat required countries to collect other gainful activities not related to holdings only for sole holder holdings where the holder is single manager. However some countries collect and transmit the data to Eurostat additionally on sole holders where holder is co-manager with their spouse or family member.
6. Animal housing and manure management (AHMM)
For IFS 2020, Eurostat required countries to collect the variables on AHMM only for holdings with at least one of the following: bovine animals, pigs, sheep, goats, poultry. However some countries collect and transmit the data to Eurostat additionally for holdings without animals because an important part of nutrients are used in holdings without livestock.
7. Irrigation
The area of crops which have actually been irrigated at least once during the 12 months prior to the reference day of the survey do not include crops under glass or other (accessible) protective cover and kitchen gardens which are almost always irrigated. If more than one crop is grown in a field during the harvest year, the area should only be indicated once: for the main crop, if irrigation was used for it, or otherwise for the most important irrigated secondary or successive crop. For 2010 and 2020, the volume of water that has been used for irrigation on the holding during the 12 months prior to the reference date of the survey, regardless of the source, is provided using data estimation, imputation, or modelling methods. This might affect comparability across countries.
See in addition the annex Exceptions and explanations on the characteristics of FSS surveys 1990 - 2005 in item 3.4.
The time series analysis in agricultural domain is mostly oriented to economic and social aspects of the agriculture such as the evolution of the labour force, the level of investment on the farms regarding environmental issues and the most relevant type of tenancy on the agricultural sector.
1. Real changes in the evolution of agricultural holdings
There is a decreasing trend in the number of agricultural holdings that appears in general over all European countries. Among the most important reasons to explain the changes over time are the abandonment of the agricultural activity, the lack of profitability of some crops and the increase of energy crops, based on the demand and subsidies. A time series analysis over a three year period helps to understand the impact of the agricultural policy on the agricultural practices i.e. the discontinuation of subsidies can lead to a quick and drastic decrease in the area used for the cultivation of a specific crop.
2. Methodological reasons affecting comparability over time
The length of the farm structure time series is variable between the countries. In some countries, the online time series go back to 1990, while other countries started only in 2013. The core data are comparable in the time series mostly as long as the country did not change the coverage thresholds between years. The module data are comparable in the time series mostly as long as the country did not change the coverage thresholds between years and as long as the 2020 module data cover the agricultural holdings accounting for at least 98% of the total utilised agricultural area (without kitchen gardens) and at least 98% of the total livestock units of the country.
Overview of the coverage, comparability possibilities and limitations for each group of countries, in 2020
Group A: Countries with core and module data on main frame plus frame extension
Countries: AT BG CY EL HR HU IT LV MT PL PT RO
Group B: Countries with core data on main frame and frame extension and module data on main frame
Countries: ES LT SI
Group C: Countries with core and module data on main frame
Countries: BE CH CZ DE DK EE FI FR IE IS LU NL NO SE SK
Comparability of the country’s data in the time series
+2020 core and module data are comparable in the time series, unless the country changed the coverage thresholds
+2020 core data are comparable in the time series, unless the country changed the coverage thresholds
- 2020 module data are not comparable in the time series
+2020 core and module data are comparable in the time series, unless the country changed the coverage thresholds
2.1. Change of survey coverage From 2007 onwards "maintaining land in good agricultural and environmental conditions" became an agricultural activity.
The change of legal requirements on data collection coverage (see item 3.6) led to changes of thresholds in some countries between 2007 and 2010 and between 2016 and 2020.
The graph below presents the impact of the change of survey coverage on the comparability of the national core data between 2016 and 2020. The information is provisional for Iceland.
Significant changes on survey coverage between 2013 and 2016:
Italy changed the thresholds for agricultural holdings between the 2013 and 2016 surveys. This change had a significant impact on number of holdings and labour force:
While the dataset shows that the number of holdings increased by 13.4% between 2013 and 2016, in reality, when comparing over the same coverage, the number of holdings increased by only 1.8% between the two years.
While apparently the labour force directly employed by the holdings increased by 5.2%, it actually increased by only 2.6% between 2013 and 2016.
Malta: The number of holdings in 2016 and 2013 is underestimated as in these two years the surveys did not include a part of holdings i.e. mainly those which in 2010 only maintained land in good agricultural and environmental conditions. The comparability over time is not affected for most indicators; exceptions are number of holdings, fallow land and kitchen gardens.
Netherlands: Between 2013 and 2016, the statistical office changed the registers used to identify the agricultural holdings. The change of registers has almost no effect on arable land, permanent crops and most livestock indicators. It has a high impact on sheep, equidae and "other land" and a limited impact on goats and cattle. The decrease of sheep is caused by the exclusion in 2016 of holdings which keep sheep mostly for nature preservation or for hobby farming and not sheep for meat or milk.
Between 2010 and 2013, an additional adjustment of thresholds took place in some countries (Belgium, France, Croatia, Italy, Luxembourg, Malta, Poland, Finland and Iceland).
2.2. Change of method or methodological problems on the collection of common land data
Common land has not been consistently covered by all countries before 2010, despite that it has been covered by legislation at least since 1988. Regulation (EC) No 1166/2008 made it clearer that the data on the UAA should cover common land in all countries. Therefore, since 2010, common land has been included in the surveys by countries in a more harmonised way.
Nonetheless, over the years, some countries changed the methodology of collection of information on common land or faced problems on the identification of common land units.
The following graph presents the impact of the change of common land methods on the comparability of the national data between 2016 and 2020. The information is provisional for Iceland.
Between 2013 and 2016, the methodology changed at the level of the EU: in 2016 the common land was newly recorded under the new tenancy type "common land". This triggered some fluctuations in the utilised agricultural area classified in the various classes of tenure. In addition:
Cyprus made a change in the methods used to collect data on common land in 2016 and as consequence revised the data for 2013.
Croatia also made a change in the methods, however mentioned that the decrease of common land between 2016 and 2013 is caused by the fact that a part of common land is purchased or rented out and is no longer common land.
Italy newly considered in 2016 the option of a municipality or institution managing its own land.
Poland newly collected in 2016 data on common land (from administrative sources) in the form of common land units. Common land was no longer added to the leased land but recorded separately. To avoid that farmers keep reporting common land under leased land, the training of interviewers as well as the methodological manual underlined that the area of the agricultural land does not contain common land. For more information, see the national methodological reports 2016.
2.3. Change of the definition of agricultural holding
The modifications undertaken by countries on the definition of agricultural holding were mostly minor and had only a negligible impact on the number of holdings.
Concerning the changes between 2016 and 2020, Regulation (EU) 2018/1091 newly considers agricultural holdings with only fur animals. However some countries do not raise fur animals. Some other countries, even if they raise fur animals, do not include agricultural holdings with only fur animals in their data collection because such agricultural holdings do not meet the thresholds. The reason is that the thresholds for animals are expressed in livestock units (LSU) and fur animals are not associated LSU coefficients. Also, such holdings do not contribute towards the minimum coverage of 98% of the total LSU of the country.
Concerning the changes between 2013 and 2016, Germany newly covered holdings with more than 1000 places for poultry, even if they have no agricultural activities (including no poultry breeding) in the reference period.
2.4. Change of the reference period Some countries changed the reference periods by still meeting the provisions of the regulations.
The folowing graph presents the impact of the change of reference periods for main variables on the comparability of the national data between 2016 and 2020. The information is provisional for Iceland.
Concerning the changes between 2013 and 2016:
In Belgium, the reference day for livestock variables changed from 15 May to 15 October, while the reference period for labour force variables changed from 1 May - 30 April to 1 October – 30 September.
In Bulgaria, the reference day for livestock variables changed from 1 November to 1 September, while the reference period for labour force variables changed from 1 October - 30 September to 1 September – 31 August.
In Spain, the rural development measures concern 2 years in FSS 2016 (instead of 3 years in FSS 2013). The new Common Agricultural Policy entered into force late and some countries did not have time to implement the system in 2014.
In Montenegro, the reference day for livestock variables changed from 31 May to 1 November, while the reference period for land and labour force variables changed from 1 June - 31 May to 1 November – 31 October.
In Portugal, the reference day for livestock variables is a fixed date (compared to 2013 when it was the day of the interview).
The article Farm structure survey - reference periods presents the changes between 2010 and 2013 in the countries where they occurred. The modifications undertaken by countries on the reference periods/days in 2013 compared to 2010 were mostly minor and most probably had only a negligible impact on the number of holdings. However, for specific variables such as pigs, the modification of the reference period/day, for example from 1 December 2010 to 31 December 2013 has some effect on data comparability over time.
2.5. Change in the list of characteristics See Annex List of Regulations and Decisions underlying the IFS/FSS in item 6.1 for the Regulations on the lists of characteristics in various survey years.
2.6. Change in concepts and classifications
IFS 2020 brings the following changes:
Legal personality of the agricultural holding In 2020, there is a new class (“shared ownership”) for the legal personality of the holding compared to 2016, which trigger fluctuations of holdings in the classes of sole holder holdings and group holdings.
Buffaloes In 2020, buffaloes are clearly included in the dairy cows while in 2016 they might be included or not in the dairy cows.
Other livestock n.e.c. In 2016, deer were included in this class, but in 2020 they are classified separately. Also in 2016, there was a class for the collection of equidae. That has been dropped and equidae are included in IFS in "other livestock n.e.c."
Livestock units In 2016, turkeys, ducks, geese, ostriches and other poultry fowls n.e.c. were considered each one in a separate class with a coefficient of 0.03 for all the classes except for ostriches (coefficient 0.035). In 2020, the coefficients were adjusted accordingly, with turkeys remaining at 0.03, ostriches remaining at 0.35, ducks adjusted to 0.01, geese adjusted to 0.02 and other poultry fowls n.e.c. adjusted to 0.001. See Glossary:Livestock unit (LSU) - Statistics Explained (europa.eu).
Organic animals While in FSS only fully compliant (certified converted) animals were included, in IFS 2020 both animals under conversion and fully converted are to be included.
Oil seeds of hemp In IFS, they are included under “Other oil seed crops” while in FSS 2016 they were included under “Hemp”.
From FSS 2009/2010 onwards, the classification of fruit and berry plantations changed from
- Fruit and berry plantations temperate climate
- Fruit and berry plantations subtropical climate
to
- Fruit species temperate climate
- Fruit species sub-tropical climate
- Berry species.
FSS 1999/2000 introduced a new concept of "group holdings" with an impact on the classification between family and non-family labour force.
2.7. Changes in the geographical breakdowns From 1999/2000 onwards, the data are displayed based on the NUTS classification. 2020 data use NUTS 2021 classification. 2016 data use NUTS 2013 classification. 2009/2010 and 2013 data use NUTS 2013 classification; 2007 and 2005 data use NUTS 2010 classification. 2007 data use 2006 NUTS classification.
Up to 1997, the geographical breakdowns of the countries are based on specific regions and districts.


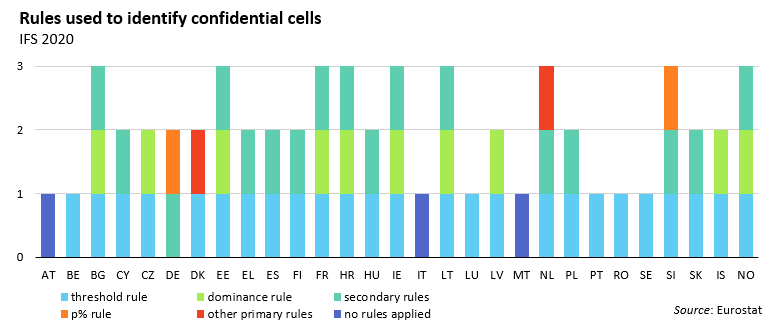
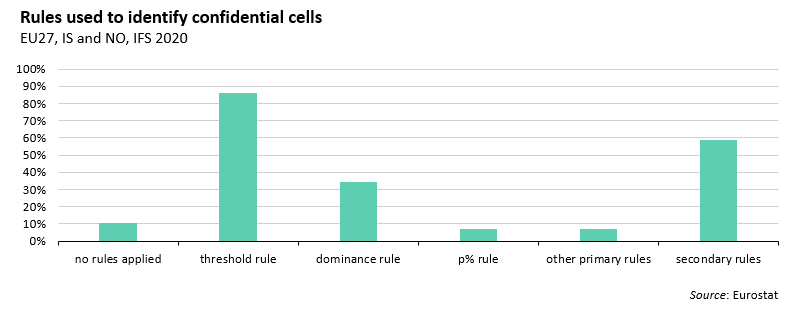


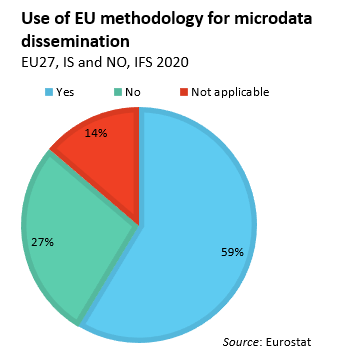
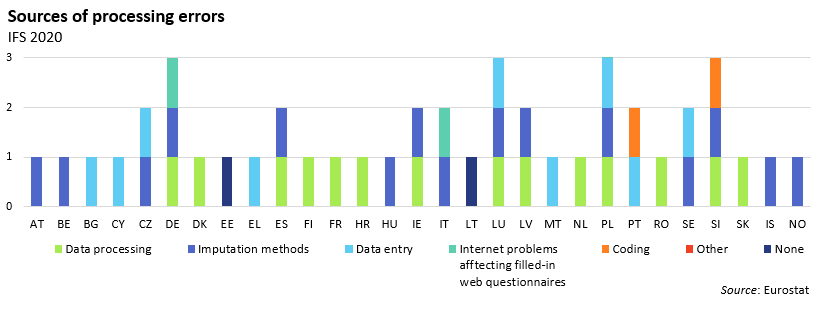

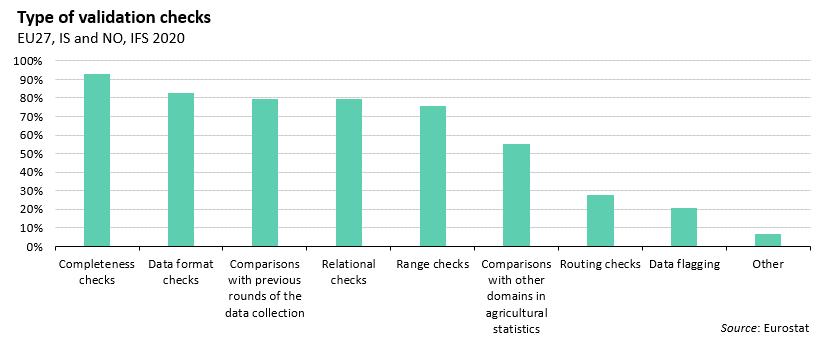

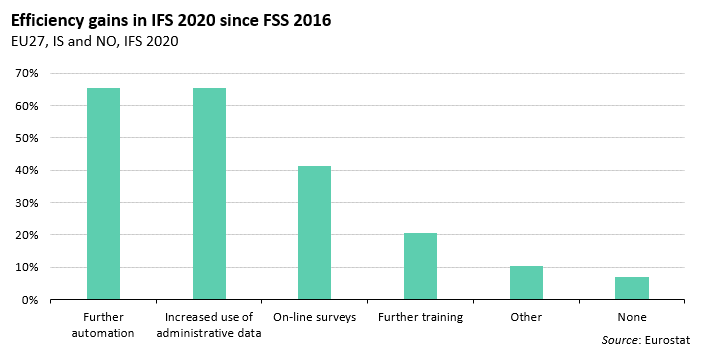
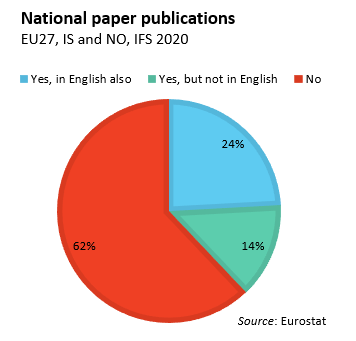
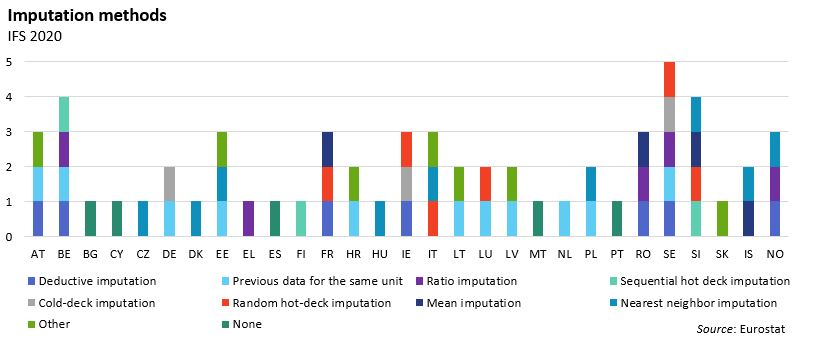
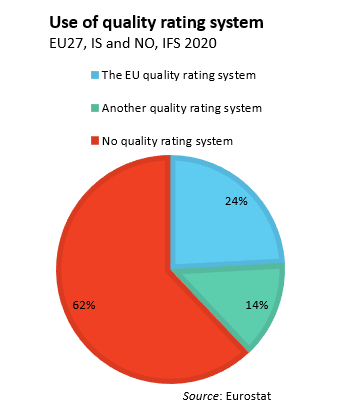

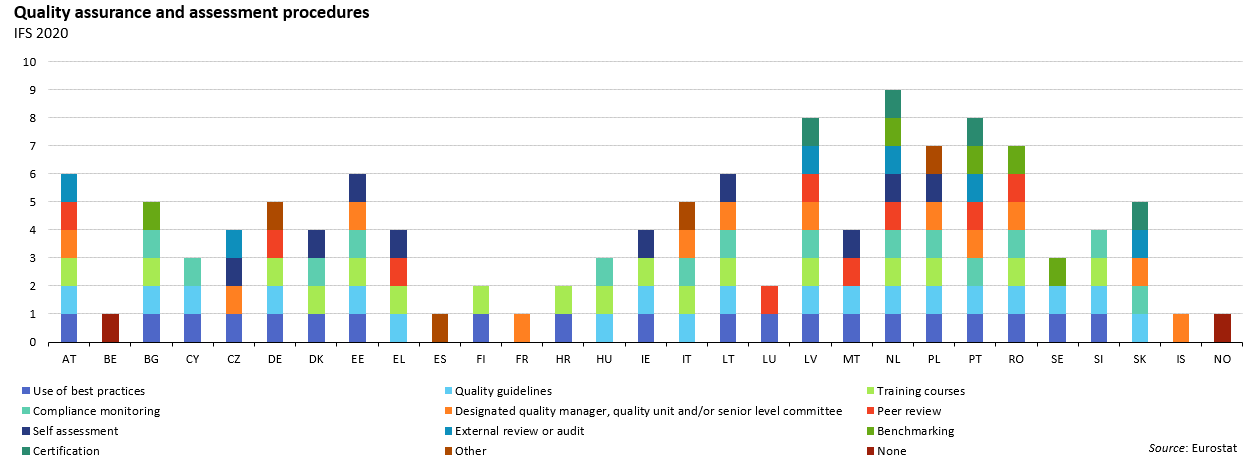

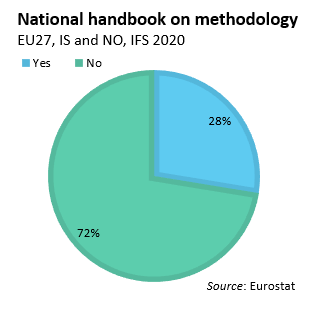


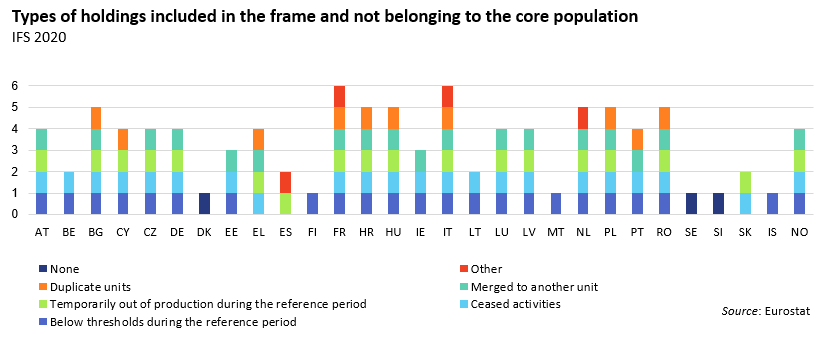
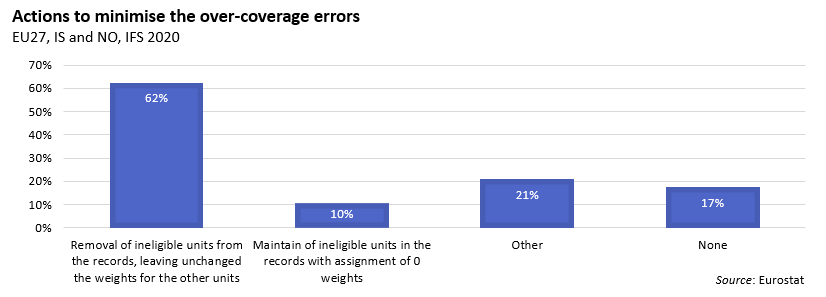

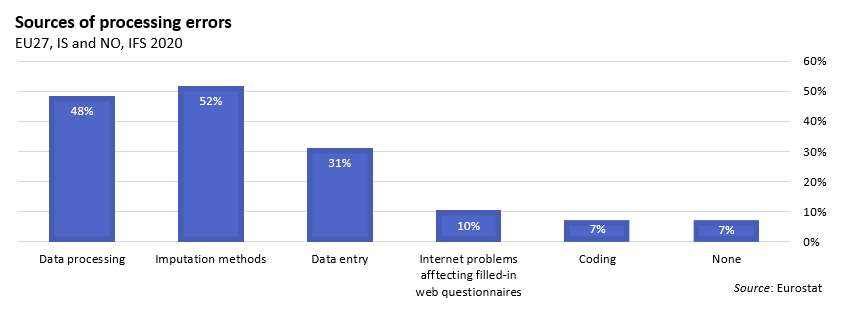
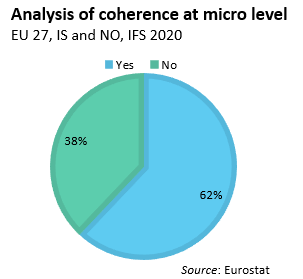

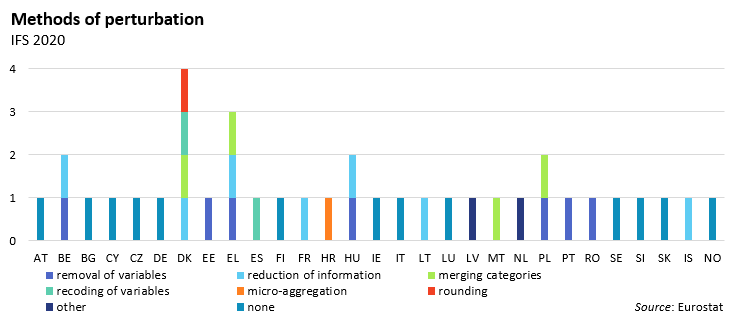
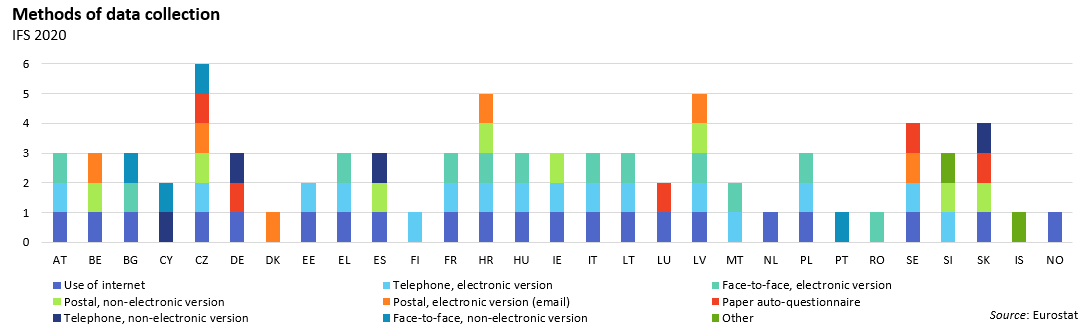

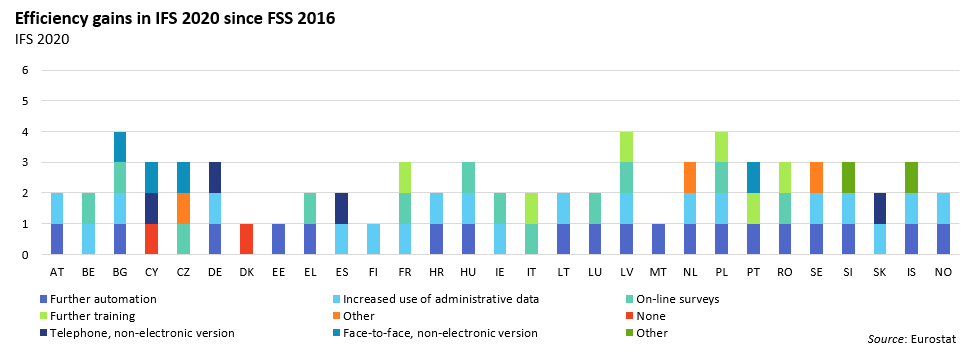

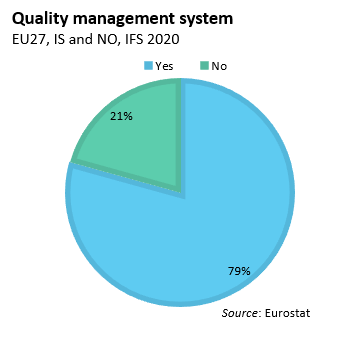


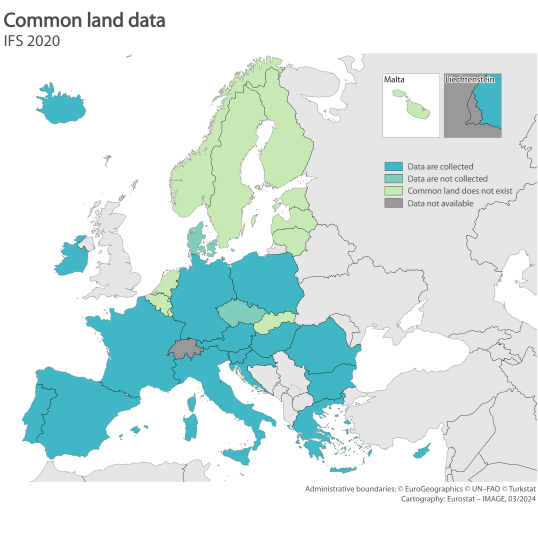
