Resource productivity statistics
Data extracted in July 2023.
Planned article update: 31 July 2024.
Highlights
Resource productivity in the EU economy has increased by around 37 % since the year 2000.
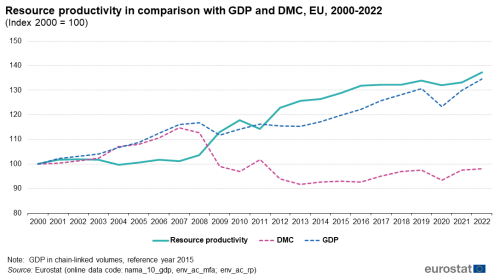
EU resource productivity in comparison with GDP and DMC, 2000-2022
This article presents recent statistics on resource productivity in the European Union (EU) and its Member States. Since the year 2000, the EU’s resource productivity has increased by around 37 %.
Resource productivity quantifies the relation between economic activity - expressed by gross domestic product (GDP) - and the consumption of material resources - measured as domestic material consumption (DMC) which is an indicator derived from economy-wide material flow accounts (EW-MFA). Resource productivity is an important indicator of the sustainable development goal 12 ‘responsible consumption and production’.
Full article
Resource productivity of the EU and across Member States over time
Resource productivity is measured as gross domestic product (GDP) over domestic material consumption (DMC). The latter measures the total amount of materials directly consumed in an economy by businesses for economic production and by households. The former is a basic measure of the overall size of a country's economy. Two different versions of GDP are used in this article:
- GDP expressed in chain-linked volumes is used for comparisons over time as it shows the development of the economic aggregate excluding inflation;
- GDP expressed in current prices converted into purchasing power standards (PPS) is used for cross-country comparisons in a specific year as PPS remove differences in price levels between countries.

Source: Eurostat (nama_10_gdp) (env_ac_mfa) (env_ac_rp)
Since 2000, the resource productivity of the European Union (EU) economy increased by around 37 %. This growth happened mainly with and after the global financial crisis of 2007-2008, however, before this resource productivity had remained rather stable. The COVID-19 recession caused a moderate decrease between 2019 and 2020 (see Figure 1).
An analysis of the resource productivity components, namely GDP and DMC, helps to explain these developments. Before 2007-2008, GDP and DMC had been growing almost in parallel resulting in a more or less stable resource productivity. Between 2008 and 2016, the two components decoupled, i.e. developed in reverse directions. Since 2016, both components seemed to re-couple again, i.e. show rather parallel annual change patterns.
The global financial crisis in 2007-2008 had a very different impact on the resource productivity of the EU than the COVID-19 recession. While the former triggered a significant growth in resource productivity, the latter caused a moderate decrease, which, however, remained less pronounced than the GDP fall between 2019 and 2020. During the global financial crisis and the following years, the consumption of materials – in particular for construction, i.e. gross capital formation – dropped much more than the GDP and stayed at low levels until 2016. On the other hand, the COVID-19 pandemic caused a much more significant shrinking of the EU economy compared to the global financial crisis, while material consumption decreased moderately, in particular because the consumption of construction material and biomass almost remained unchanged.
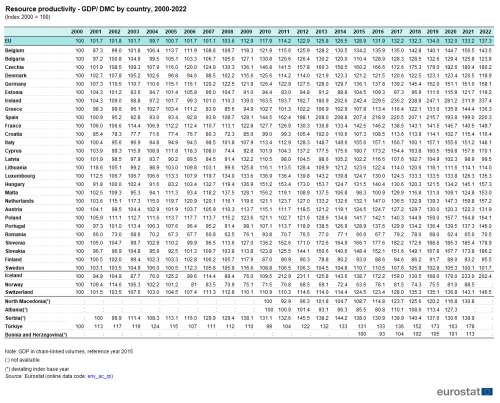
At Member State level, resource productivity developed quite differently (see Table 1). It increased in nearly all countries between the year 2000 and today. In Ireland and Spain, resource productivity more than doubled. Despite the COVID-19 recession, resource productivity even grew in 2022 in some countries, most notably in Ireland, Hungary and Malta.
Variation of resource productivity across EU Member States
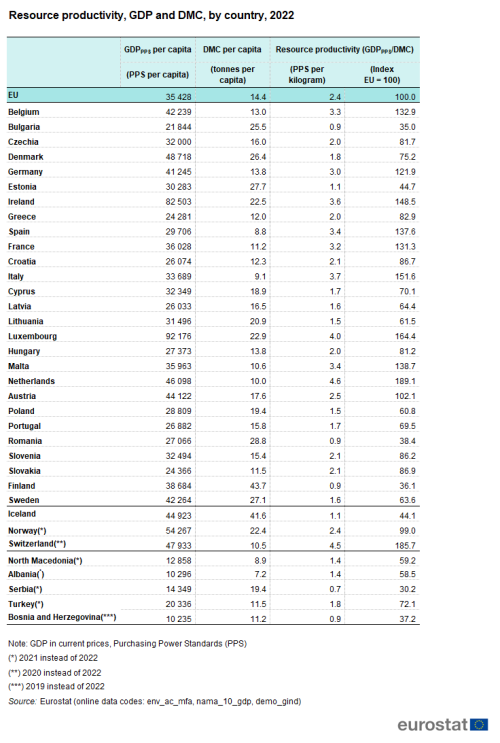
Expressed in GDP in PPS over DMC, the resource productivity amounts to 2.40 euro/kg for the aggregated EU economy in 2022. The ratio varies considerably across EU Member States from less than 1 €/kg in Bulgaria, Finland and Romania to more than 3 €/kg in France, Belgium, Spain, Malta, Ireland, Italy, Luxembourg and the Netherlands (see Table 2).
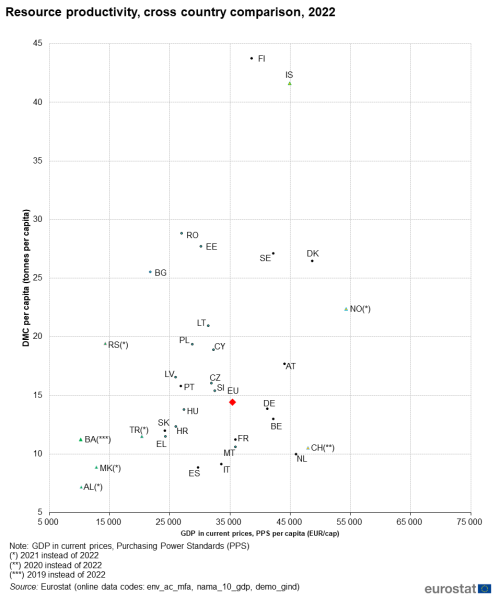
Figure 2 is a scatterplot presenting DMC against GDP levels. There is no clear linear relationship between GDP and DMC. There are countries with low GDP and high DMC, (e.g. Romania) but also countries with high GDP and low DMC (e.g. Ireland). Further, there are countries with low DMC and low GDP (e.g. Greece) as well as high DMC and high GDP (e.g. Luxembourg).

Source: Eurostat (nama_10_gdp) (demo_gind) (env_ac_mfa)

Source: Eurostat (nama_10_gdp) (demo_gind) (env_ac_mfa)
DMC and GDP growth rates in EU and Member States - decoupling issues
Looking at the long term change rates of DMC and GDP provides an insight on the degree of decoupling between DMC (pressure on the environment) and GDP (economic growth). Figure 3 illustrates how far decoupling has been achieved in the EU economy. The diagonal line represents identical change rates of both GDP and DMC. Countries which find themselves above this diagonal line had higher DMC growth than GDP growth and did not de-couple the two. Below the diagonal line are all countries whose GDP increased faster than their DMC and which thus achieved at least relative decoupling. Absolute decoupling denotes absolute decrease of DMC while GDP grows and was achieved by many European countries over the reporting period, including the EU economy as a whole.
It is important to note that this outcome should be further investigated as the economic crisis proved decisive to determine it and could also be the result of outsourcing material-intensive production to other parts of the world. However, those aspects of dislocated environmental pressures through trade are not covered by the DMC indicator. More comprehensive data which reflect materials embodied in trade can be found in Material flow accounts - flows in raw material equivalents

Source: Eurostat (nama_10_gdp) (env_ac_mfa) a scatter graph showing Changes of DMC GDP by country from 2000 to 2022.
Source data for tables and graphs
Data sources
This article uses data from economy-wide material flow accounts (EW-MFA), which are one of the European environmental economic accounts (see Regulation (EU) No 691/2011 on European environmental economic accounts).
Economy-wide material flow accounts (EW-MFA) provide an aggregate overview, in thousand tonnes per year, of the material flows into and out of an economy. EW-MFA cover solid, gaseous, and liquid materials, except for bulk flows of water and air. Material inputs into national economies include domestic extraction of material originating from the domestic environment and physical imports originating from other economies. Material outputs from national economies include materials released to the domestic environment (e.g. emissions to air, water and soil) and physical exports to other economies. Material flows within the economy are not represented in EW-MFA.
A variety of material flow-based indicators are derived from EW-MFA amongst which the following:
Domestic material consumption (DMC) measures the total amount, in tonnes, of material directly used in an economy, i.e. by resident businesses, governments and other institutions for economic production or by households. DMC equals the domestic extractions of materials plus imports minus exports. At the same time, DMC is the amount of materials that become part of the material stock within the economy or are released back to the environment in form of e.g. emissions to air.
Resource productivity is defined here as GDP divided by DMC. It is important to note that GDP is expressed in different measurement units, of which the following are used to calculate three different resource productivity ratios. The appropriate choice depends on the context of the analysis:
- euro per kilogram using chain-linked volume data for GDP, to be used for analysing developments in real terms over time;
- PPS per kilogram using current price data for GDP expressed in purchasing power standards (PPS); PPS are artificial currency units that remove differences in purchasing power between economies by taking account of price level differences; these can be used when comparing across different economies at one point in time (for one particular year);
- euro per kilogram using current price data for GDP, which could be used when analysing a single economy at one point in time (for one particular year).
See also MFA metadata.
Decoupling
The term decoupling refers to breaking the link between an environmental and an economic variable. As defined by the Organisation for Economic Co-operation and Development (OECD), decoupling occurs when the growth rate of an environmental pressure (for example, DMC) is less than that of its economic driving force (for example, GDP) over a given period. Decoupling can be either absolute or relative. Absolute decoupling is said to occur when the environmental variable is stable or decreases while the economic driving force grows. Decoupling is said to be relative when the rate of change of the environmental variable is less than the rate of change of the economic variable.
Context
Eurostat’s environmental accounts and statistics inform policy making under the European Green Deal. The European Green Deal is the first of six priorities of the European Commission for the period 2019-2024. It is a growth strategy that will transform the Union into a modern, resource-efficient and competitive economy, where there are no net emissions of greenhouse gases by 2050, economic growth is decoupled from resource use, and no person and no place is left behind. The European Green Deal boosts the efficient use of resources by moving to a clean, circular economy, restore biodiversity and cut pollution. The European Green Deal is the plan to make the EU's economy sustainable.
Further reading:
A European Green Deal – EC website
Communication and roadmap on the European Green Deal
Publication: A new Circular Economy Action Plan for a Cleaner and More Competitive Europe
Communication: A new Circular Economy Action Plan for a Cleaner and More Competitive Europe
Direct access to
- Material flow accounts and resource productivity
- Physical imports and exports
- Material flow accounts - flows in raw material equivalents
- Environmental accounts - establishing the links between the environment and the economy*Environmental accounts - establishing the links between the environment and the economy
- Environment (env)
- Material flows and resource productivity (env_mrp), see:
- Material flow accounts (env_ac_mfa)
- Resource productivity (env_ac_rp)
- Circular economy indicators (cei)
- European Commission — Environment — Circular economy
- European Environment Agency: The European environment — state and outlook 2015 SOER 2015
- European Environment Agency: The European environment — state and outlook 2020: knowledge for transition to a sustainable Europe SOER 2020
- OECD — Resource efficiency
