
New insights into European maritime traffic
date: 11/03/2019
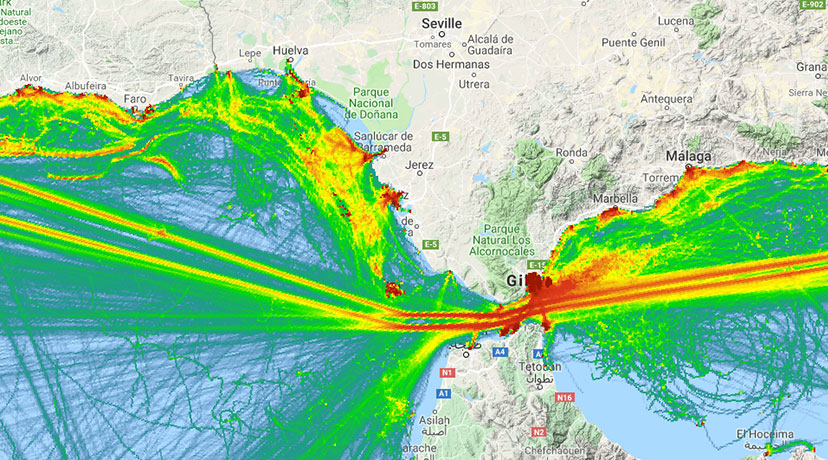
For the first time those responsible for monitoring shipping emissions, identifying the best routes to lay pipelines and cables, assessing the impact of fishing on the seafloor or planning offshore wind farms can have maps of vessel activity on their desktops.
The new EMODnet digital vessel density maps will help them visualise vessel movement patterns and distribution of maritime traffic in European waters. This allows users to access monthly composite maps by ship type for the year 2017 (with more to come). Maps are available free of charge for viewing, downloading, processing and use for commercial and non-commercial purposes alike from the EMODnet Human Activities portal.
The EMODnet Human Activities team has developed a bespoke method for developing the vessel density maps, in close consultation with the Joint Research Centre (JRC).
For the moment, the data available in the maps cover 2017, but 2018 data is due later this year. Regular updates will be released on the portal as soon as they become available.