This article forms part of Eurostat’s methodology manual on territorial typologies.

The border typology is applied at the level of NUTS level 3 regions: it identifies border regions in the European Union (EU) as those regions with a land border, or those regions where more than half of the population lives within 25 km of such a border.
Classes for the typology and their conditions
Details of the typology
The border typology is a classification based on the following two categories:
- border regions;
- non-border regions (those regions that are not defined as border regions).
Methodology for the typology
In principle, border regions should ideally be defined as those regions which have part of their territory demarcated by an international border. However, for analytical purposes, border regions are defined as NUTS level 3 regions located along or very close to land borders. There are two main types of border region for analyses:
- internal border regions, in other words, those regions located on borders between EU Member States and/or EFTA countries; and,
- external border regions, in other words, those regions located on borders between EU Member States and non-member countries (outside of EFTA).
As the severity of border effects is likely to diminish as a function of the distance from a border, the definition of border regions is complemented by those regions which, although they do not have a border, are located within 25 km of a border. Using this broad definition, the following different types of border region may be identified:
- a land border;
- a land border within 25 km;
- non-border regions.
As this typology is based solely on the distance between a border and a region, there is no need to make use of any other data source when establishing the typology.
Note the border typology is not defined/recognised within the NUTS Regulation, although the NUTS level 3 regions themselves are defined therein. As such, EU legislation on border regions may, for specific reasons, make use of alternative definitions: for example, it may refer to both land and maritime borders or it could refer exclusively to the EU’s external borders. Although not covered here, the following additional types of border region may be considered:
- a maritime border;
- a maritime border within 25 km;
- a land and a maritime border;
- a land border within 25 km and a maritime border within 25 km.
Links to other spatial concepts/typologies
There are close links between the border typology and the urban-rural typology (see Chapter 5) as each border region is classified as a predominantly urban, intermediate or predominantly rural region. Some border regions may also be classified as mountain regions (see Chapter 10).
Results
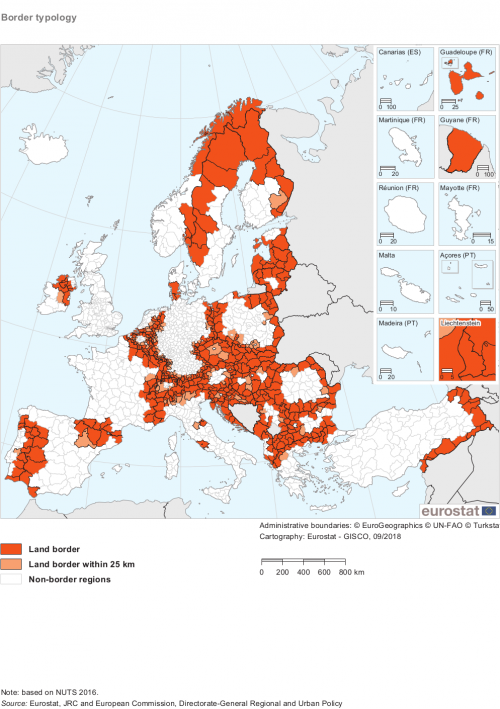
Based on the above definitions, there are 463 NUTS 2016 level 3 border regions in the EU-28 and 885 non-border regions. The EU’s border regions include the following classes: 360 regions have a land border and 103 regions are within 25 km of a land border.
Map 1 provides an overview of the final classification for the border typology showing the different classes described above.
Changes to the typology over time
The border typology was developed by the European Commission’s Directorate-General for Regional and Urban Policy in association with Eurostat.
As noted above, the border typology is not defined/recognised within the NUTS Regulation and hence EU legislation may, for specific reasons, make use of alternative definitions (over time). For example, the exact definition of border regions within the context of cross-border cooperation has changed from one programming period to the next and currently includes support for regions with maritime borders. The EU seeks to boost growth and cohesion in EU border regions (COM(2017) 534 final) as, for example, border regions often perform less well economically and access to public services (such as hospitals or universities) is generally lower in border regions. Within this context, the EU uses a definition of border regions that is based exclusively on internal, land-based borders (note that borders with Liechtenstein, Norway and Switzerland are also included).
The flexible nature of definitions employed is one of the main reasons why a standardised definition of border regions has yet to be integrated into the legislation for territorial typologies.
Changes over time that impact on the classification
The border regions classification should be updated to reflect any changes to the underlying sources of information that are used in its compilation, in other words, changes to international borders or changes to the boundaries of NUTS level 3 regions.
The NUTS Regulation specifies that the classification of regions should remain stable for a period of at least three years; the most recent updates were for NUTS 2010, NUTS 2013 and NUTS 2016. After each revision of the NUTS classification, the distance between each international border and the boundaries of each NUTS level 3 region should be re-assessed in the event that some boundaries have moved closer to (or further away) from an international border; note that when the NUTS classification is revised it is also possible for some regions to be split or merged with other regions. Changes to international borders are far less common (although should not be entirely ruled out).
Future developments
The next update of the NUTS classification is foreseen to take place in 2019.
Further information
Glossary entry:
Published indicators
A variety of different statistical surveys collect data for NUTS level 3 regions and this information may be used to calculate data for border and non-border regions. This process involves aggregating the data for NUTS level 3 regions to compute a total or an average for all border (and non-border) regions within a territory (for example a Member State, or the EU as a whole).
Visualisation tools:
Eurostat publishes data for the border typology through Regions and cities illustrated.
Database:
Eurostat’s website provides information for a wide variety of indicators for the border typology. These statistics are available for the following statistical domains: demography, population projections, the labour market, crimes recorded by the police, economic accounts, business demography, intellectual property rights and transport. They are available here.
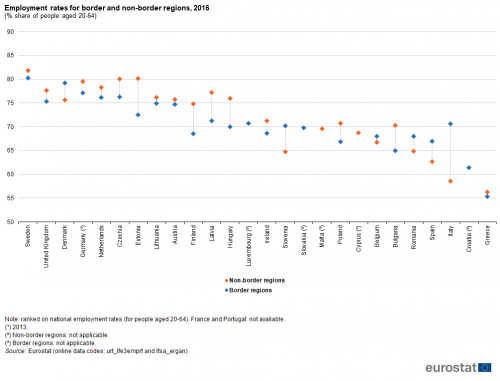
Example

Source: Eurostat (urt_lfe3emprt) and (lfsa_ergan)

