This article forms part of Eurostat’s methodology manual on territorial typologies.

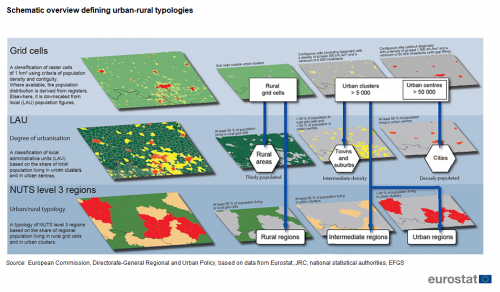
The urban-rural typology is applied to NUTS level 3 regions: it identifies three types of region based on the share of the rural population, namely, predominantly rural regions, intermediate regions and predominantly urban regions.
Classes for the typology and their conditions
Details of the typology
The urban-rural typology is a classification based on the following three categories:
- predominantly urban regions, NUTS level 3 regions where at least 80 % of the population live in urban clusters;
- intermediate regions, NUTS level 3 regions where more than 50 % but less than 80 % of the population live in urban clusters;
- predominantly rural regions, NUTS level 3 regions where at least 50 % of the population live in rural grid cells.
Methodology for the typology
The urban-rural classification is based on data for 1 km² population grid cells. Each cell has the same shape and surface area, thereby avoiding distortions caused by using units varying in size. This is a considerable advantage when compared with alternative approaches such as those based on the use of administrative data for local administrative units (such as municipalities).
The use of relatively small (1 km²) and uniform grid cells means that the building blocks for the urban-rural typology look inside larger local administrative units thereby providing more accurate data for the three categories. Note that to have a population grid covering all of the European Union (EU) Member States it was necessary to employ a ‘top-down’ approach (or a disaggregation grid) for those Member States which did not dispose of a 1 km² grid. Such an approach is based on disaggregating population data for local administrative units according to land use or land cover information. In some other cases, Member States use a hybrid approach to manage situations where the coverage of the population grid is incomplete. More information pertaining to population grids as building blocks for developing territorial typologies is provided in the introductory chapter.
Step 1: classifying grid cells
Groups of 1 km² population grid cells are plotted in relation to their neighbouring cells to identify:
- rural grid cells: all grid cells outside of urban clusters/centres, in other words, those cells with a population density that is (usually) less than 300 inhabitants per km² and/or fewer than 5 000 inhabitants;
- urban clusters (moderate-density clusters): a cluster of contiguous grid cells (in other words, grid cells that share a common border including grid cells that only touch diagonally at corners) with a population density of at least 300 inhabitants per km² and a minimum population of at least 5 000 inhabitants.
For a more detailed explanation of how grid cells are classified to the various cluster types, see Chapter 1.
Step 2: classifying the NUTS level 3 regions according to the urban-rural typology using the population living in rural grid cells and urban clusters
Once the grid cells have been classified as either rural grid cells or urban clusters, the next step concerns overlaying these results onto the NUTS level 3 regions, as follows:
- calculate the total grid-based population for each NUTS level 3 region (A);
- calculate the population living in urban clusters for each NUTS level 3 region (B);
- calculate the share of the population living in urban clusters for each NUTS level 3 region (B/A*100);
- make an initial classification based on these shares:
- ≥ 80 % live in urban clusters = predominantly urban region;
- > 50 % and > 80 % live in urban clusters = intermediate region;
- ≥ 50 % live in rural grid cells = predominantly rural region.
By going straight from the population grid to the regional level, the potential for distortion from different sized local administrative units (LAUs) is circumvented. By avoiding the use of LAUs the results are also thought to be more representative:
- with an increase in the share of the population living in predominantly rural regions in, for example, Belgium, Germany or the Netherlands;
- with a reduction in the share of the population living in predominantly rural regions in, for example, Denmark, Finland or Sweden.
Further adjustments
The urban-rural typology is then adapted to take account of two special cases, namely:
- the presence of small NUTS level 3 regions;
- the presence of main cities.
Adjusting for the presence of small NUTS level 3 regions
In order to avoid distortions to the classification that may result from differences in the size (area) of NUTS level 3 regions across the EU, those NUTS regions with a surface area of less than 500 km² are combined with one (or more) neighbouring regions to determine their classification.
NUTS level 3 regions with a surface area of less than 500 km² are identified and their population-weighted centroid point is calculated; this is the mean centre point for the region (sometimes referred to as the centre of gravity) that may be found by taking the arithmetic mean of each coordinate or geocoded reference for point-based population grid data (a more in-depth explanation of the population grid is provided in the introductory chapter).
The next step is to calculate the distance between the centroid of the small NUTS level 3 region and the centroid of the nearest neighbouring region. In the case that two small NUTS level 3 regions are adjacent to each other, this process may need to be repeated in order to add more neighbours. The following two cases may be identified:
- in the case that both regions have the same urban-rural class then no change is made to the classification;
- if the small regions have different urban-rural classes, then they are considered (together) as an ad-hoc NUTS region. A new calculation is made to determine the share of the total population living in urban clusters for the ad-hoc NUTS region. If this gives a different result compared with the initial class for the small NUTS region then the class for the small NUTS region is adjusted. Note the ad-hoc NUTS region is not used for any other purpose and is broken-up as soon as any adjustments have been made for small regions; as a result, the final outcome is a classification that maintains a full list of NUTS level 3 regions.
Note that this adjustment for small regions only concerns neighbouring regions from the same EU Member State, while regions from different countries are not considered. Furthermore, small island regions (that are themselves distinct NUTS regions) are not combined as they are considered not to have any neighbouring region. If there is no obvious way of grouping small neighbouring regions together then no change is made.
Adjusting for the presence of main cities
The second adjustment that is made to the urban-rural typology is in relation to main cities. Population gird figures from the latest census (reference year 2011) are used to determine if any adjustment needs to be made based on the following rules:
- any NUTS level 3 region which is classified (by the criteria described above) as predominantly rural becomes intermediate if it contains a city of more than 200 000 inhabitants representing at least 25 % of the region’s total population;
- any NUTS level 3 region which is classified (by the criteria described above) as intermediate becomes predominantly urban if it contains a city of more than 500 000 inhabitants representing at least 25 % of the region’s total population.
Links to other spatial concepts/typologies
The urban-rural classification provides similar (but not identical) spatial concepts to the degree of urbanisation classification (see Chapter 2 for more information), as both predominantly rural regions and rural areas are based on the share of population living in rural grid cells. There are also close links between predominantly urban regions and metropolitan regions (see Chapter 6 for more information).
Results
Among the 1 348 NUTS 2016 level 3 regions in the EU-28, some 367 were classified as predominantly urban regions, 553 as intermediate regions and 428 as predominantly rural regions. There were 358 NUTS level 3 regions whose classification was impacted by the change to NUTS 2016.
Looking in more detail at the results for NUTS 2016, there were 25 EU Member States that have all three types of region in the urban-rural typology, while the three exceptions were:
- Cyprus and Luxembourg (both composed of a single NUTS level 3 region), which were classified as intermediate regions;
- Malta (composed of two NUTS level 3 regions), both of which were classified as predominantly urban regions.
When classifying NUTS 2016 regions, there were 145 NUTS level 3 regions that were reclassified within the urban-rural typology as a result of adjusting for the presence of small regions with a surface area of less than 500 km².
When classifying NUTS 2016 regions, there were three NUTS level 3 regions that moved from being predominantly rural regions to intermediate regions as a result of the presence of a city with more than 200 000 inhabitants, they were: Maine-et-Loire (FRG02), Ille-et-Vilaine (FRH03) and Radomski (PL921). In a similar vein, there were 12 NUTS level 3 regions that moved from being intermediate regions to predominantly urban regions as a result of the presence of a city with more than 500 000 inhabitants, they were: Kortrijk (BE254), Hlavní město Praha (CZ010), Středočeský kraj (CZ020), Loire-Atlantique (FRG01), Gironde (FRI12), Haute-Garonne (FRJ23), Vilniaus apskritis (LT011), Miasto Kraków (PL213), Bytomski (PL228), Miasto Poznań (PL415), Miasto Wrocław (PL514) and Västra Götalands län (SE232).
Map 1 provides an overview of the final classification of the urban-rural typology.
Changes to the typology over time
Historical developments
Urban and rural developments are central concepts used by a wide range of policymakers, researchers, national administrations and international organisations. The urban-rural typology was jointly developed by four different Directorates-General within the European Commission during a two year period through to 2010: the Directorate-General for Agriculture and Rural Development, Eurostat, the Joint Research Centre (JRC) and the Directorate-General for Regional and Urban Policy. The aim of the work to develop the typology was to build on work already done by the OECD so as to provide a consistent basis for the description of predominantly rural, intermediate and predominantly urban regions.
Although in principle this methodology can also be applied to higher geographical aggregates (such as NUTS level 2 or NUTS level 1 regions), Eurostat advises against this practice as its application for higher aggregates may, in some cases, hide considerable differences between neighbouring regions at a more detailed level.
Changes over time that impact on the classification
The urban-rural classification should be updated to reflect any changes to the underlying sources of information that are used in the compilation of this classification. As such, the classification may be updated to reflect: changes to population distributions for 1 km² grid cells or changes in the NUTS classification. The frequency of such updates varies according to the source of information.
Changes to the urban-rural classification resulting from a revision of population distributions for 1 km² grid cells are less common and these may be expected every 10 years. The next major update of the population grid is foreseen to take place for the 2021 reference year.
The NUTS Regulation specifies that the classification of regions should remain stable for a period of at least three years; the most recent updates were for NUTS 2010, NUTS 2013 and NUTS 2016. After each revision of the NUTS classification, population grid statistics should be re-assessed in order to (re-)classify each NUTS level 3 region. For the introduction of NUTS 2016, the urban-rural typology was updated exclusively to take into account changes to NUTS boundaries.
Future developments
The next update of the NUTS classification is foreseen to take place in 2019.
At the time of writing, a 2021 population and housing census implementing regulation is in the process of being adopted by the European Commission. It includes an article for 1 km² population grid statistics. As well as information for annual counts of populations, it also foresees more detailed analyses: population by sex, population by age, number of employed persons, population by place of birth, population by usual place of residence one year prior to the census.
Eurostat are also discussing post-2021 census developments with national statistical authorities. It is hoped that the European statistical system (ESS) will agree to produce — from the mid-2020s onwards — annual counts of populations (based on usual place of residence) for a 1 km² grid, with data to be made available within 12 months of the reference period.
Further information
Glossary entries:
Detailed methodology:
Correspondence for NUTS regions:
Correspondence table for urban-rural typology
Published indicators
A variety of different statistical surveys collect data for NUTS level 3 regions and this information may be used to calculate data for the three different categories in the urban-rural typology. This process involves aggregating the data for NUTS level 3 regions to compute a total or an average for all predominantly rural regions, intermediate regions or predominantly urban regions within a territory (for example a Member State, or the EU as a whole).
Visualisation tools:
Eurostat publishes data for the urban-rural typology through Regions and cities illustrated.
The urban-rural classification may be viewed through Eurostat’s Statistical atlas.
Database:
Eurostat’s website provides information for a wide variety of indicators for the urban-rural typology. These statistics are available for the following statistical domains: demography, population projections, the labour market, crimes recorded by the police, economic accounts, business demography, intellectual property rights and transport. They are available here.
Examples
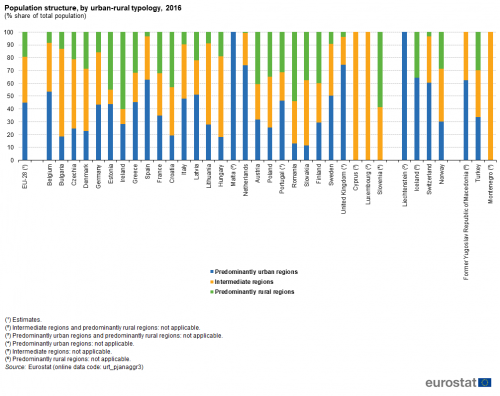
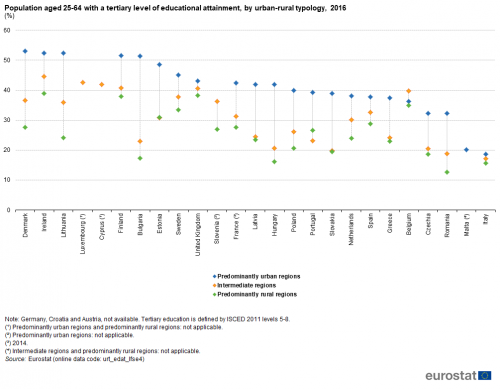
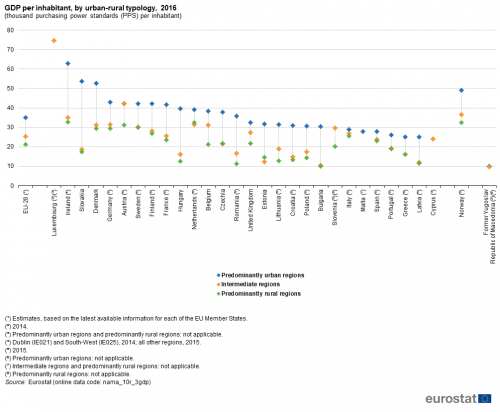
The information presented in Figures 2-5 concerns data for the urban-rural typology that is based on the NUTS 2013 classification.

(% share of total population)
Source: Eurostat (urt_pjanaggr3)

(%)
Source: Eurostat (urt_edat_lfse4)


