Tutorials
Log in
Statistics Explained
menu
search
search
Navigation
Main page
Statistical themes
Glossary
Categories
Statistics 4 beginners
Tutorials
Help
Eurostat home
Education corner
Online publications
Regional yearbook
Sustainable development
Full list
Tools
User contributions
Logs
View user groups
Special pages
search
Navigation
Main page
Statistical themes
Glossary
Categories
Statistics 4 beginners
Tutorials
Help
Eurostat home
Education corner
Online publications
Regional yearbook
Sustainable development
Full list
Tools
User contributions
Logs
View user groups
Special pages
Navigation
Main page
Statistical themes
Glossary
Categories
Statistics 4 beginners
Tutorials
Help
Eurostat home
Education corner
Online publications
Regional yearbook
Sustainable development
Full list
Tools
User contributions
Logs
View user groups
Special pages
Uploads by Tsigkor
This special page shows all uploaded files.
File list
Items per page:
20
50
100
250
500
Search for media name:
Username:
Include old versions of files
Go
First page
Previous page
Next page
Last page
Date
Name
Thumbnail
Size
Description
Versions
12:54, 5 April 2023
Annual national accounts - evolution - tables and figures V5.xlsx
(
file
)
68 KB
1
12:35, 5 April 2023
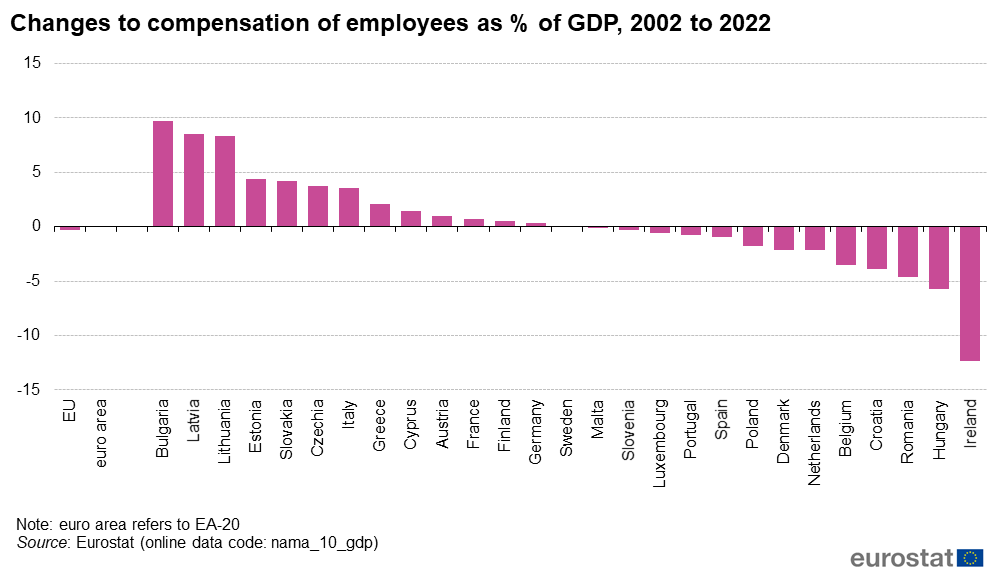
Fig3 Changes to compensation of employees as % of GDP, 2002 to 2022.png
(
file
)
43 KB
3
12:33, 5 April 2023
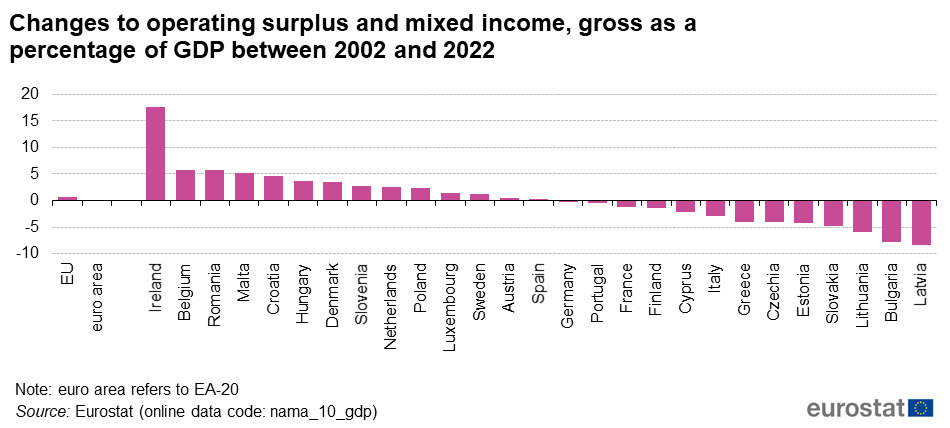
Fig7 Changes to operating surplus and mixed income, gross as a percentage of GDP between 2002 and 2022.png
(
file
)
42 KB
2
12:32, 5 April 2023
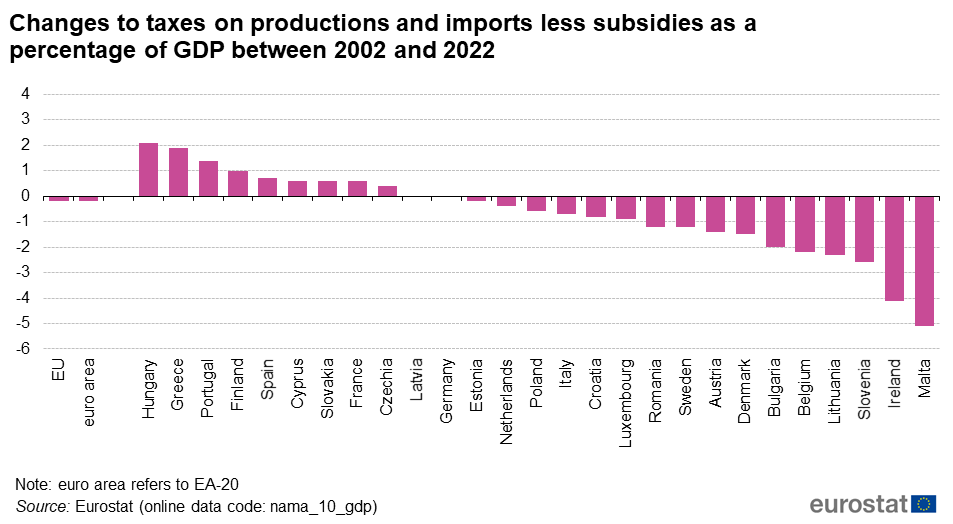
Fig6 Changes to taxes on productions and imports less subsidies as a percentage of GDP between 2002 and 2022.png
(
file
)
46 KB
2
12:30, 5 April 2023
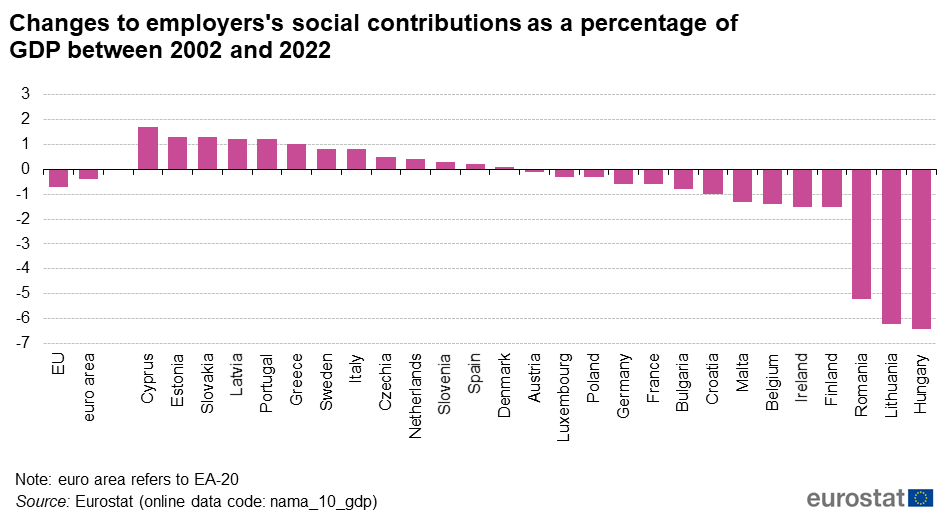
Fig5 Changes to employers's social contributions as a percentage of GDP between 2002 and 2022.png
(
file
)
46 KB
2
12:27, 5 April 2023
Fig4 Changes to wages and salaries as a percentage of GDP between 2002 and 2022.png
(
file
)
41 KB
2
12:18, 5 April 2023
Changes to compensation of employees as % of GDP, 2002 to 2022.png
(
file
)
43 KB
1
12:16, 5 April 2023
Income components of GDP (%) in 2022, 2021 and 2002.png
(
file
)
117 KB
2
12:11, 5 April 2023
Shares of income components to GDP in 2022.png
(
file
)
92 KB
1
09:31, 29 July 2020
MS S11 INV.png
(
file
)
60 KB
3
09:29, 29 July 2020
MS S11 B2G.png
(
file
)
59 KB
2
09:13, 29 July 2020
EU S11 INV.png
(
file
)
83 KB
2
08:59, 29 July 2020
MS S11 PRF.png
(
file
)
71 KB
2
08:42, 29 July 2020
MS S1M INV.png
(
file
)
53 KB
2
08:38, 29 July 2020
MS S1M B6G.png
(
file
)
60 KB
2
08:16, 29 July 2020
MS S1M SRG.png
(
file
)
56 KB
Reverted to version as of 06:15, 29 July 2020
5
10:06, 27 April 2018
T+120 NR EN 2017Q4.xlsx
(
file
)
368 KB
2
10:02, 27 April 2018
NFC3 2017Q4 Nominal growth of components of the investment rate and the profit share (euro area).png
(
file
)
18 KB
1
10:02, 27 April 2018
NFC2 2017Q4 Profit share of non-financial corporations (seasonally adjusted).png
(
file
)
18 KB
1
10:02, 27 April 2018
NFC1 2017Q4 Investment rate of non-financial corporations (seasonally adjusted).png
(
file
)
18 KB
1
10:02, 27 April 2018
3 2017Q4 Nominal growth of household adjusted gross disposable income actual final consumption and gross fixed capital formation (euro area).png
(
file
)
19 KB
1
10:01, 27 April 2018
2 2017Q4 Household investment rate (seasonally adjusted).png
(
file
)
15 KB
1
10:00, 27 April 2018
1 2017Q4 Household saving rate (seasonally adjusted).png
(
file
)
18 KB
1
09:47, 25 January 2018
T+120 NR EN 2017Q3.xlsx
(
file
)
368 KB
1
09:45, 25 January 2018
NFC3 2017Q3 Nominal growth of components of the investment rate and the profit share (euro area).png
(
file
)
17 KB
1
09:45, 25 January 2018
NFC2 2017Q3 Profit share of non-financial corporations (seasonally adjusted).png
(
file
)
18 KB
1
09:44, 25 January 2018
NFC1 2017Q3 Investment rate of non-financial corporations (seasonally adjusted).png
(
file
)
18 KB
1
09:44, 25 January 2018
3 2017Q3 Nominal growth of household adjusted gross disposable income actual final consumption and gross fixed capital formation (euro area).png
(
file
)
19 KB
1
09:44, 25 January 2018
2 2017Q3 Household investment rate (seasonally adjusted).png
(
file
)
15 KB
1
09:44, 25 January 2018
1 2017Q3 Household saving rate (seasonally adjusted).png
(
file
)
18 KB
1
10:14, 27 October 2017
NFC3 2017Q2 Nominal growth of components of the investment rate and the profit share (euro area).png
(
file
)
17 KB
1
10:13, 27 October 2017
NFC2 2017Q2 Profit share of non-financial corporations (seasonally adjusted).png
(
file
)
18 KB
1
10:13, 27 October 2017
NFC1 2017Q2 Investment rate of non-financial corporations (seasonally adjusted).png
(
file
)
18 KB
1
10:11, 27 October 2017
3 2017Q2 Nominal growth of household adjusted gross disposable income actual final consumption and gross fixed capital formation (euro area).png
(
file
)
19 KB
1
10:11, 27 October 2017
2 2017Q2 Household investment rate (seasonally adjusted).png
(
file
)
15 KB
1
10:11, 27 October 2017
1 2017Q2 Household saving rate (seasonally adjusted).png
(
file
)
18 KB
1
10:05, 27 October 2017
T+120 NR EN 2017Q2.xlsx
(
file
)
368 KB
1
12:45, 26 July 2017
NFC3 2017Q1 Nominal growth of components of the investment rate and the profit share (euro area).png
(
file
)
18 KB
1
12:45, 26 July 2017
NFC2 2017Q1 Profit share of non-financial corporations (seasonally adjusted).png
(
file
)
18 KB
1
12:44, 26 July 2017
NFC1 2017Q1 Investment rate of non-financial corporations (seasonally adjusted).png
(
file
)
18 KB
1
12:39, 26 July 2017
T+120 NR EN 2017Q1.xlsx
(
file
)
368 KB
1
12:37, 26 July 2017
3 2017Q1 Nominal growth of household adjusted gross disposable income actual final consumption and gross fixed capital formation (euro area).png
(
file
)
19 KB
1
12:36, 26 July 2017
2 2017Q1 Household investment rate (seasonally adjusted).png
(
file
)
15 KB
1
12:22, 26 July 2017
1 2017Q1 Household saving rate (seasonally adjusted).png
(
file
)
18 KB
1
12:02, 27 April 2017
NFC3 2016Q4 Nominal growth of components of the investment rate and the profit share (euro area).png
(
file
)
18 KB
1
12:02, 27 April 2017
NFC2 2016Q4 Profit share of non-financial corporations (seasonally adjusted).png
(
file
)
18 KB
1
12:02, 27 April 2017
NFC1 2016Q4 Investment rate of non-financial corporations (seasonally adjusted).png
(
file
)
19 KB
1
11:56, 27 April 2017
T+120 NR EN 2016Q4.xlsx
(
file
)
383 KB
1
11:04, 27 April 2017
3 2016Q4 Nominal growth of household adjusted gross disposable income actual final consumption and gross fixed capital formation (euro area).png
(
file
)
20 KB
1
11:04, 27 April 2017
2 2016Q4 Household investment rate (seasonally adjusted).png
(
file
)
15 KB
1
First page
Previous page
Next page
Last page
Special page
ISSN 2443-8219


_in_2022,_2021_and_2002.png)


.png)
.png)
.png)
.png)
.png)
.png)
.png)
.png)
.png)
.png)
.png)
.png)
.png)
.png)
.png)
.png)
.png)
.png)
.png)
.png)
.png)
.png)
.png)
.png)
.png)
.png)
.png)
.png)
.png)