Tutorials
Log in
Statistics Explained
menu
search
search
Navigation
Main page
Statistical themes
Glossary
Categories
Statistics 4 beginners
Tutorials
Help
Eurostat home
Education corner
Online publications
Regional yearbook
Sustainable development
Full list
Tools
User contributions
Logs
View user groups
Special pages
search
Navigation
Main page
Statistical themes
Glossary
Categories
Statistics 4 beginners
Tutorials
Help
Eurostat home
Education corner
Online publications
Regional yearbook
Sustainable development
Full list
Tools
User contributions
Logs
View user groups
Special pages
Navigation
Main page
Statistical themes
Glossary
Categories
Statistics 4 beginners
Tutorials
Help
Eurostat home
Education corner
Online publications
Regional yearbook
Sustainable development
Full list
Tools
User contributions
Logs
View user groups
Special pages
Uploads by Recricr
This special page shows all uploaded files.
File list
Items per page:
20
50
100
250
500
Search for media name:
Username:
Include old versions of files
Go
First page
Previous page
Next page
Last page
Date
Name
Thumbnail
Size
Description
Versions
18:58, 26 September 2023
Foodwaste 2023 09 29 data2021.xlsx
(
file
)
41 KB
1
18:48, 26 September 2023
Foodwaste 2023 09 29.xlsx
(
file
)
42 KB
2
10:50, 26 September 2023
Figure0 v20230929.png
(
file
)
123 KB
1
10:44, 26 September 2023
Foodwaste 20230929.xlsx
(
file
)
43 KB
1
10:43, 26 September 2023
Table2 v20230929.PNG
(
file
)
27 KB
1
10:43, 26 September 2023
Table1 v20230929.PNG
(
file
)
63 KB
1
10:38, 26 September 2023
Figure2 v20230929.PNG
(
file
)
79 KB
1
10:37, 26 September 2023
Figure1 v20230929.PNG
(
file
)
38 KB
1
19:06, 10 March 2023
Foodwaste 20230310.xlsx
(
file
)
43 KB
1
19:01, 10 March 2023
Table2 v20230310.PNG
(
file
)
180 KB
1
18:57, 10 March 2023
Figure2 v20230310.PNG
(
file
)
253 KB
1
18:55, 10 March 2023
Table1 v20230310.PNG
(
file
)
512 KB
1
18:53, 10 March 2023
Figure1 v20230310.PNG
(
file
)
139 KB
1
18:49, 10 March 2023
1600px-Food waste Final202303.png
(
file
)
540 KB
1
11:58, 24 October 2022
Food waste Final.png
(
file
)
610 KB
1
11:36, 24 October 2022
Foodwaste 20221024.xlsx
(
file
)
42 KB
1
11:21, 24 October 2022
Table2 ESTAT FAO Comparison.PNG
(
file
)
160 KB
Reverted to version as of 11:00, 24 October 2022 (CEST)
12
22:17, 21 October 2022
Foodwaste 20221021.xlsx
(
file
)
42 KB
1
19:51, 21 October 2022
Table1 Tfreshmass.PNG
(
file
)
480 KB
4
19:28, 21 October 2022
FigureFoodWasteKGHAB 2020.PNG
(
file
)
257 KB
6
19:13, 21 October 2022
FigureEUAGG FW KGHAB 2020.PNG
(
file
)
153 KB
3
15:21, 1 March 2022
Waste electrical and electronic equipment 2022-02 RY2019.docx
(
file
)
57 KB
1
14:16, 1 March 2022
Waste electrical and electronic equipment 2022-02 RY2019.xlsx
(
file
)
57 KB
2
01:24, 10 July 2020
End-of-life vehicle statistics 2020-07.xlsx
(
file
)
52 KB
1
17:47, 26 February 2020
SE 2020 End-of-life vehicle statistics 2020-February rev 20200226.xlsx
(
file
)
52 KB
1
17:20, 26 February 2020
End-of-life vehicles 2008–2017 Targets 20200226.png
(
file
)
147 KB
The picture is extracted from the excel file and contains the targets as well. The picture is owned by Eurostat
1
14:30, 31 July 2019
WEEE for publication 2019-07-31.xlsx
(
file
)
80 KB
revised
1
14:27, 31 July 2019
Figure 6 WEEE collected in 2016 by source in relation to the average weight of EEE POM 2013-2015 kg-per-inhabitant.png
(
file
)
43 KB
title change
1
11:55, 31 July 2019
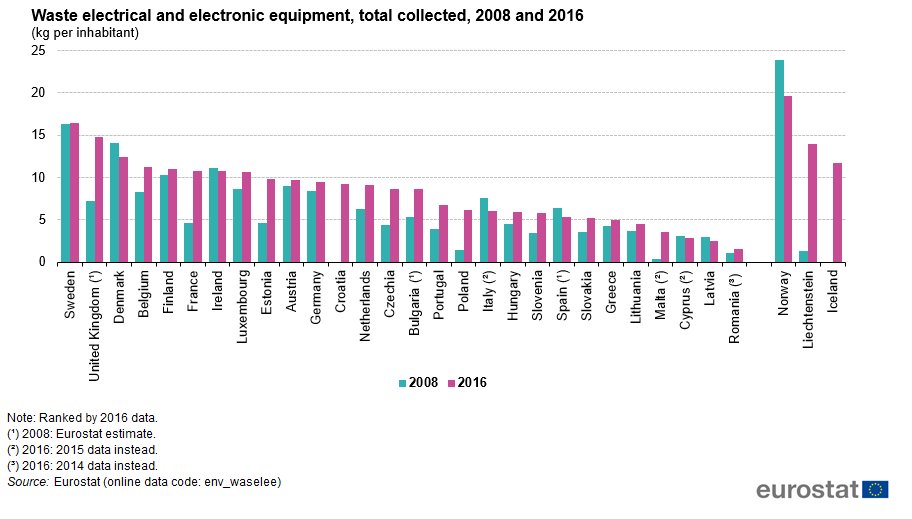
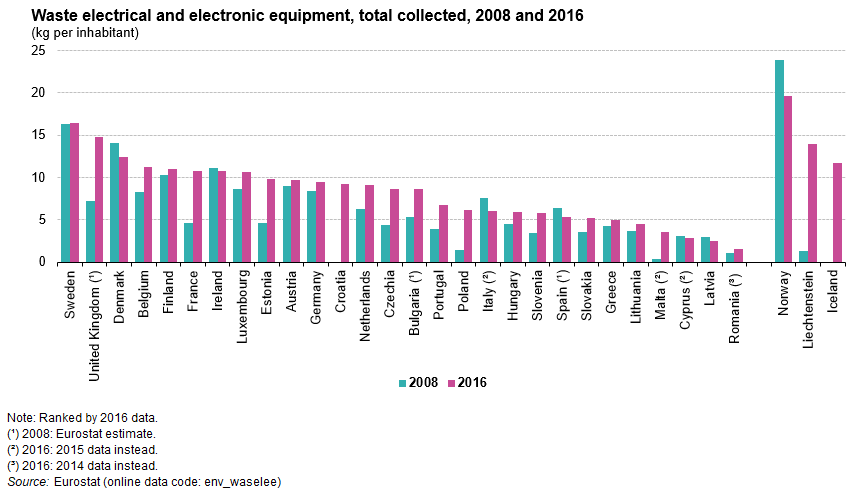
Figure 3-Waste electrical and electronic equipment total collected 2008 and 2016 kg per inhabitant.png
(
file
)
37 KB
Eurostat Logo
1
11:52, 31 July 2019
Figure 3 Waste electrical and electronic equipment total collected 2008 and 2016 kg per inhabitant.png
(
file
)
37 KB
Eurostat logo added
1
11:50, 31 July 2019
Figure3-Waste electrical and electronic equipment total collected 2008 and 2016 kg per inhabitant.png
(
file
)
37 KB
added eurostat logo
2
11:41, 31 July 2019
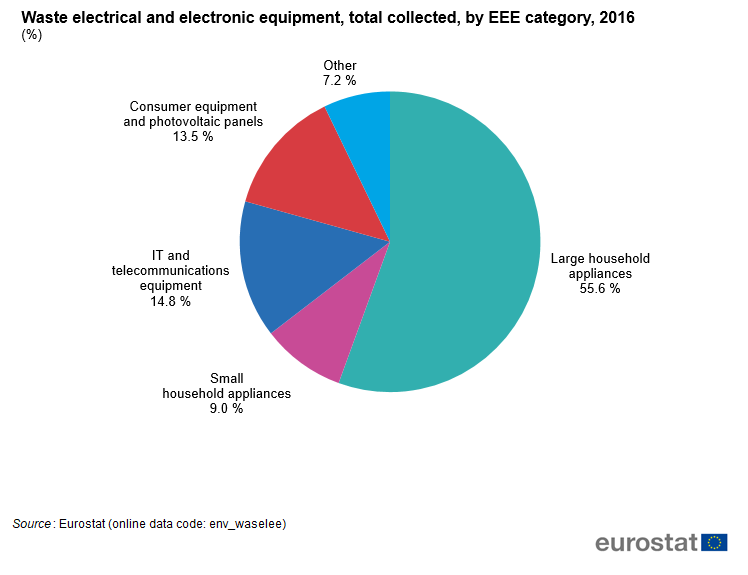
Figure 4 Waste electrical and electronic equipment total collected by EEE category 2016 percentage.png
(
file
)
30 KB
Correction of tonnes in percentage
1
17:20, 26 July 2019
SE 2019 End-of-life vehicle statistics 2019-07-26.xlsx
(
file
)
88 KB
Change in figure 1, ordered by year
1
17:11, 26 July 2019
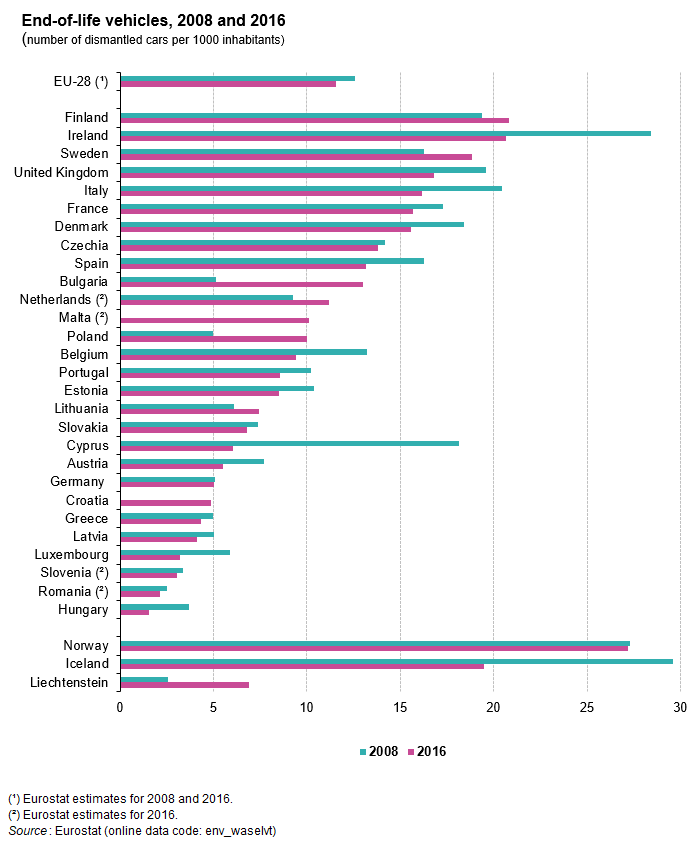
End-of-life vehicles 2008 and 2016 number of dismantled cars per 1000 inhabitants.png
(
file
)
37 KB
Ordered by year 2016
1
17:07, 26 July 2019
End-of-life vehicles, 2008 and 2016 (number of dismantled cars per 1000 inhabitants).png
(
file
)
37 KB
ordered by year 2016
3
14:07, 24 July 2019
Figure 3 Waste electrical and electronic equipment, total collected, 2008 and 2016 (kg per inhabitant).png
(
file
)
32 KB
(Talk | contribs) due to data updates there is a different order for Italy, Hungary and Slovenia
3
18:39, 26 November 2017
Half-yearly natural gas prices (EUR)S1Y2017.png
(
file
)
72 KB
1
18:30, 26 November 2017
Half-yearly natural gas prices (EUR).png
(
file
)
72 KB
2
11:47, 26 November 2017
Natural gas prices 2017s1.xlsx
(
file
)
207 KB
2
11:46, 26 November 2017
Electricity prices 2017s1.xlsx
(
file
)
142 KB
3
23:23, 25 November 2017
Percentage change in natural gas prices for non-household consumers, 2017s1-2016s1.png
(
file
)
35 KB
1
23:22, 25 November 2017
Evolution of EU-28 and EA natural gas prices for non-household consumers in EUR kWh.png
(
file
)
21 KB
1
23:21, 25 November 2017
Natural gas - share of taxes and levies paid by non-household consumers, 2017s1 (in %).png
(
file
)
26 KB
1
23:20, 25 November 2017
Natural gas prices for non-household consumers, 2017s1 (EUR kWh).png
(
file
)
37 KB
1
23:19, 25 November 2017
Percentage change in natural gas prices for household consumers, 2017s1-2016s1.png
(
file
)
37 KB
1
23:14, 25 November 2017
Evolution of EU-28 and EA natural gas prices for household consumers in EUR kWh.png
(
file
)
24 KB
3
23:11, 25 November 2017
Natural gas - share of taxes and levies paid by household consumers, 2017s1 (in %).png
(
file
)
20 KB
1
23:10, 25 November 2017
Natural gas prices for household consumers, 2017s1 (EUR kWh).png
(
file
)
25 KB
1
23:02, 25 November 2017
Half-yearly electricity prices (EUR).png
(
file
)
76 KB
2
23:00, 25 November 2017
Percentage change in electricity prices for non-household consumers, 2017s1-2016s1.png
(
file
)
47 KB
1
First page
Previous page
Next page
Last page
Special page
ISSN 2443-8219


.png)
.png)
S1Y2017.png)
.png)


.png)
.png)


.png)
.png)
.png)
