Tutorials
Log in
Statistics Explained
menu
search
search
Navigation
Main page
Statistical themes
Glossary
Categories
Statistics 4 beginners
Tutorials
Help
Eurostat home
Education corner
Online publications
Regional yearbook
Sustainable development
Full list
Tools
User contributions
Logs
View user groups
Special pages
search
Navigation
Main page
Statistical themes
Glossary
Categories
Statistics 4 beginners
Tutorials
Help
Eurostat home
Education corner
Online publications
Regional yearbook
Sustainable development
Full list
Tools
User contributions
Logs
View user groups
Special pages
Navigation
Main page
Statistical themes
Glossary
Categories
Statistics 4 beginners
Tutorials
Help
Eurostat home
Education corner
Online publications
Regional yearbook
Sustainable development
Full list
Tools
User contributions
Logs
View user groups
Special pages
Uploads by Gambigo
This special page shows all uploaded files.
File list
Items per page:
20
50
100
250
500
Search for media name:
Username:
Include old versions of files
Go
First page
Previous page
Next page
Last page
Date
Name
Thumbnail
Size
Description
Versions
12:09, 31 May 2024
Pension expenditure and beneficiaries SPS2024 rev 2.xlsx
(
file
)
688 KB
1
15:48, 27 May 2024
Pension expenditure and beneficiaries SPS2024 rev.xlsx
(
file
)
688 KB
1
15:44, 27 May 2024
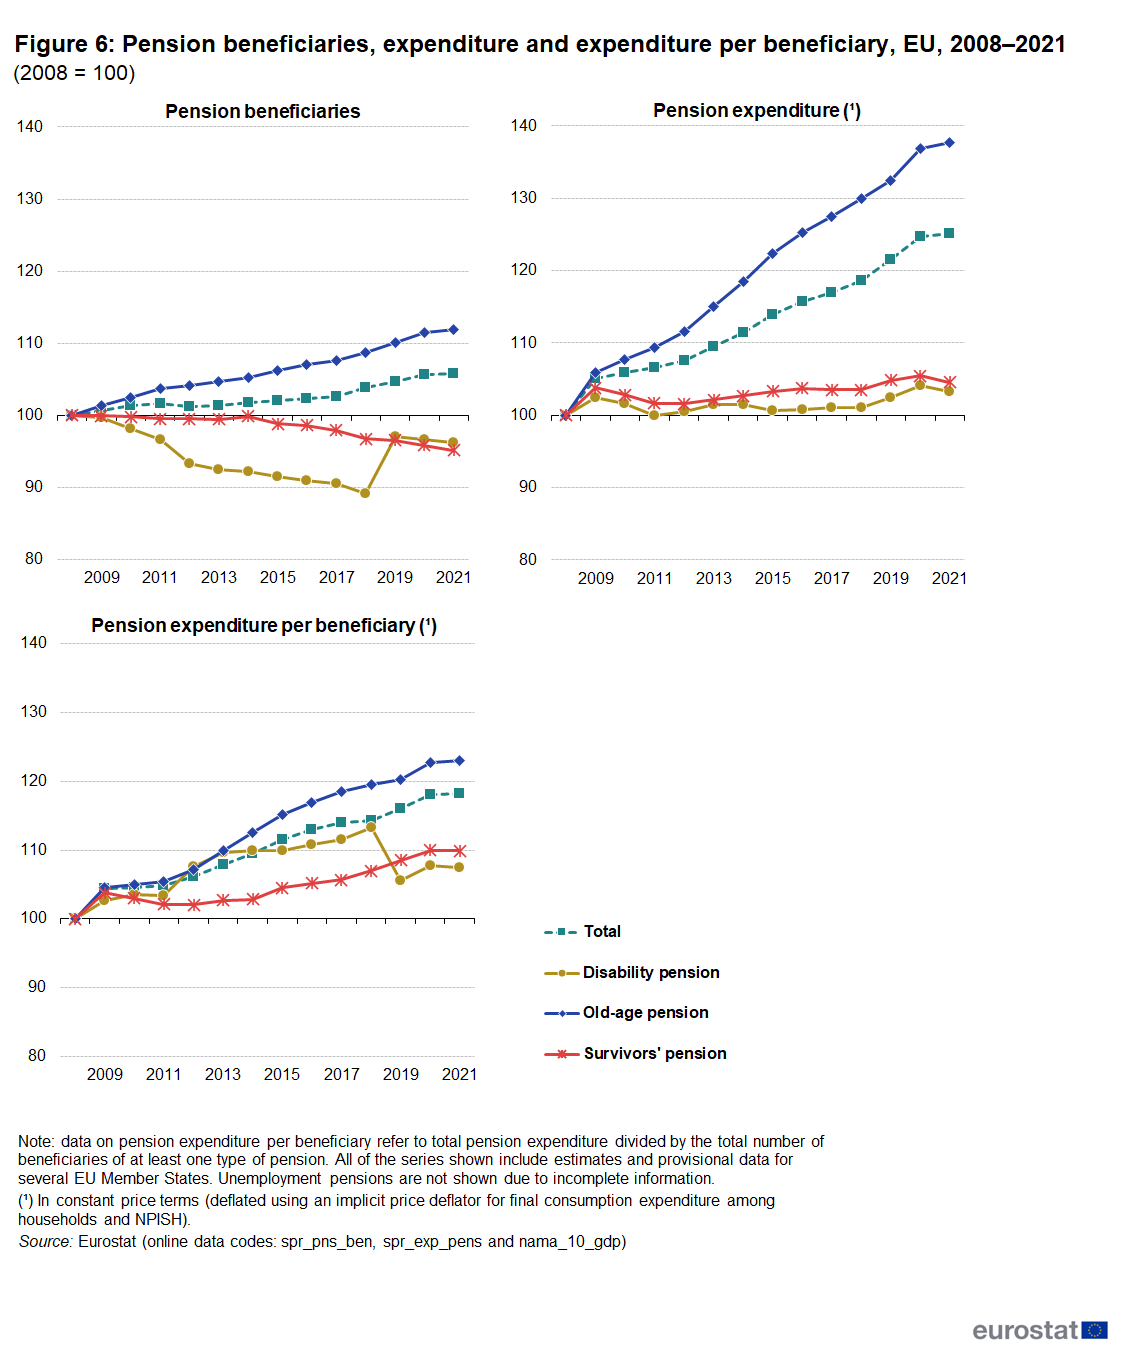
Pension beneficiaries, expenditure and expenditure per beneficiary, EU, 2008–2021 (2008 = 100) SPS2024.png
(
file
)
83 KB
2
15:27, 27 May 2024
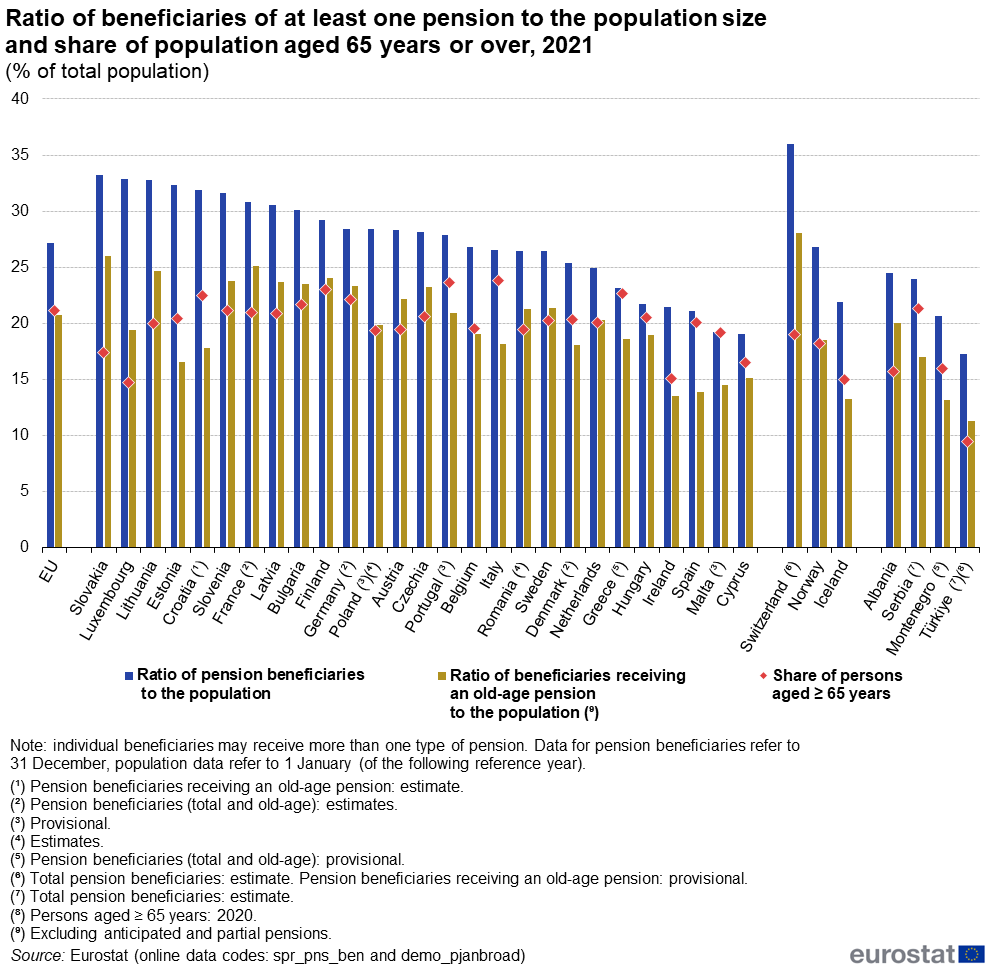
Ratio of beneficiaries of at least one pension to the population size and share of population aged 65 years or over, 2021 (% of total population) SPS2024.png
(
file
)
126 KB
2
15:43, 28 November 2023
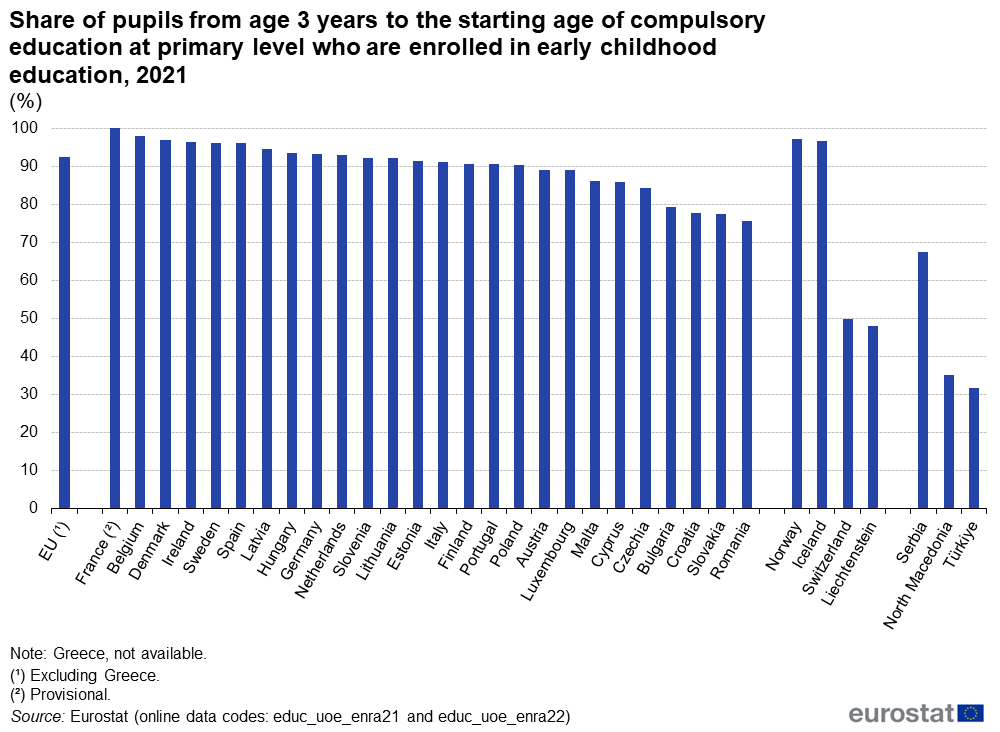
Share of pupils from age 3 years to the starting age of compulsory education at primary level who are enrolled in early childhood education, 2021 (%).png
(
file
)
84 KB
1
12:54, 13 November 2023
Social benefits 2021 13112023.xlsx
(
file
)
81 KB
1
12:17, 13 November 2023
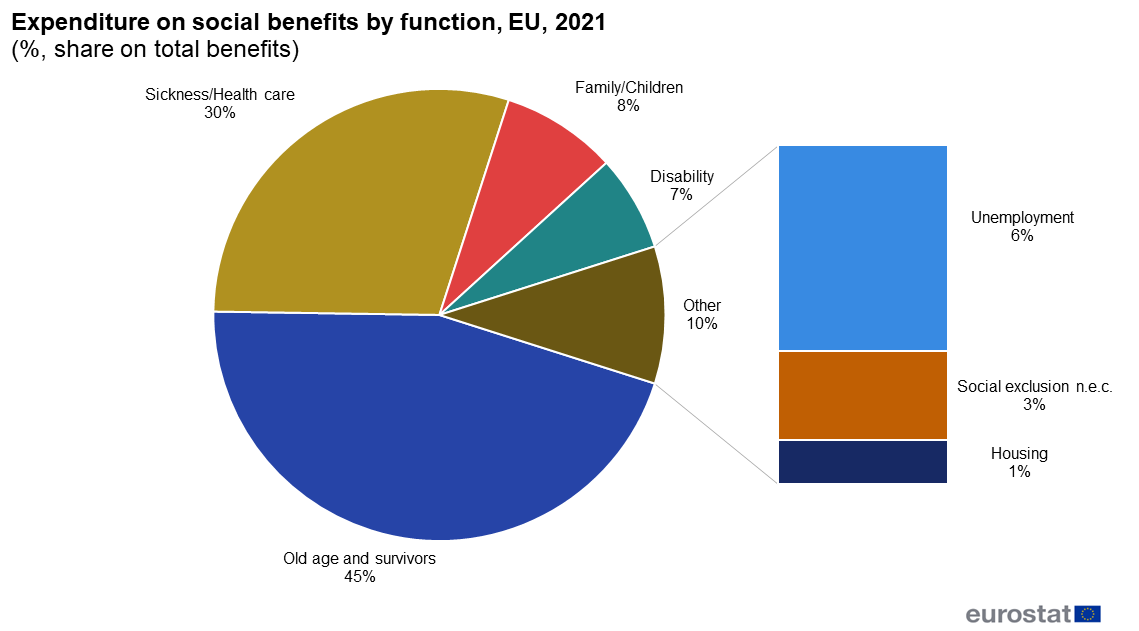
Expenditure on social benefits by function, EU, 2021 (share on total benefits, %).png
(
file
)
40 KB
2
11:16, 13 November 2023
Expenditure on social protection benefits, 2011 and 2021 (%, relative to GDP).png
(
file
)
88 KB
1
12:32, 3 November 2023
Social benefits 2021 final.xlsx
(
file
)
60 KB
1
17:17, 31 October 2023
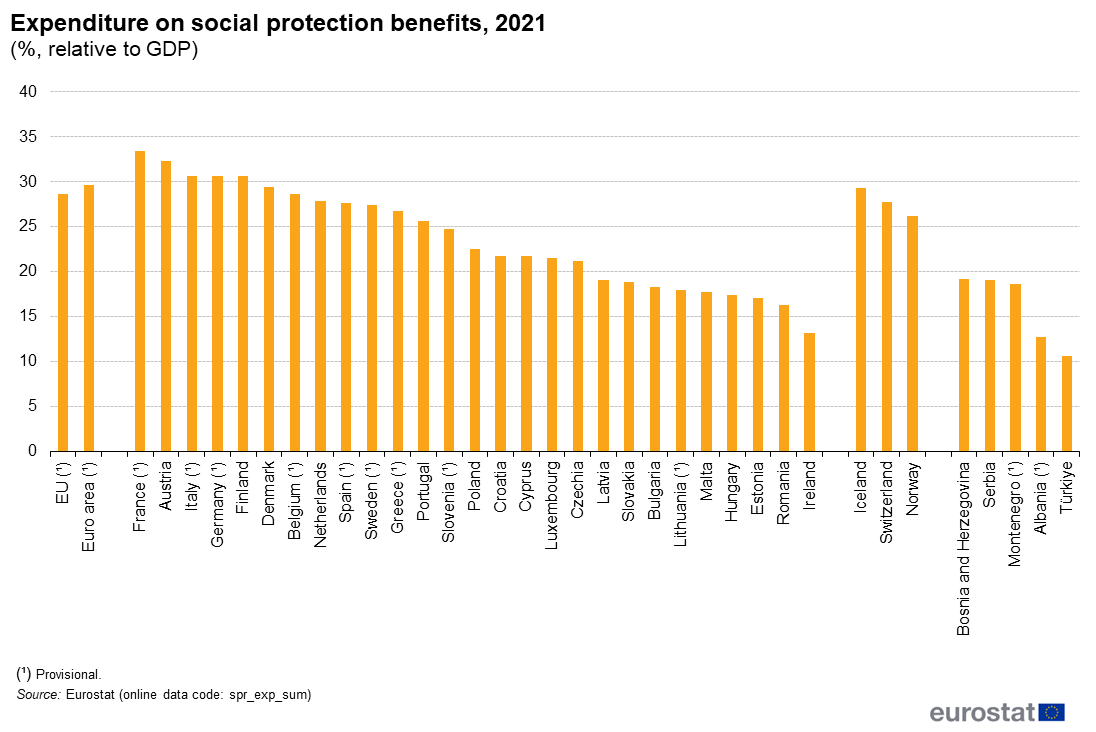
Expenditure on social protection benefits, 2021 (%, relative to GDP).png
(
file
)
55 KB
1
17:16, 31 October 2023
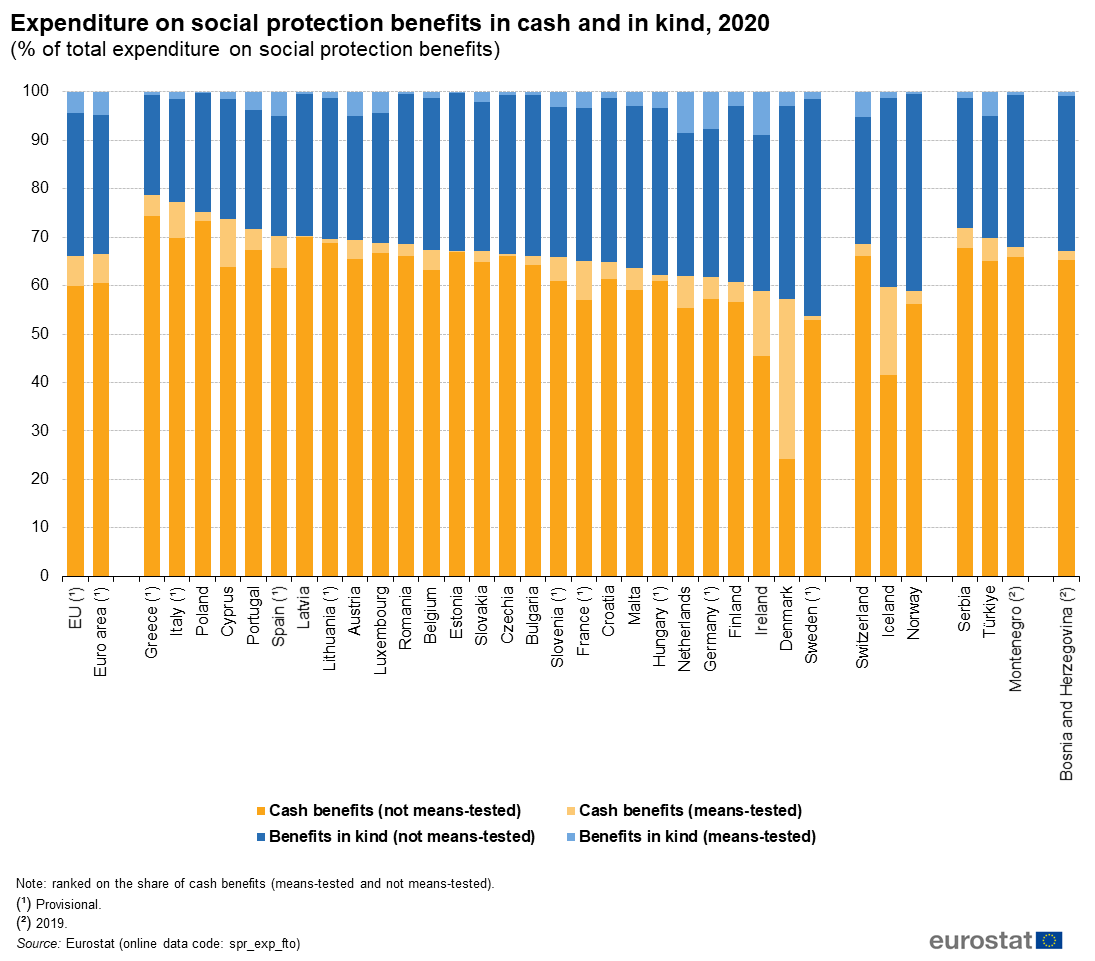
Expenditure on social protection benefits in cash and in kind, 2021 (% of total expenditure on social protection benefits).png
(
file
)
98 KB
1
17:15, 31 October 2023
Expenditure on social protection benefits by function, 2021.png
(
file
)
86 KB
1
17:15, 31 October 2023
Expenditure on means-tested social protection benefits, 2021 (% of total expenditure on social protection benefits).png
(
file
)
43 KB
1
17:14, 31 October 2023
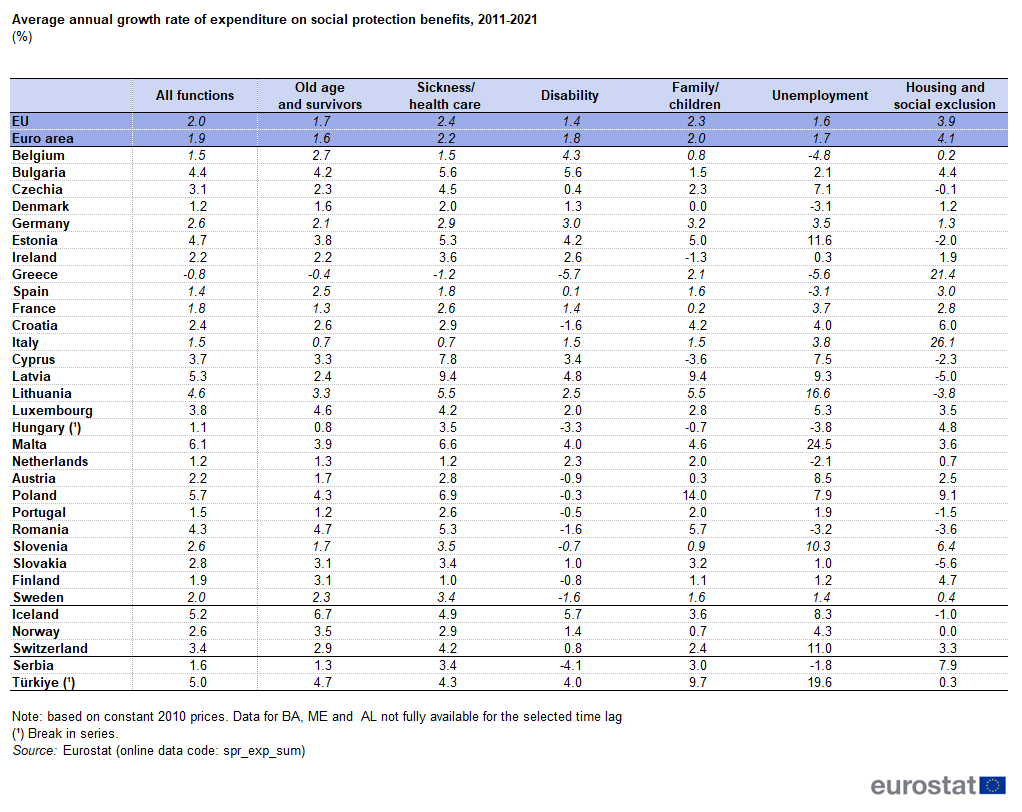
Average annual growth rate of expenditure on social protection benefits, 2011-2021 (%).png
(
file
)
57 KB
1
10:31, 31 March 2023
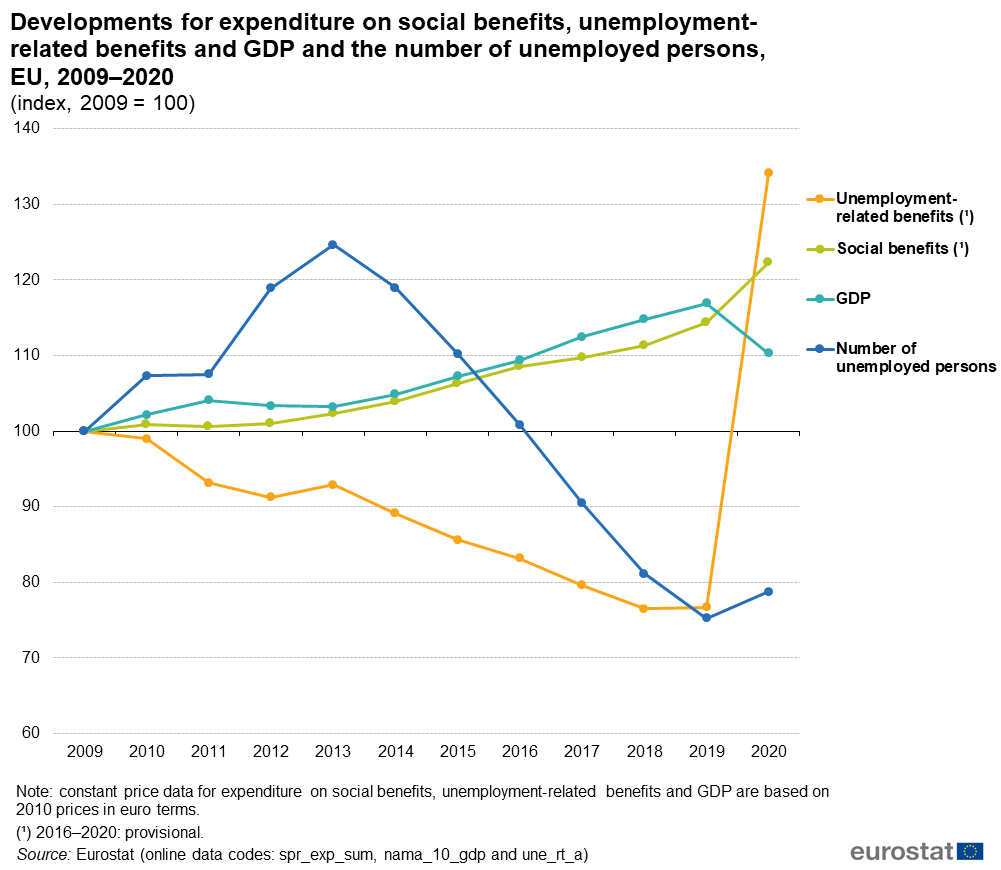
Developments for expenditure on social benefits, unemployment-related benefits and GDP and the number of unemployed persons, EU, 2009–2020 (index, 2009 = 100) SPS2023.png
(
file
)
78 KB
2
17:06, 7 November 2022
Social benefits 2020 041122.xlsx
(
file
)
58 KB
2
16:49, 7 November 2022
Expenditure on social protection benefits in cash and in kind, 2020 (% of total expenditure on social protection benefits).png
(
file
)
143 KB
2
16:48, 7 November 2022
Average annual growth rate of expenditure on social protection benefits, 2010-2020 (%).png
(
file
)
71 KB
2
12:23, 4 November 2022
Expenditure on social protection benefits by function, 2020.png
(
file
)
108 KB
null
1
12:23, 4 November 2022
Expenditure on means-tested social protection benefits, 2020 (% of total expenditure on social protection benefits).png
(
file
)
64 KB
null
1
13:09, 9 November 2021
Social benefits 2019 091121 .xlsx
(
file
)
58 KB
1
13:01, 9 November 2021
Expenditure on means-tested social protection benefits, 2019 (% of total expenditure on social protection benefits).png
(
file
)
63 KB
2
13:00, 9 November 2021
Expenditure on social protection benefits in cash and in kind, 2019 (% of total expenditure on social protection benefits).png
(
file
)
144 KB
2
12:59, 9 November 2021
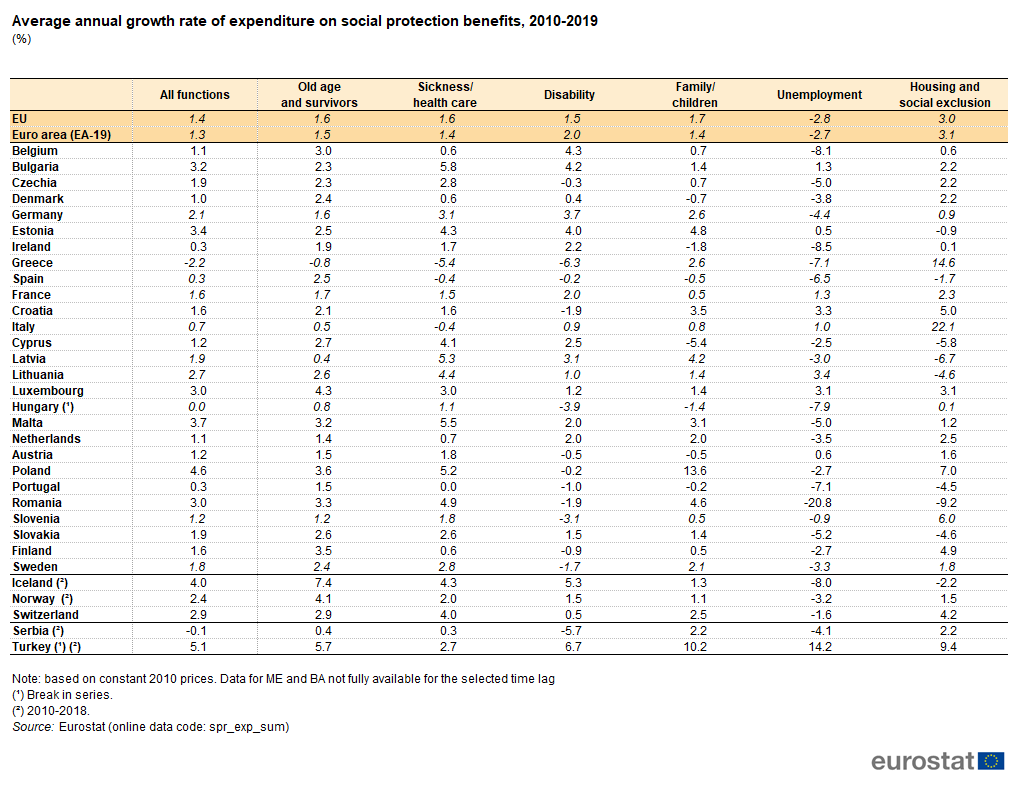
Average annual growth rate of expenditure on social protection benefits, 2010-2019 (%).png
(
file
)
73 KB
2
12:57, 9 November 2021
Expenditure on social protection benefits, 2019 (%, relative to GDP).png
(
file
)
76 KB
2
12:55, 9 November 2021
Expenditure on social protection benefits by function, 2019.png
(
file
)
109 KB
2
11:34, 5 November 2021
Social benefits 2019 041121 .xlsx
(
file
)
58 KB
1
15:19, 24 August 2021
Social protection statistics - disability-related benefits FP2020 quar.xlsx
(
file
)
139 KB
2
16:39, 10 May 2021
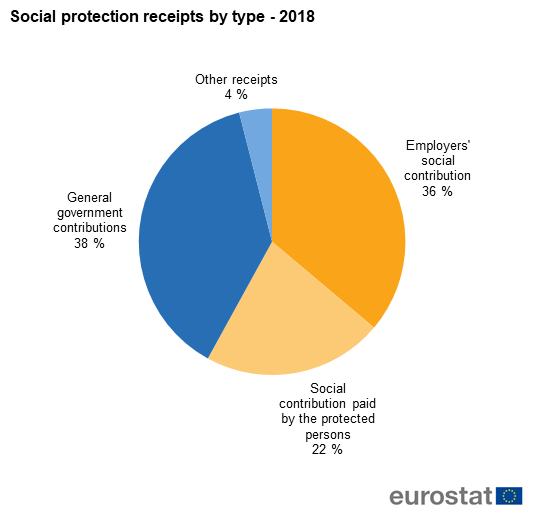
Social protection receipts by type,2018.png
(
file
)
26 KB
2
12:29, 23 April 2021
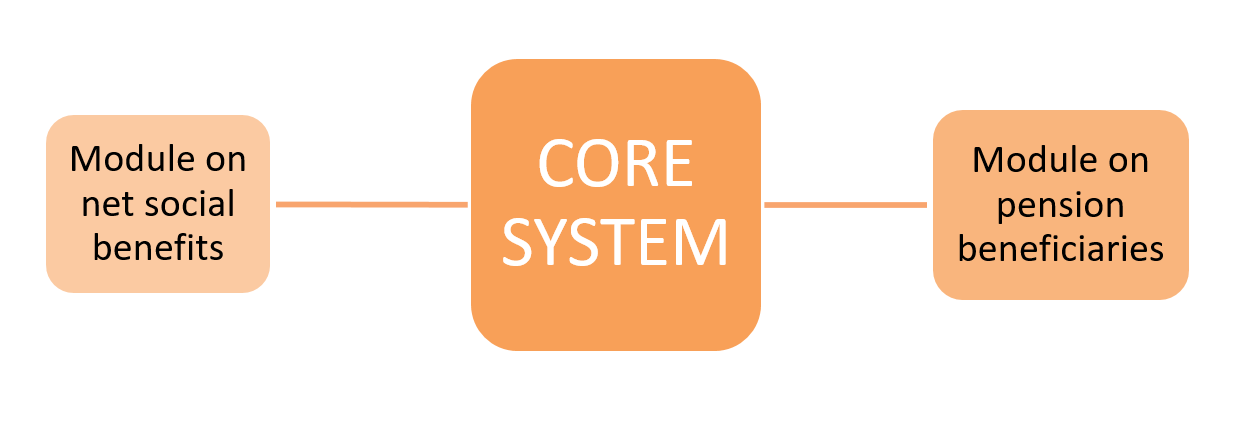
Structure of ESSPROS.PNG
(
file
)
24 KB
2
11:57, 21 April 2021
Structure of social protection expenditure in the EU in 2018.png
(
file
)
53 KB
1
11:54, 30 November 2020
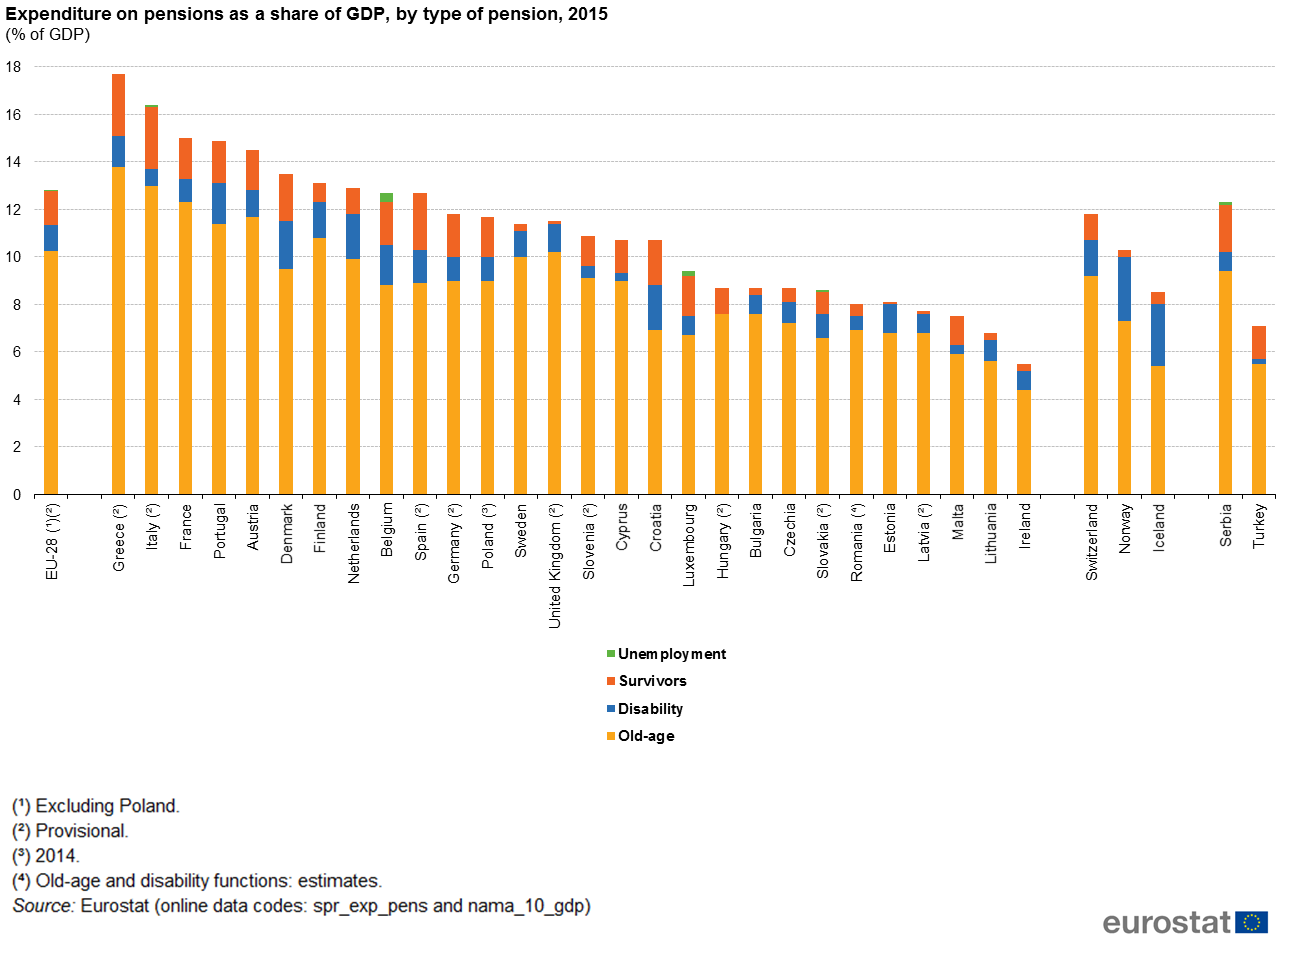
Expenditure on pensions as a share of GDP, by type of pension, 2015 (% of GDP) SP18.png
(
file
)
139 KB
Reverted to version as of 12:51, 27 November 2018
3
11:45, 29 September 2020
Social protection statistics - disability-related benefits FP2020 ter.xlsx
(
file
)
134 KB
2
11:28, 29 September 2020
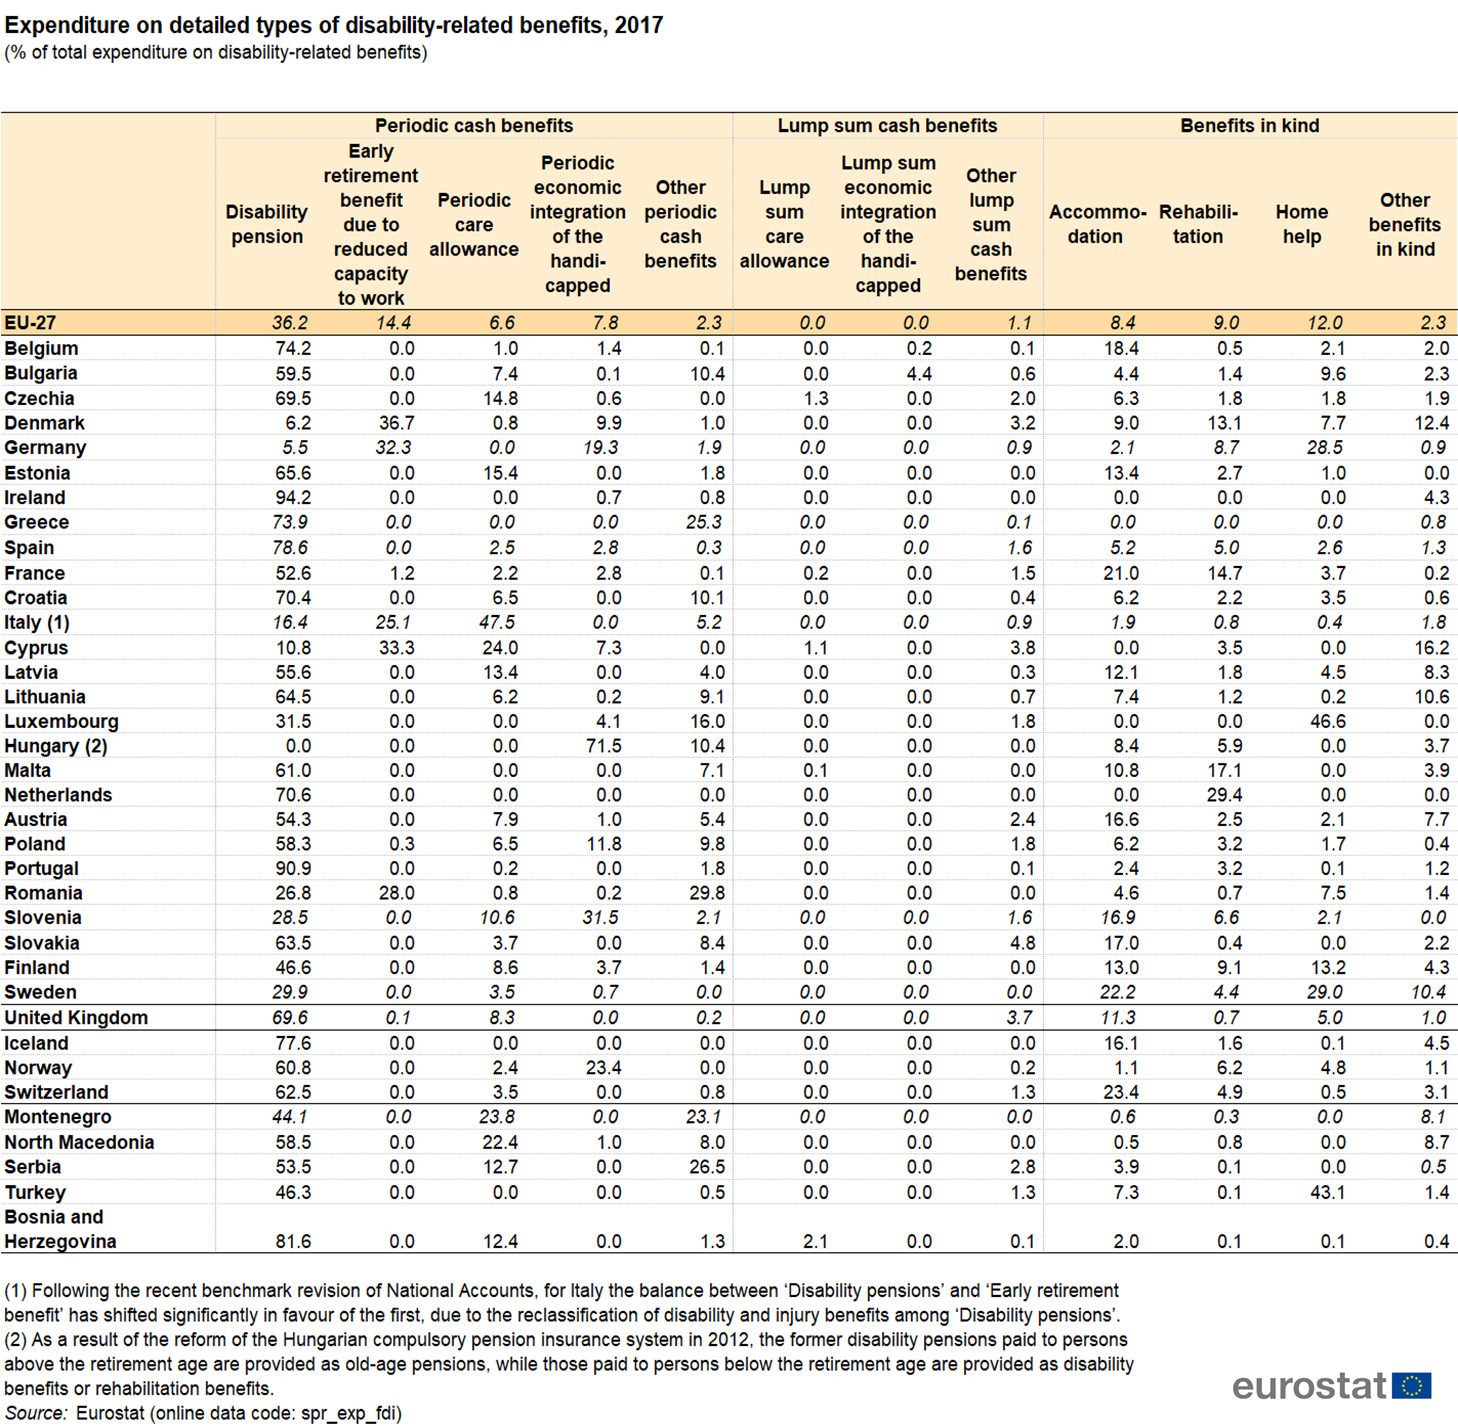
Expenditure on detailed types of disability-related benefits, 2017 (% of total expenditure on disability-related benefits) FP20.png
(
file
)
960 KB
5
10:50, 29 September 2020
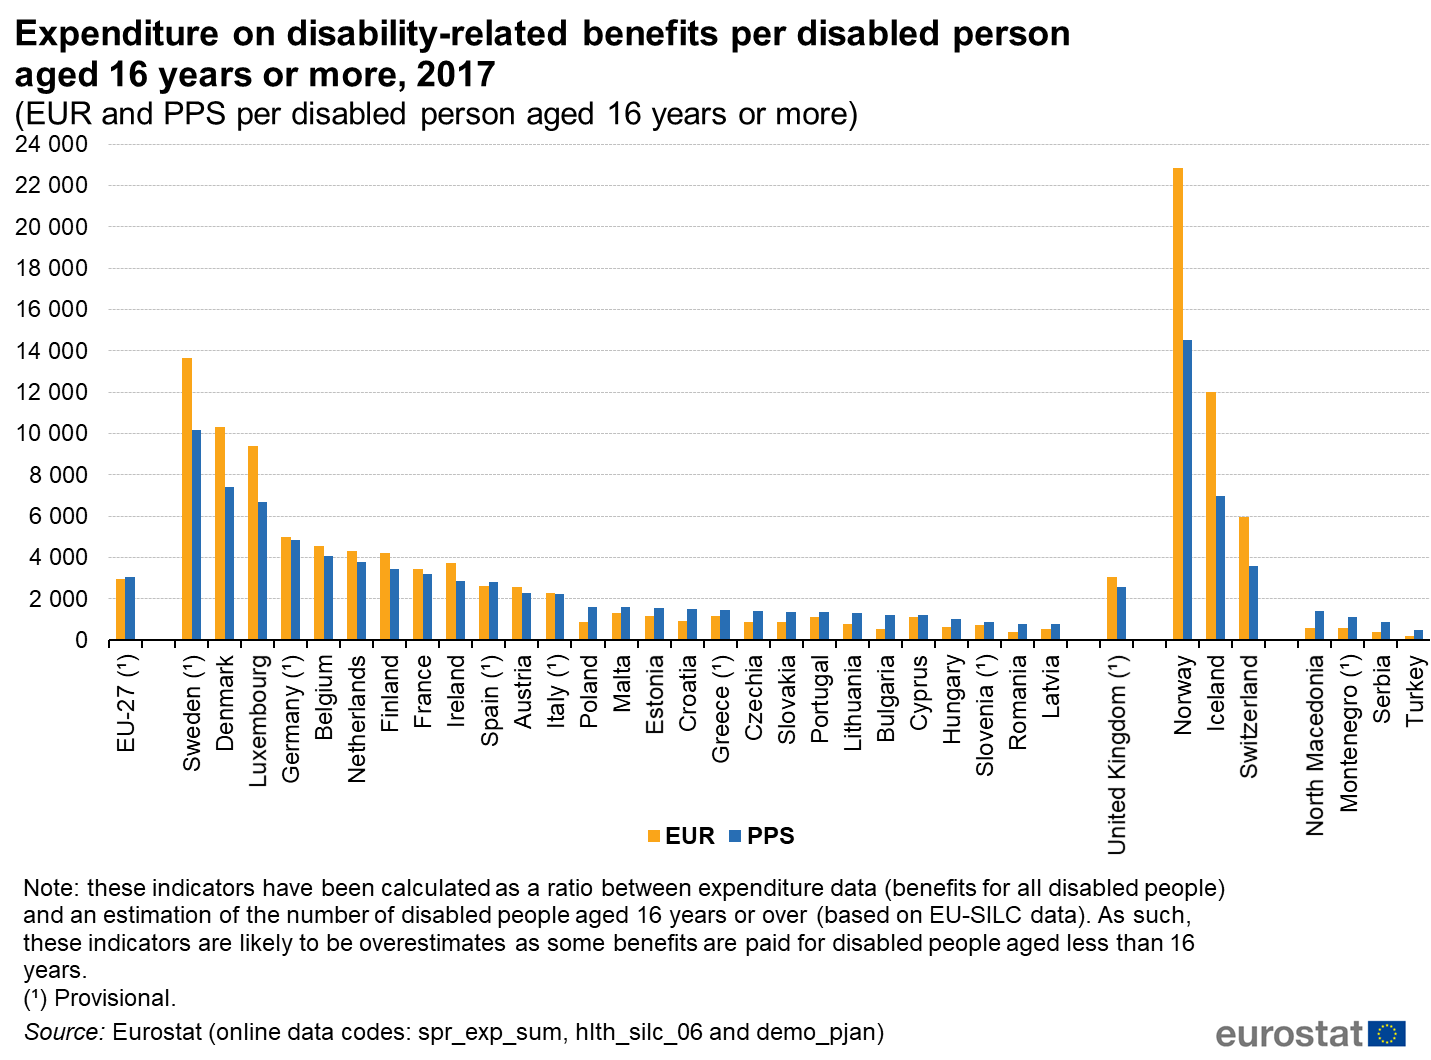
Expenditure on disability-related benefits per disabled person aged 16 years or more, 2017 (EUR and PPS per disabled person aged 16 years or more) FP20.png
(
file
)
156 KB
3
12:08, 31 July 2020
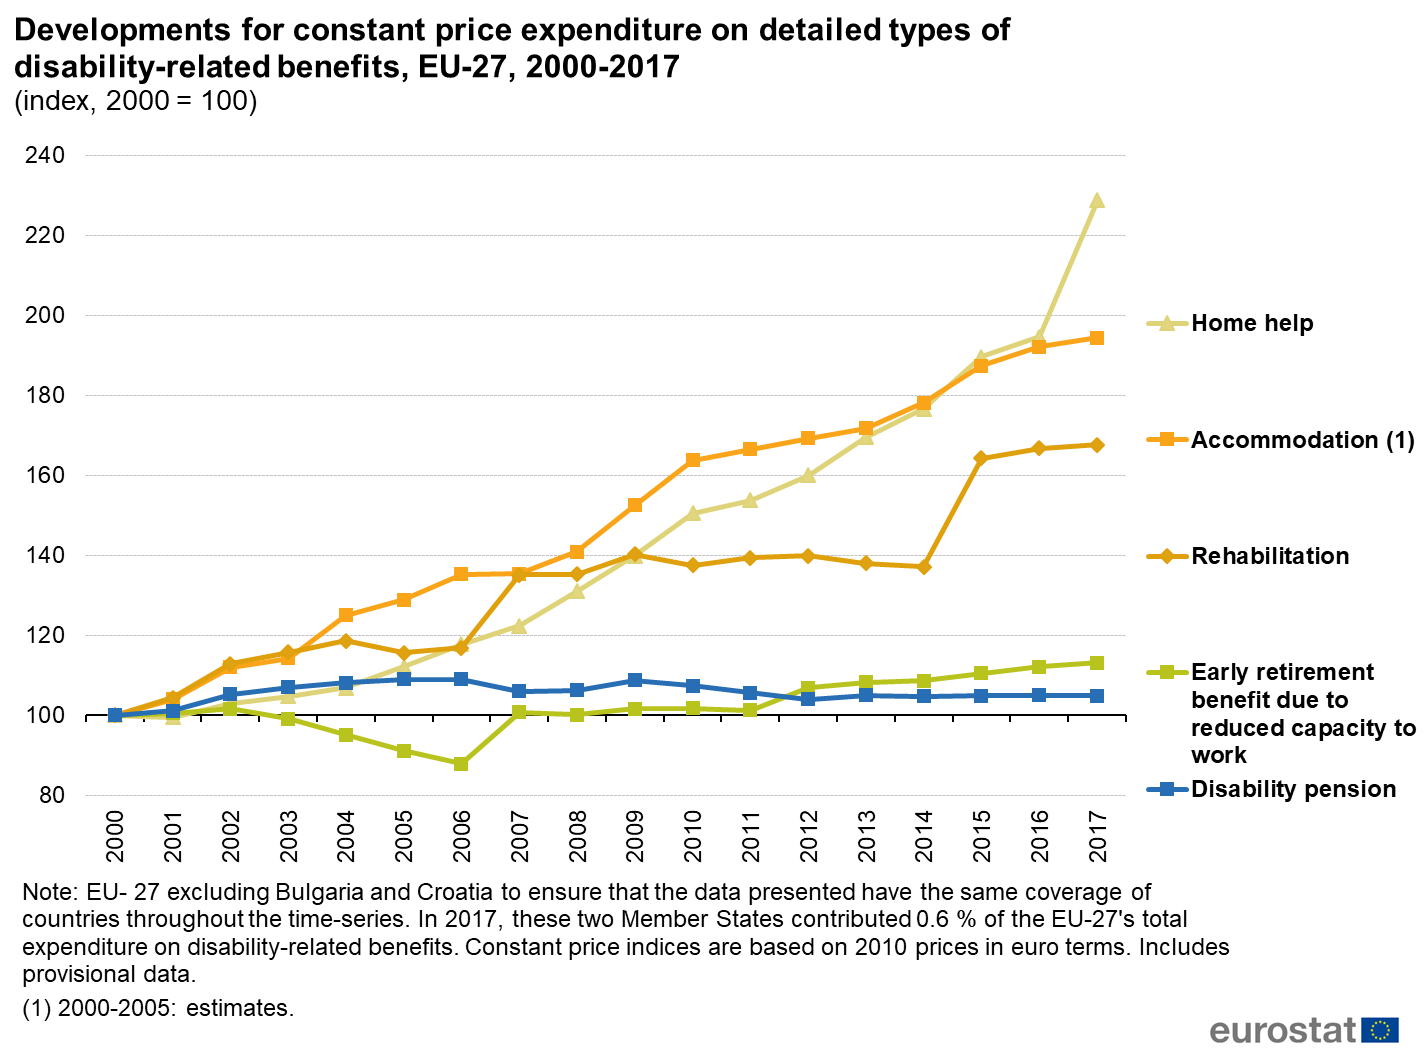
Developments for constant price expenditure on detailed types of disability-related benefits, EU-27, 2000-2017 (index, 2000 = 100) FP20.png
(
file
)
129 KB
2
12:07, 31 July 2020
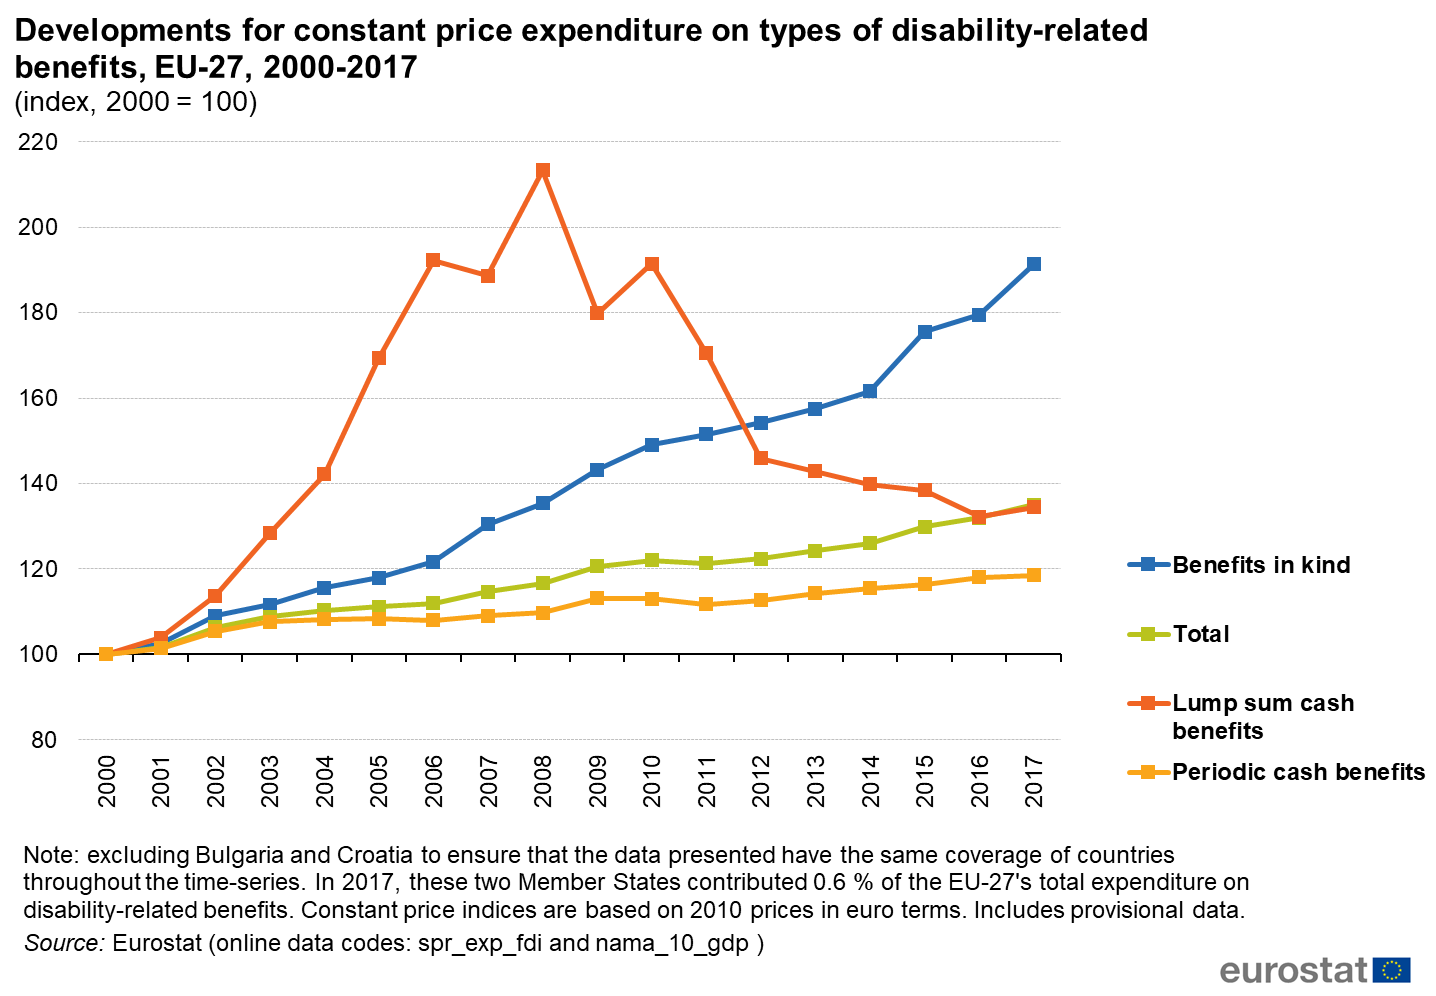
Developments for constant price expenditure on types of disability-related benefits, EU-27, 2000-2017 (index, 2000 = 100) FP20.png
(
file
)
116 KB
2
12:00, 31 July 2020
Developments for constant price GDP and expenditure on benefits, EU-27, 2000-2017 (index, 2000=100) FP20.png
(
file
)
105 KB
2
15:45, 17 July 2020
Social protection statistics - disability-related benefits FP2020 bis.xlsx
(
file
)
155 KB
1
10:13, 27 May 2020
Social protection statistics - family and children benefits-FP2020 v2.xlsx
(
file
)
106 KB
1
10:07, 27 May 2020
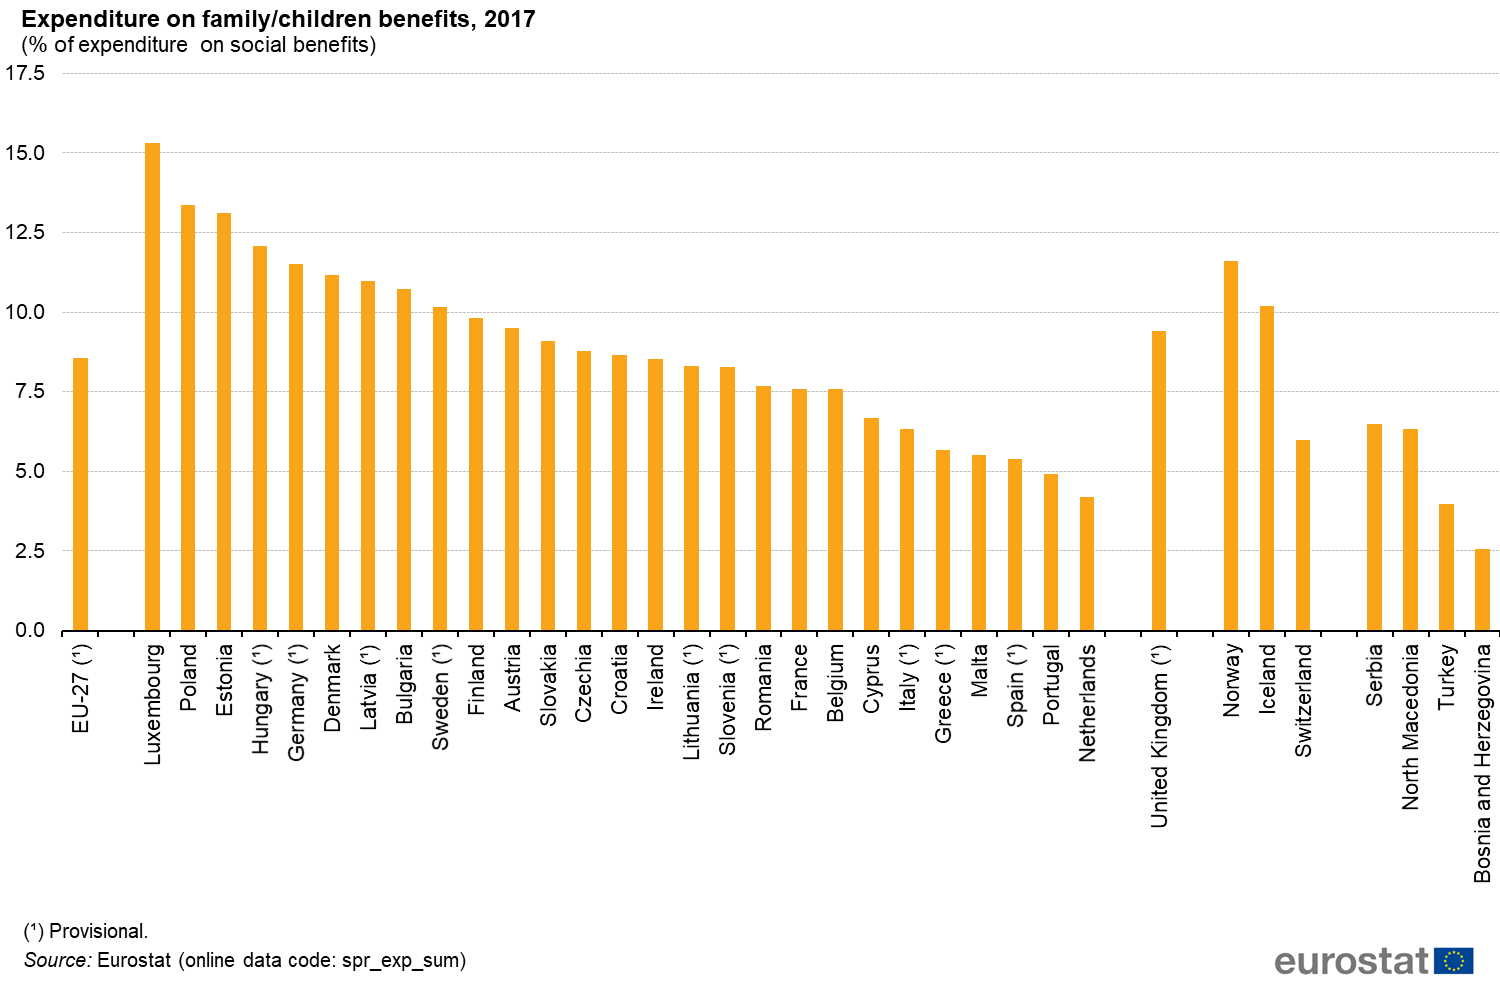
Expenditure on family children benefits, 2017 (% of expenditure on social benefits) FP20.png
(
file
)
131 KB
2
17:54, 21 February 2020
Social protection statistics - unemployment benefits-FP2020.xlsx
(
file
)
141 KB
4
17:52, 21 February 2020
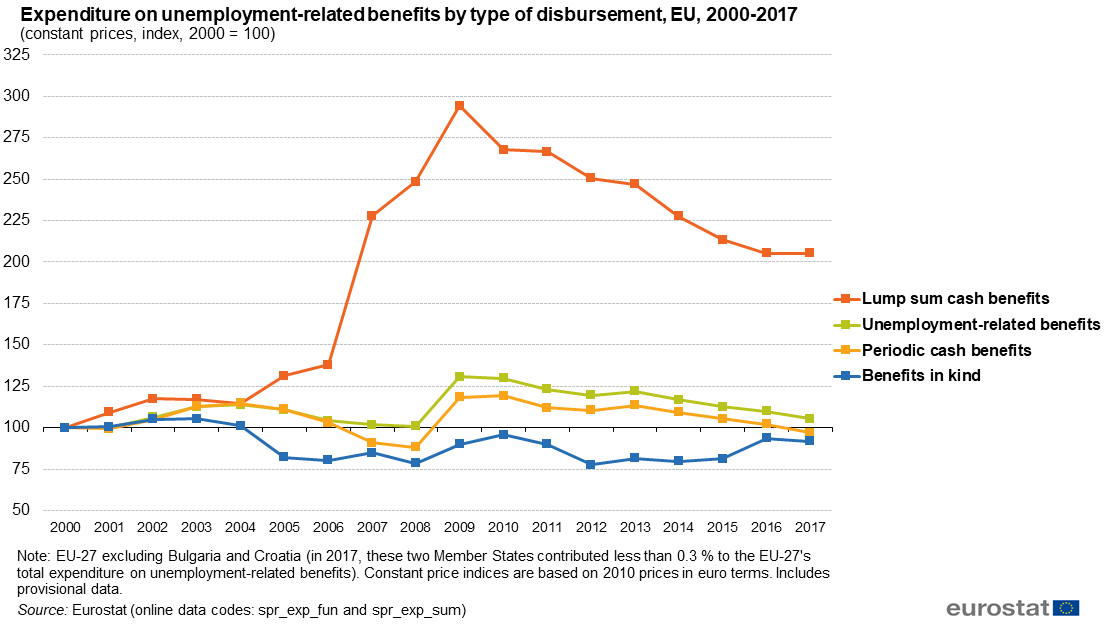
Expenditure on unemployment-related benefits by type of disbursement, EU, 2000-2017 (index, 2000 = 100) FP20.png
(
file
)
64 KB
3
16:58, 13 January 2020
Social protection statistics 2016.xlsx
(
file
)
185 KB
2
18:19, 8 January 2020
Expenditure on pensions, 2016 (% of GDP).png
(
file
)
73 KB
Previous shares were related to 2015 instead of 2016
2
16:09, 8 January 2020
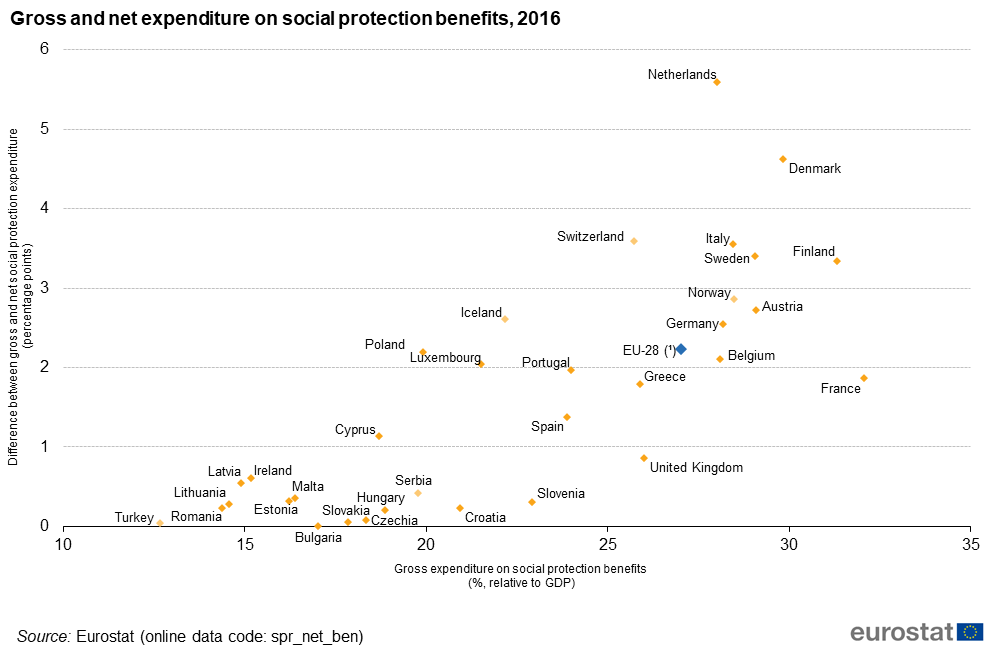
Gross and net expenditure on social protection benefits, 2016 (% of GDP).png
(
file
)
84 KB
1
16:09, 8 January 2020
Gross and net expenditure on social protection benefits, 2016.png
(
file
)
43 KB
1
16:09, 8 January 2020
Expenditure on care for the elderly, 2016 (% of GDP).png
(
file
)
56 KB
1
16:09, 8 January 2020
Aggregate replacement ratio, 2018 (%).png
(
file
)
70 KB
1
16:09, 8 January 2020
Social protection receipts, 2016 (% of total receipts).png
(
file
)
95 KB
1
First page
Previous page
Next page
Last page
Special page
ISSN 2443-8219
_SPS2024.png)
_SPS2024.png)
.png)
.png)
.png)
.png)
.png)

.png)
.png)
_SPS2023.png)
.png)
.png)

.png)
.png)
.png)
.png)
.png)


_SP18.png)
_FP20.png)
_FP20.png)
_FP20.png)
_FP20.png)
_FP20.png)
_FP20.png)
_FP20.png)
.png)
.png)

.png)
.png)
.png)