Tutorials
Log in
Statistics Explained
menu
search
search
Navigation
Main page
Statistical themes
Glossary
Categories
Statistics 4 beginners
Tutorials
Help
Eurostat home
Education corner
Online publications
Regional yearbook
Sustainable development
Full list
Tools
User contributions
Logs
View user groups
Special pages
search
Navigation
Main page
Statistical themes
Glossary
Categories
Statistics 4 beginners
Tutorials
Help
Eurostat home
Education corner
Online publications
Regional yearbook
Sustainable development
Full list
Tools
User contributions
Logs
View user groups
Special pages
Navigation
Main page
Statistical themes
Glossary
Categories
Statistics 4 beginners
Tutorials
Help
Eurostat home
Education corner
Online publications
Regional yearbook
Sustainable development
Full list
Tools
User contributions
Logs
View user groups
Special pages
Uploads by Challva
This special page shows all uploaded files.
File list
Items per page:
20
50
100
250
500
Search for media name:
Username:
Include old versions of files
Go
First page
Previous page
Next page
Last page
Date
Name
Thumbnail
Size
Description
Versions
12:40, 10 July 2024
Population and population change statistics YB2024.xlsx
(
file
)
91 KB
1
09:33, 10 July 2024
Population and population change statistics 10-07-24.xlsx
(
file
)
16 KB
1
08:29, 9 July 2024
Housing price statistics - owner-occupied housing price index Q1-2024.xlsx
(
file
)
18 KB
1
10:37, 5 July 2024
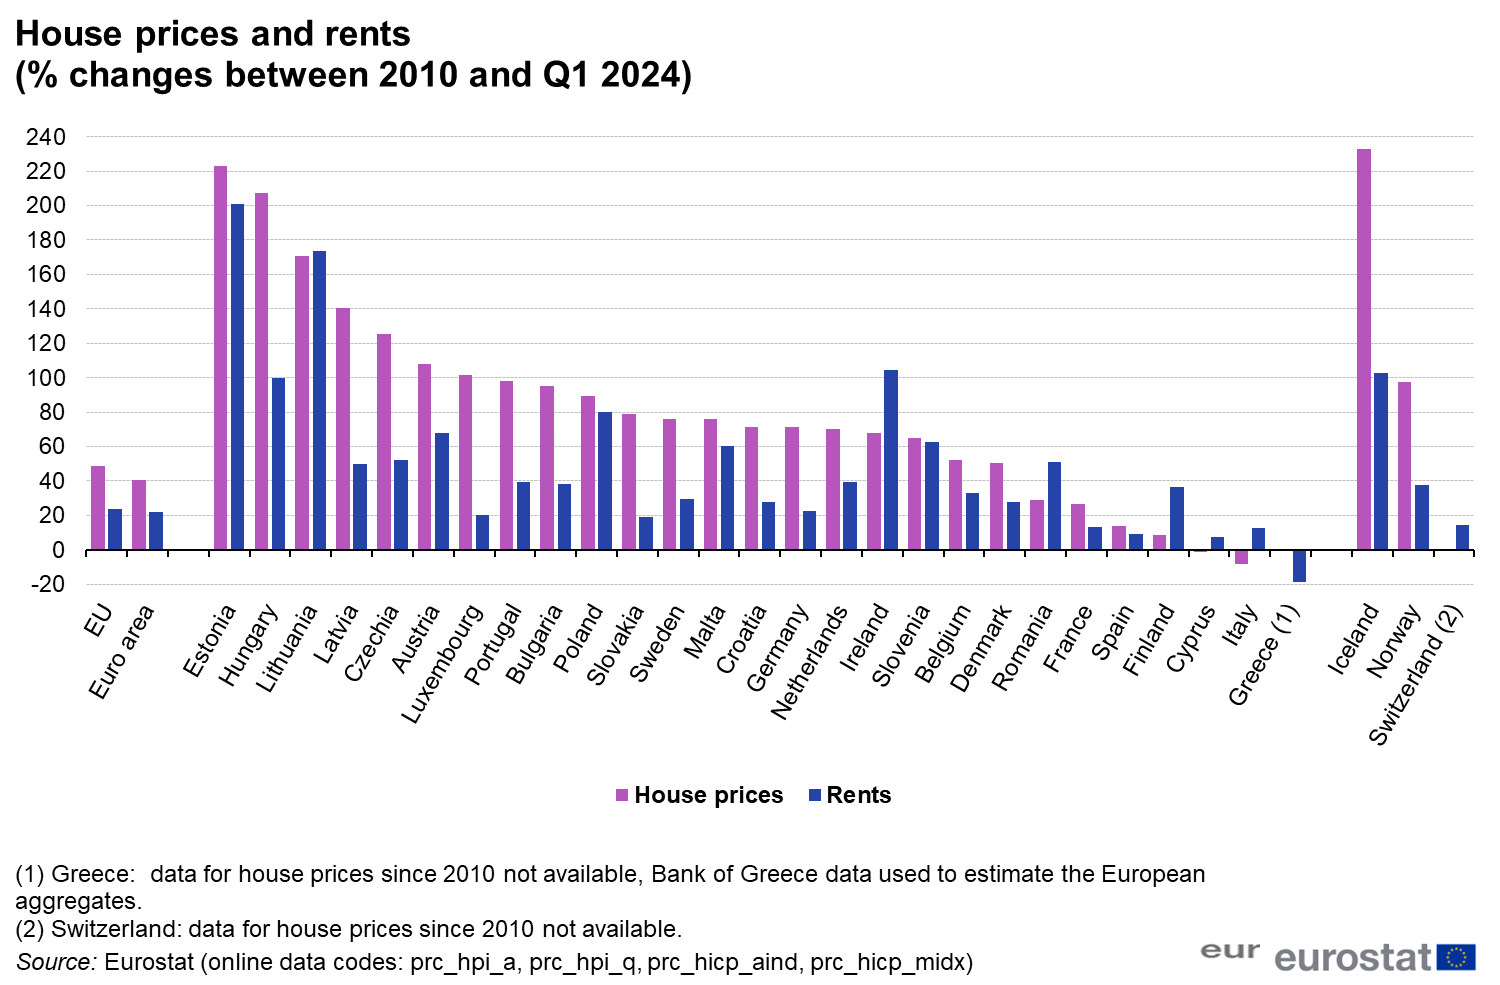
House prices and rents Fig 7.png
(
file
)
114 KB
1
10:11, 2 July 2024
Market-share-largest-electricity-companies-2022 (002).png
(
file
)
88 KB
1
08:59, 2 July 2024
Internal tourism consumption (TSA Table 4) (million EUR)V1.png
(
file
)
974 KB
1
15:11, 27 June 2024
Interactive graph EIL results Q1 2024 V1.xlsx
(
file
)
15 KB
1
14:40, 26 June 2024
Import tariffs by processing stage world average 2002-2021.xlsx
(
file
)
16 KB
1
16:06, 21 June 2024
Electricity market indicators 24 06 24V2.xlsx
(
file
)
15 KB
1
11:28, 21 June 2024
Electricity market indicators 24 06 24V1.xlsx
(
file
)
15 KB
1
11:26, 21 June 2024
Electricty market indicators 24 06 24.xlsx
(
file
)
15 KB
1
11:24, 21 June 2024
Electricty market indicators 24 06 2024V4.xlsx
(
file
)
15 KB
1
11:22, 21 June 2024
Electricty market indicators 24 06 2024V2.xlsx
(
file
)
14 KB
1
11:20, 21 June 2024
Electricty market indicators 24 06 2024V1.xlsx
(
file
)
14 KB
1
11:12, 21 June 2024
Electricty market indicators 24 06 2024.xlsx
(
file
)
15 KB
1
09:25, 19 June 2024
Table 1Number of generating companies representing at least 95% of the national net electricity generation, 2013-2022.png
(
file
)
553 KB
1
07:56, 19 June 2024
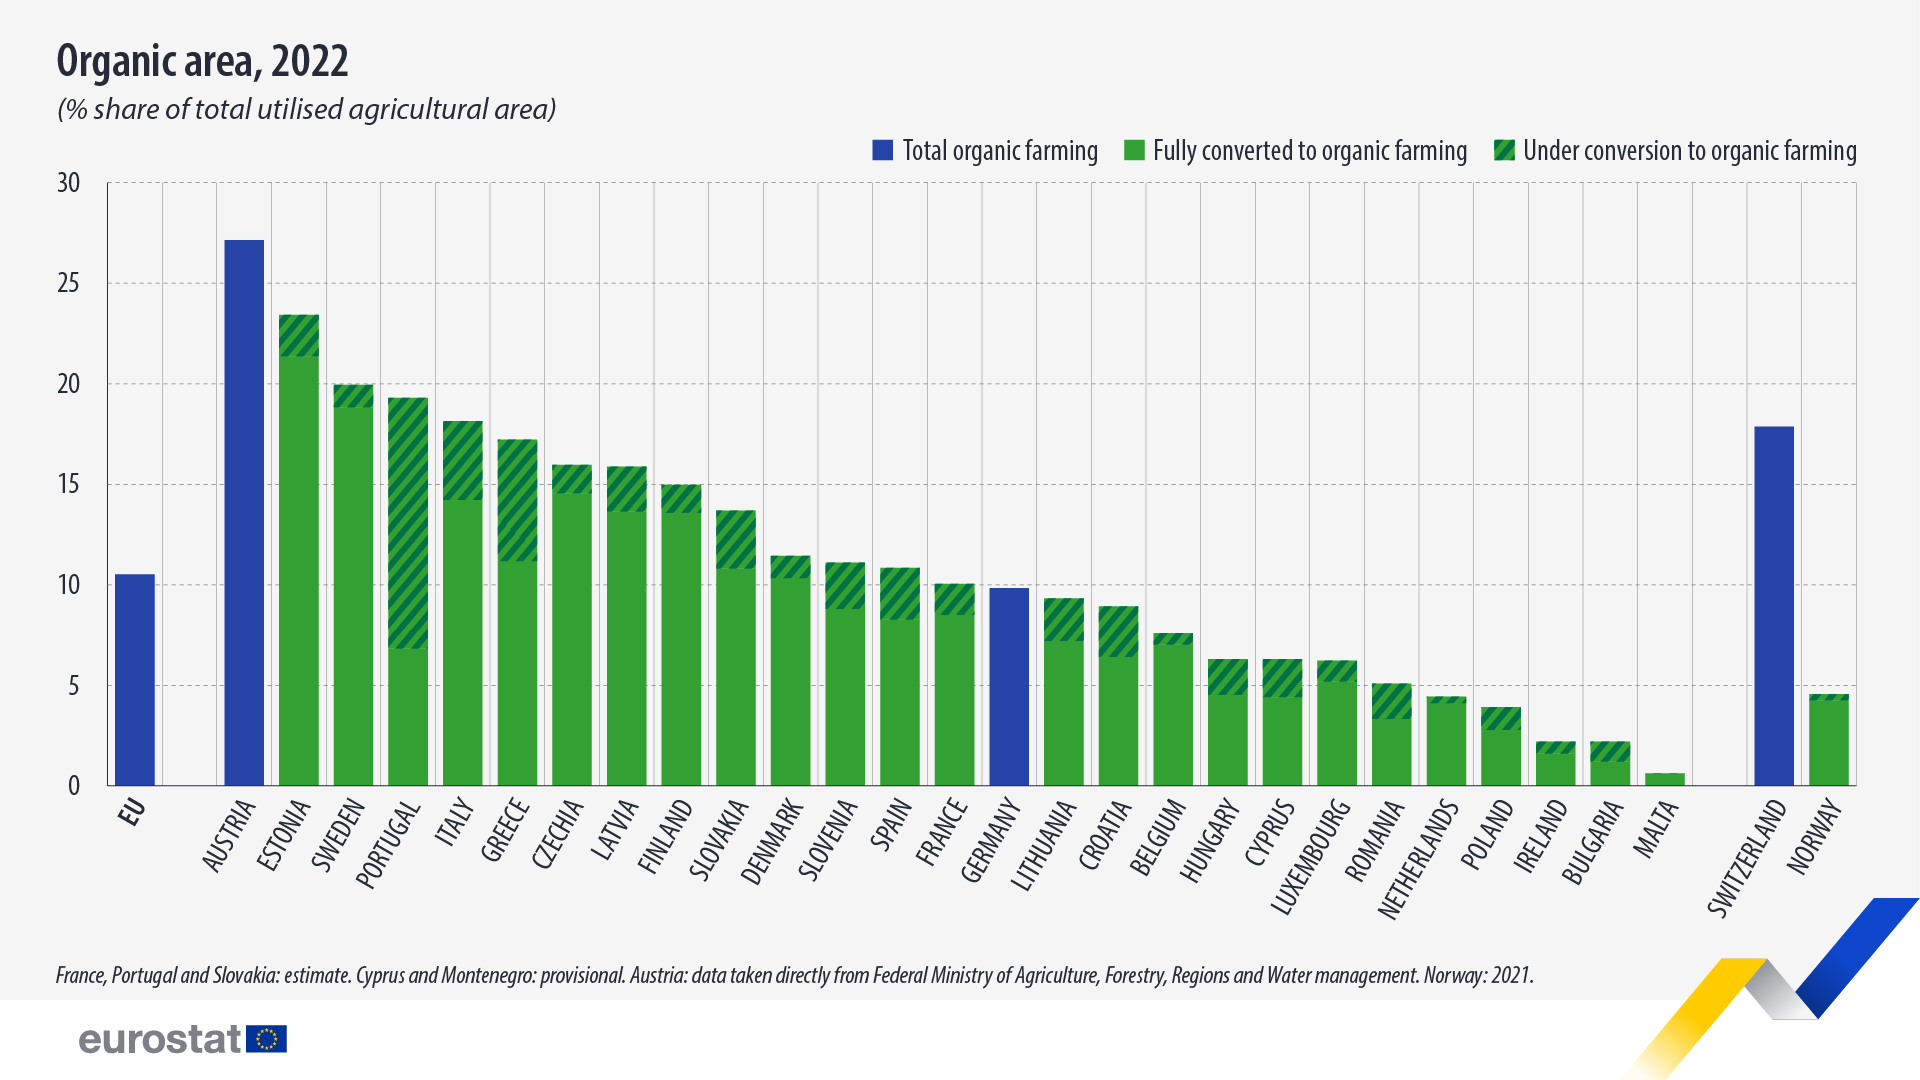
Organic-area-2022.jpg
(
file
)
522 KB
1
14:41, 18 June 2024
Social media - statistics on the use by enterprises 2023 .xlsx
(
file
)
19 KB
1
12:02, 18 June 2024
Social media - statistics on the use by enterprises 2023 - dynamic .xlsx
(
file
)
16 KB
1
15:41, 17 June 2024
Price level index for final household expenditure HFCE 20 06 24.xlsx
(
file
)
17 KB
1
12:55, 17 June 2024
At risk of poverty rate, EU, 2019-2023 incomeV1.png
(
file
)
28 KB
1
14:26, 13 June 2024
EU labour market data Q1 2024 LFS MI final.xlsx
(
file
)
111 KB
4
14:23, 12 June 2024
Government expenditure 2022 V3.jpg
(
file
)
1 MB
1
14:15, 11 June 2024
Employment, unemployment and labour market slack first quarter 2024 (age group 20 to 64, seasonally adjusted data)V2.png
(
file
)
678 KB
1
14:08, 11 June 2024
Employment, unemployment and labour market slack first quarter 2024 (age group 20 to 64, seasonally adjusted data)V1.png
(
file
)
678 KB
1
09:34, 4 June 2024
Key environmental protection and economic indicators EU 2018-2023V1.xlsx
(
file
)
13 KB
1
09:10, 4 June 2024
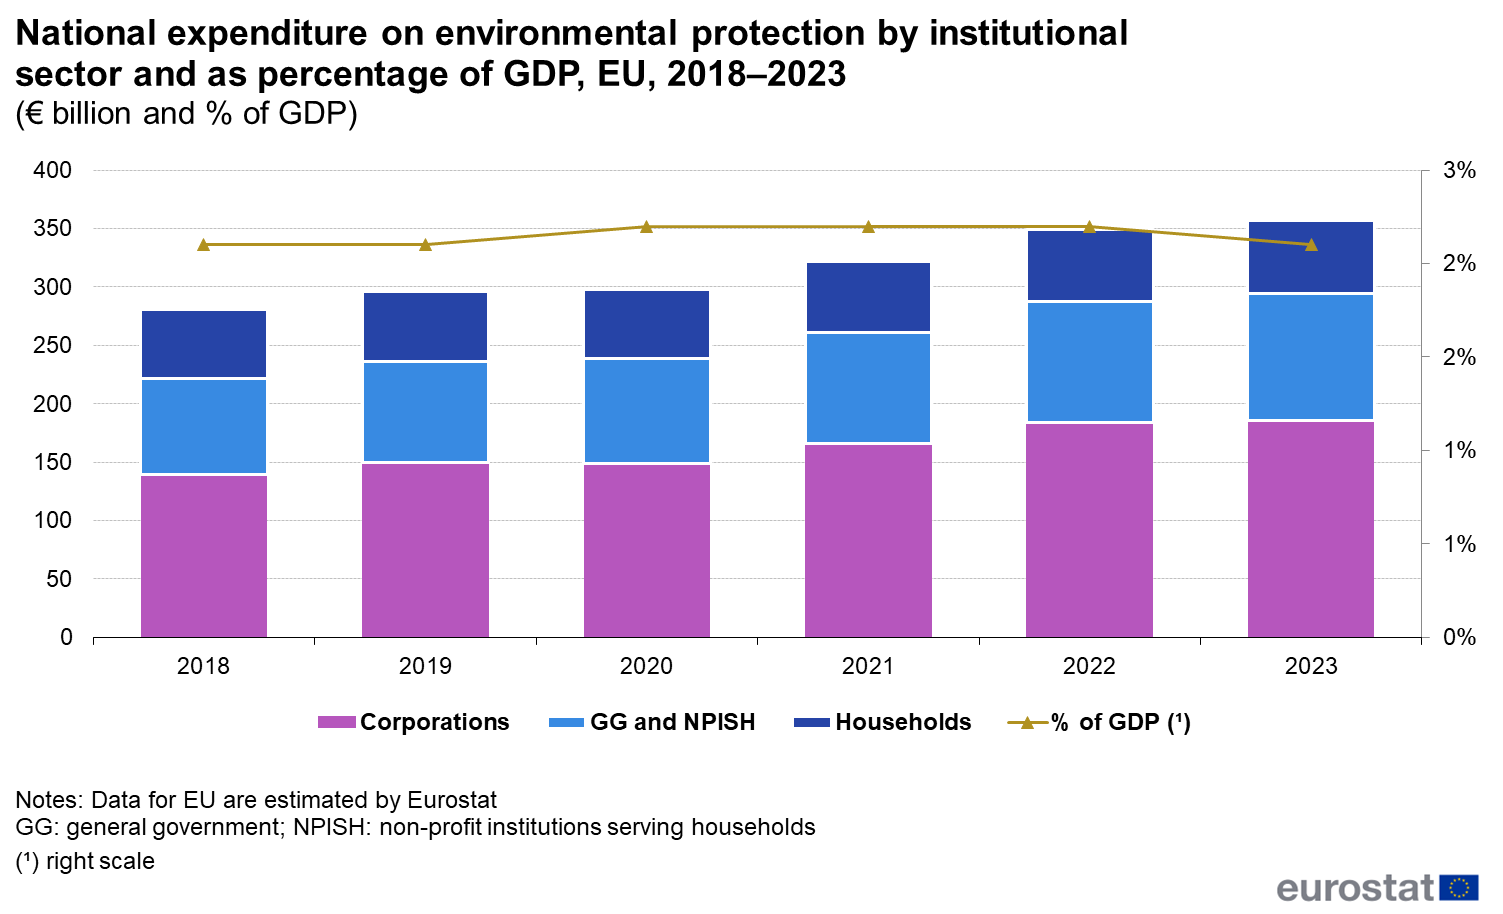
Figure 2 National expenditure on environmental protection by institutional sector and as percentage of GDP, EU, 2018–2023 (€ billion and % of GDP).png
(
file
)
68 KB
1
09:07, 4 June 2024
Key environmental protection and economic indicators EU 2018-2023.xlsx
(
file
)
13 KB
1
10:23, 3 June 2024
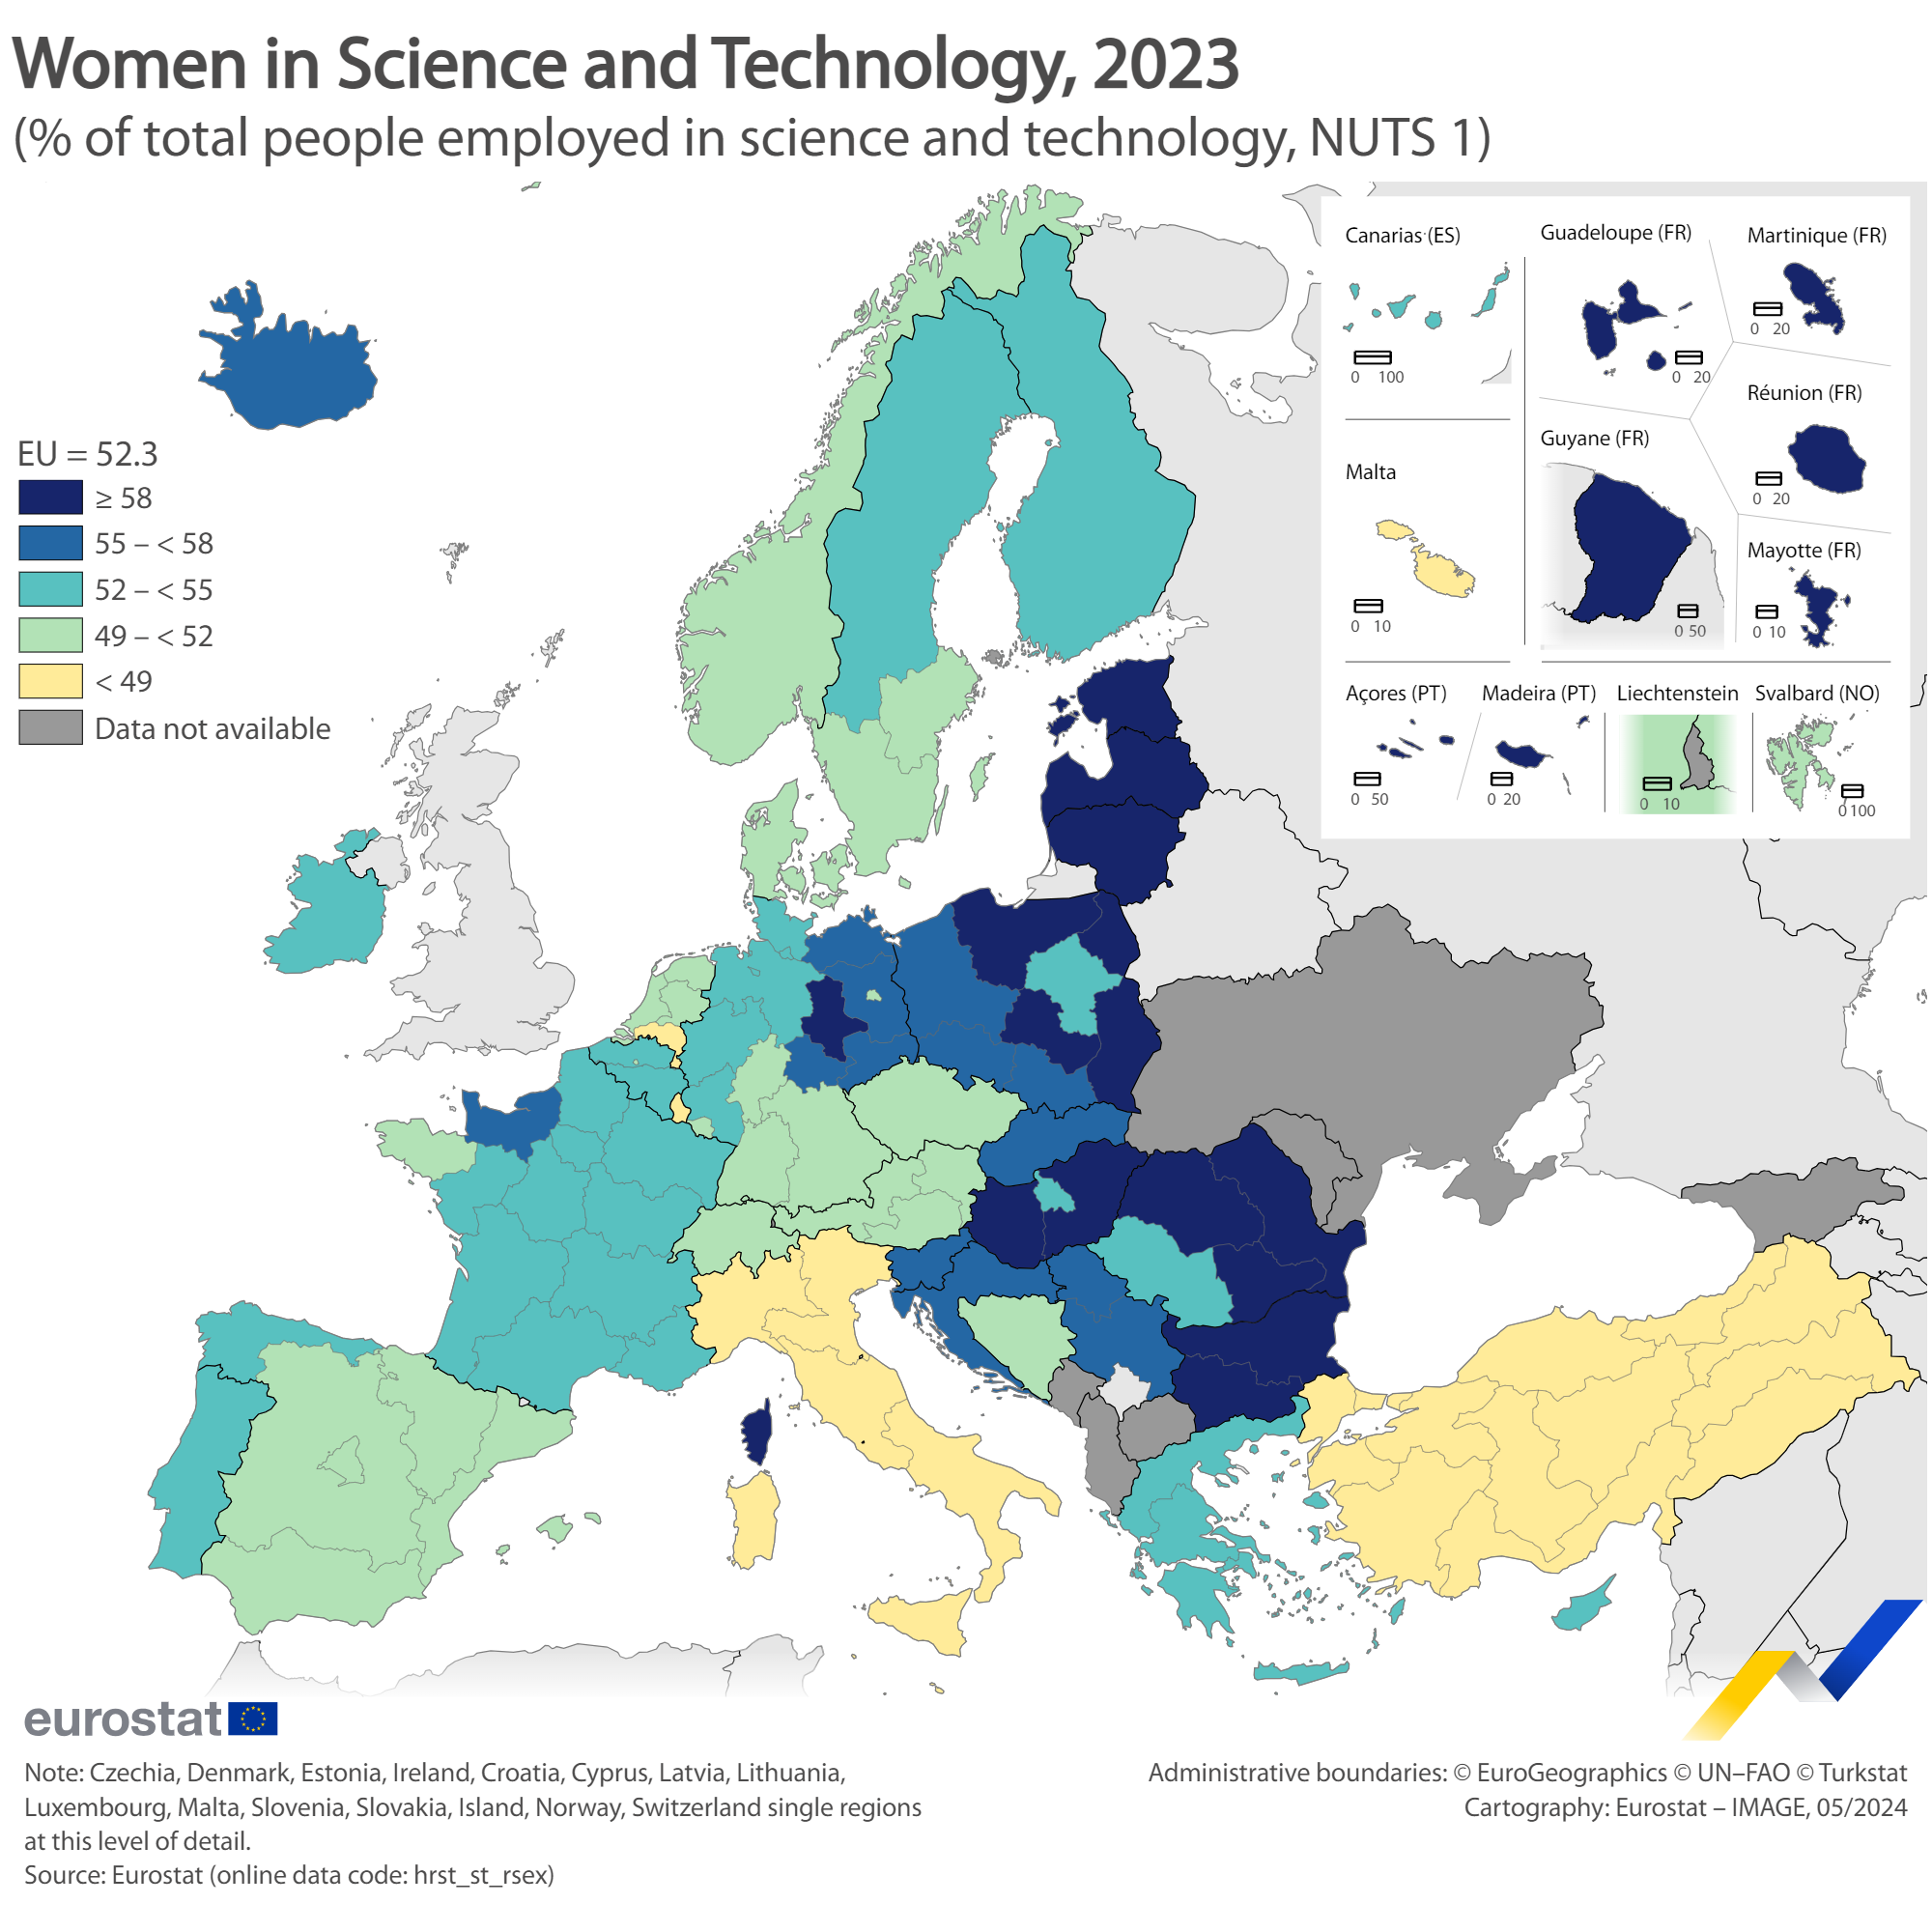
HRST 20240531V2.png
(
file
)
864 KB
1
09:42, 3 June 2024
HRST 20240531V1.pdf
(
file
)
1.01 MB
1
15:19, 31 May 2024
SE HRSTO 2023 05 24.xlsx
(
file
)
75 KB
1
15:18, 31 May 2024
The 25 NUTS 1 regions with the highest share of women in HRST occupation, 2023.png
(
file
)
92 KB
1
15:15, 31 May 2024
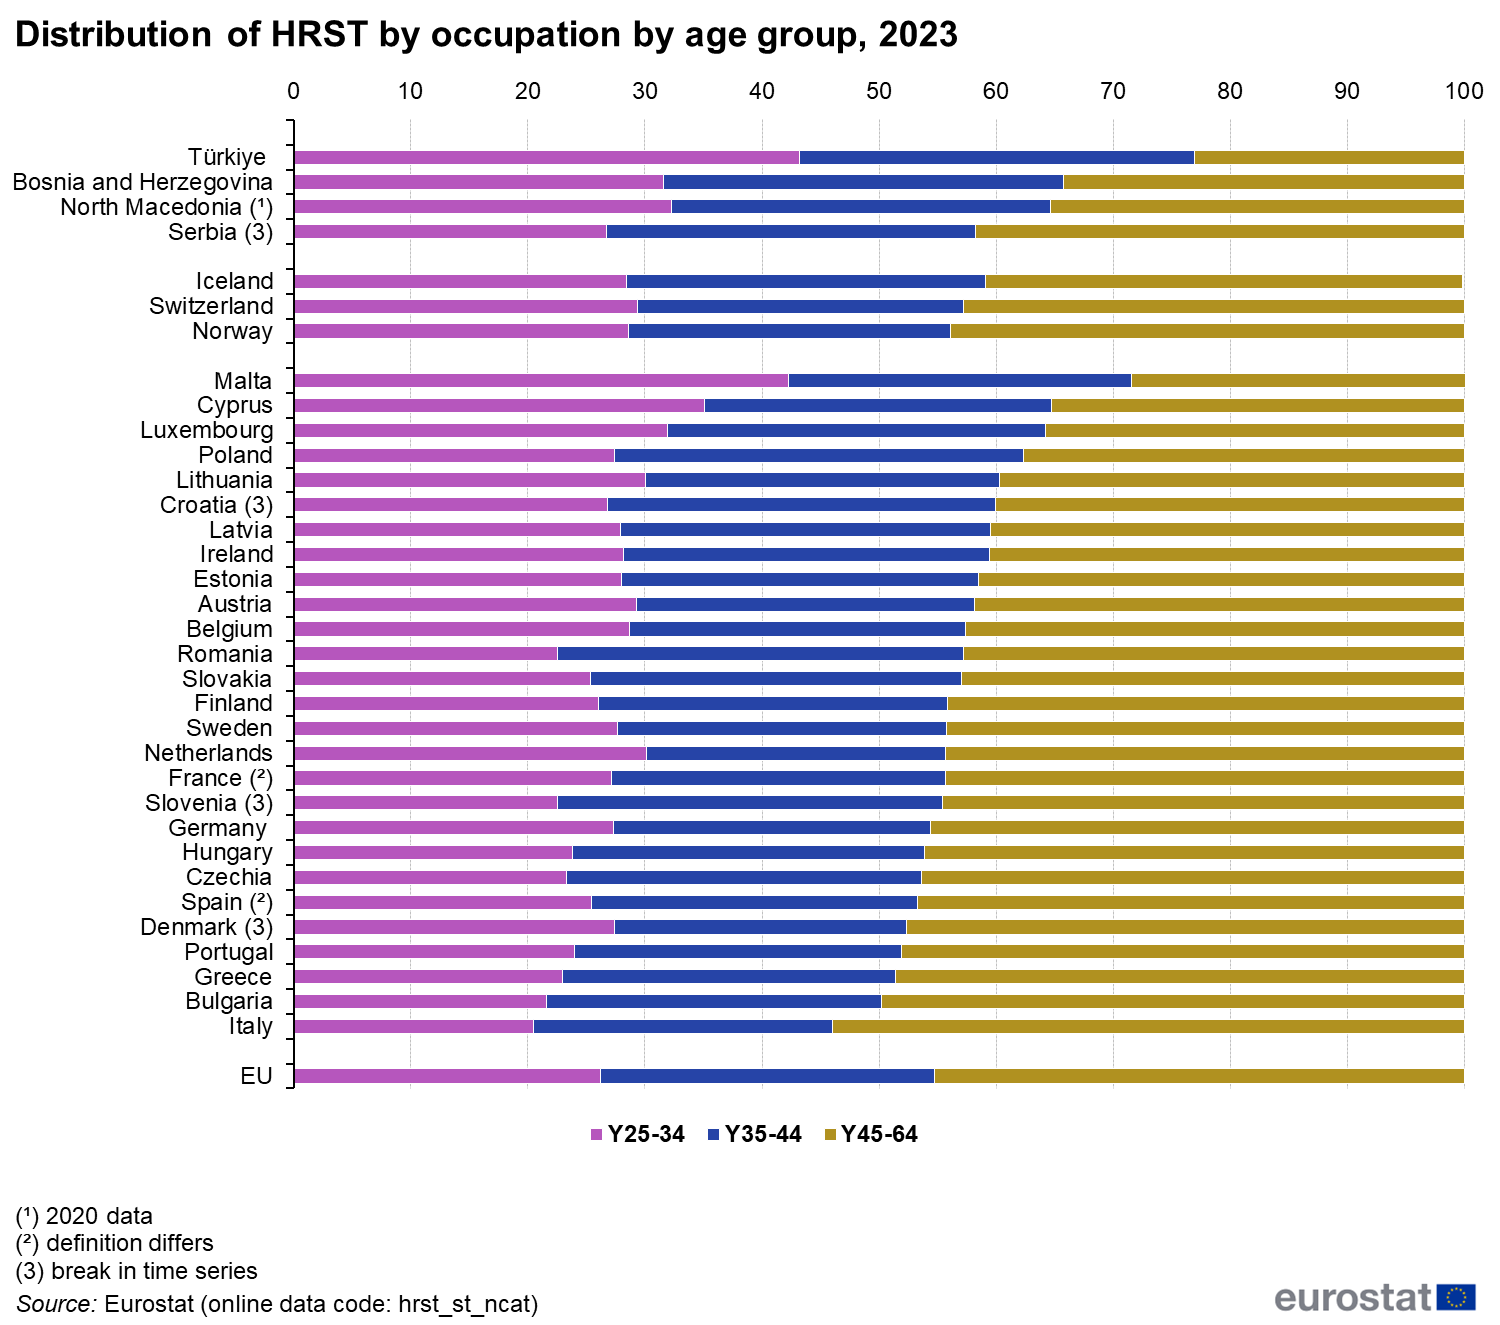
Distribution of HRST by occupation by age group, 2023.png
(
file
)
91 KB
1
15:13, 31 May 2024
The 25 NUTS 2 regions with the highest shares of employment in HRST occupations in the active population, 2023.png
(
file
)
86 KB
1
15:12, 31 May 2024
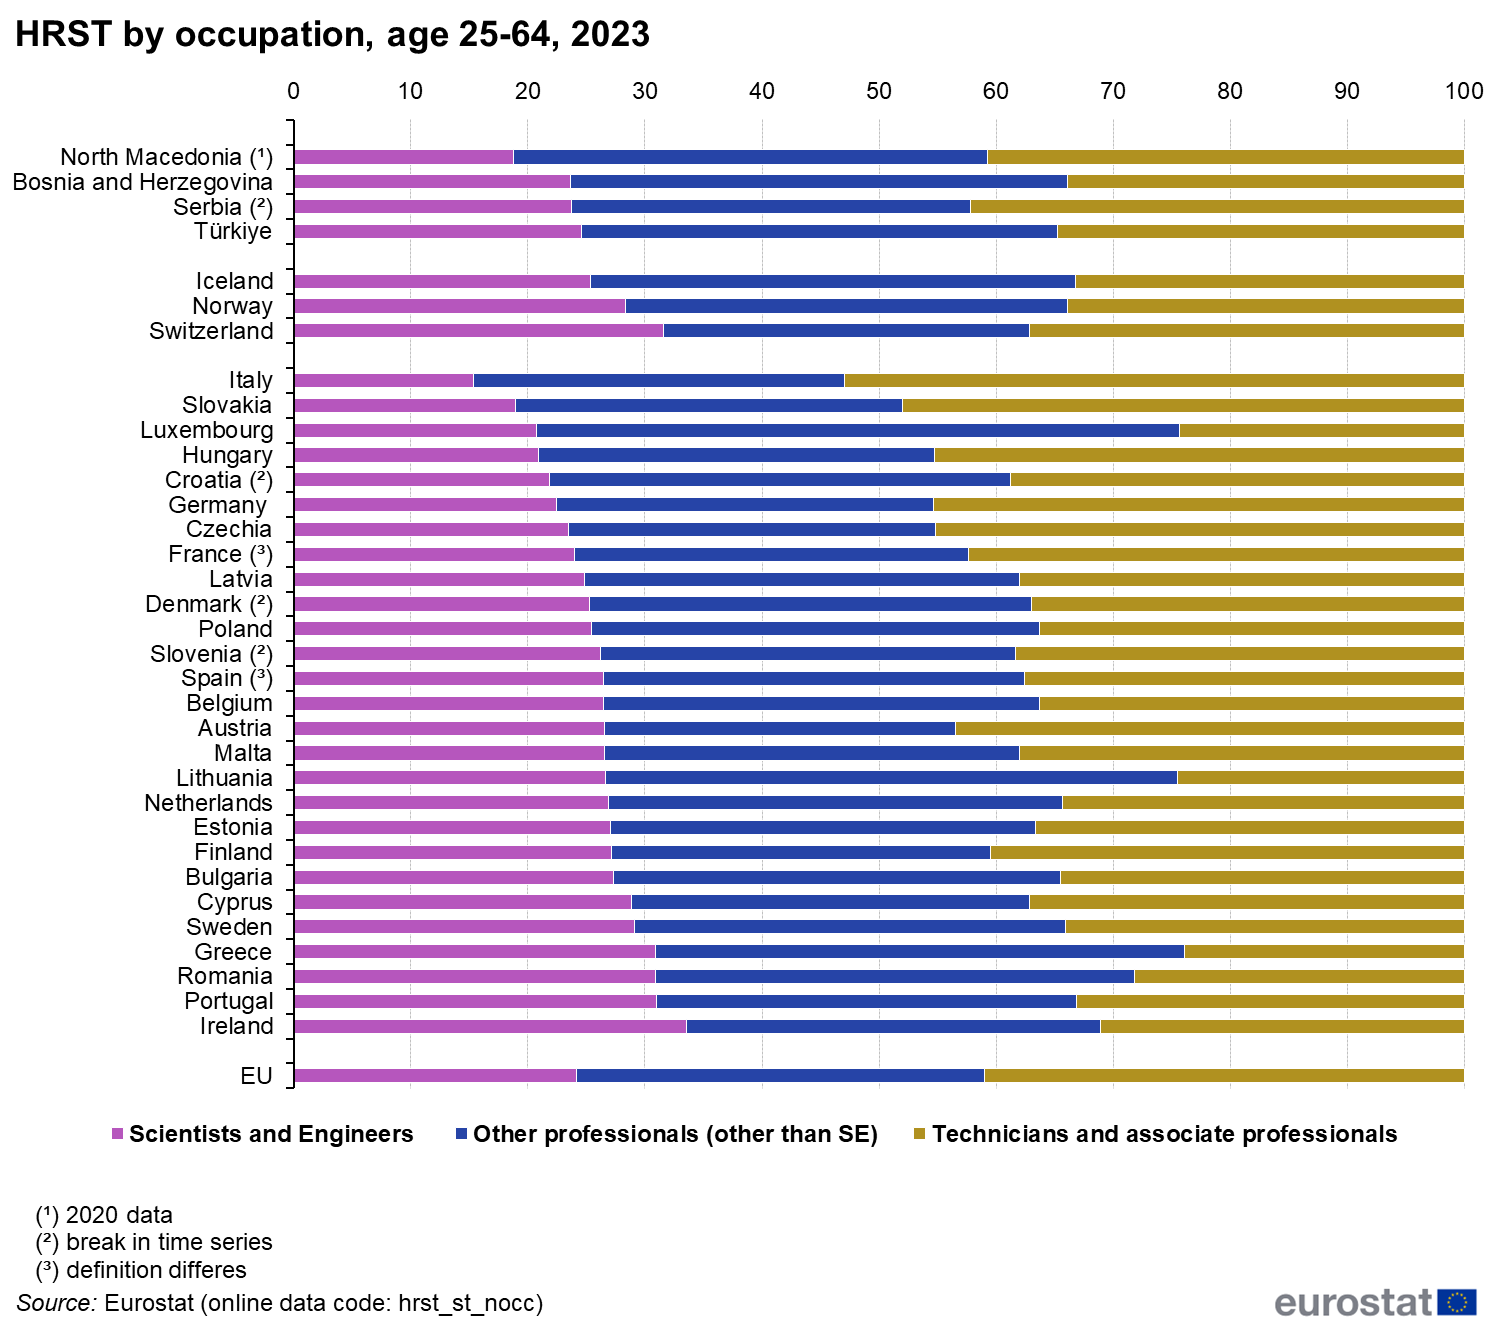
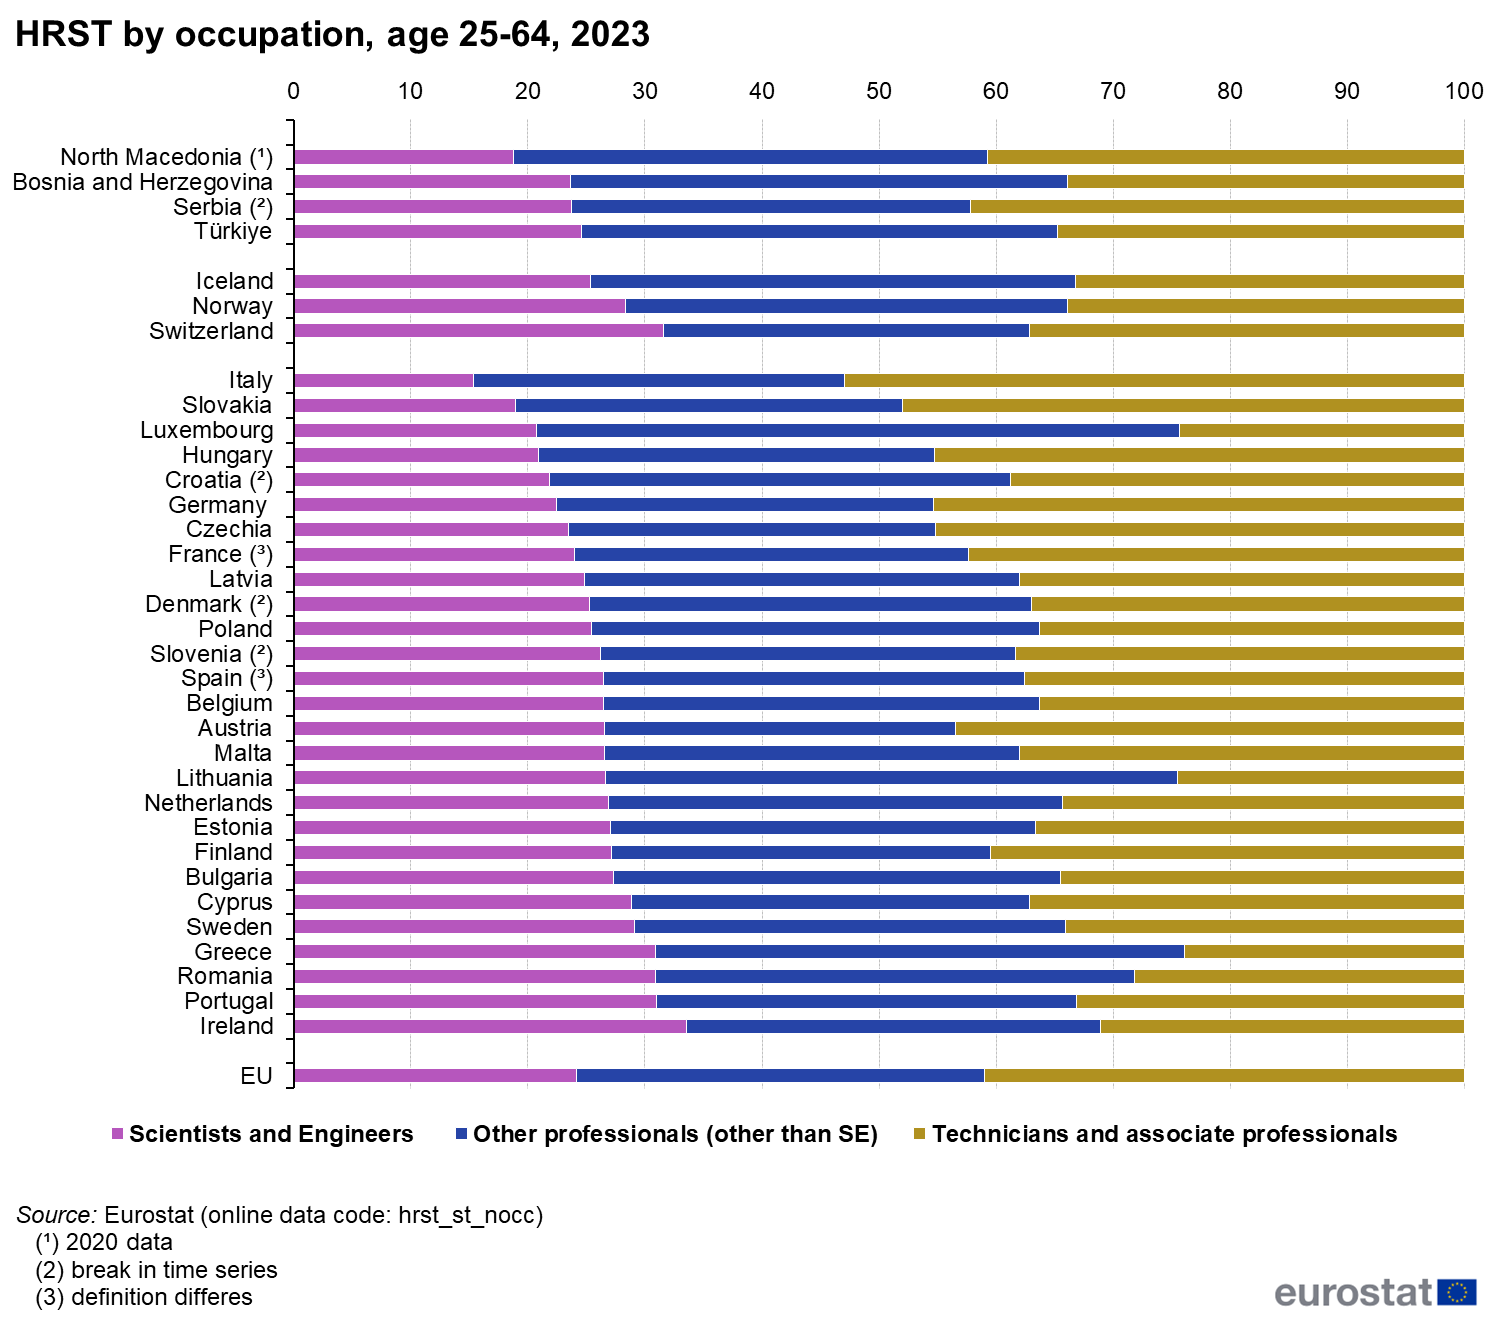
HRST by occupation, age 25-64, 2023.png
(
file
)
97 KB
1
15:07, 31 May 2024
FIG 1 HRST by occupation, age 25-64, 2023 .png
(
file
)
97 KB
1
14:22, 31 May 2024
Figure 3 Distribution of HRST by occupation by age group, 2023.png
(
file
)
92 KB
1
14:19, 31 May 2024
Table 1 Employment statistics on women aged 25-64 employed in science and technology (HRST by occupation), in 2023.png
(
file
)
655 KB
1
14:18, 31 May 2024
Figure 2 The 25 NUTS 2 regions with the highest shares of employment in HRST occupations in the active population, 2023.png
(
file
)
83 KB
1
14:17, 31 May 2024
Figure 1 HRST by occupation, age 25-64, 2023.png
(
file
)
98 KB
1
12:21, 31 May 2024
Household composition statistics 05 2023.xlsx
(
file
)
775 KB
1
12:14, 31 May 2024
Household composition statistics 31 05 2023.xlsx
(
file
)
775 KB
1
11:56, 31 May 2024
Export of goods to other Member States 2023 31-05-24.xlsx
(
file
)
15 KB
1
10:42, 30 May 2024
Extra tables Statistics explained.xlsx
(
file
)
19 KB
3
10:57, 29 May 2024
Youth in the digital world 2405 05 24.xlsx
(
file
)
110 KB
1
10:55, 29 May 2024
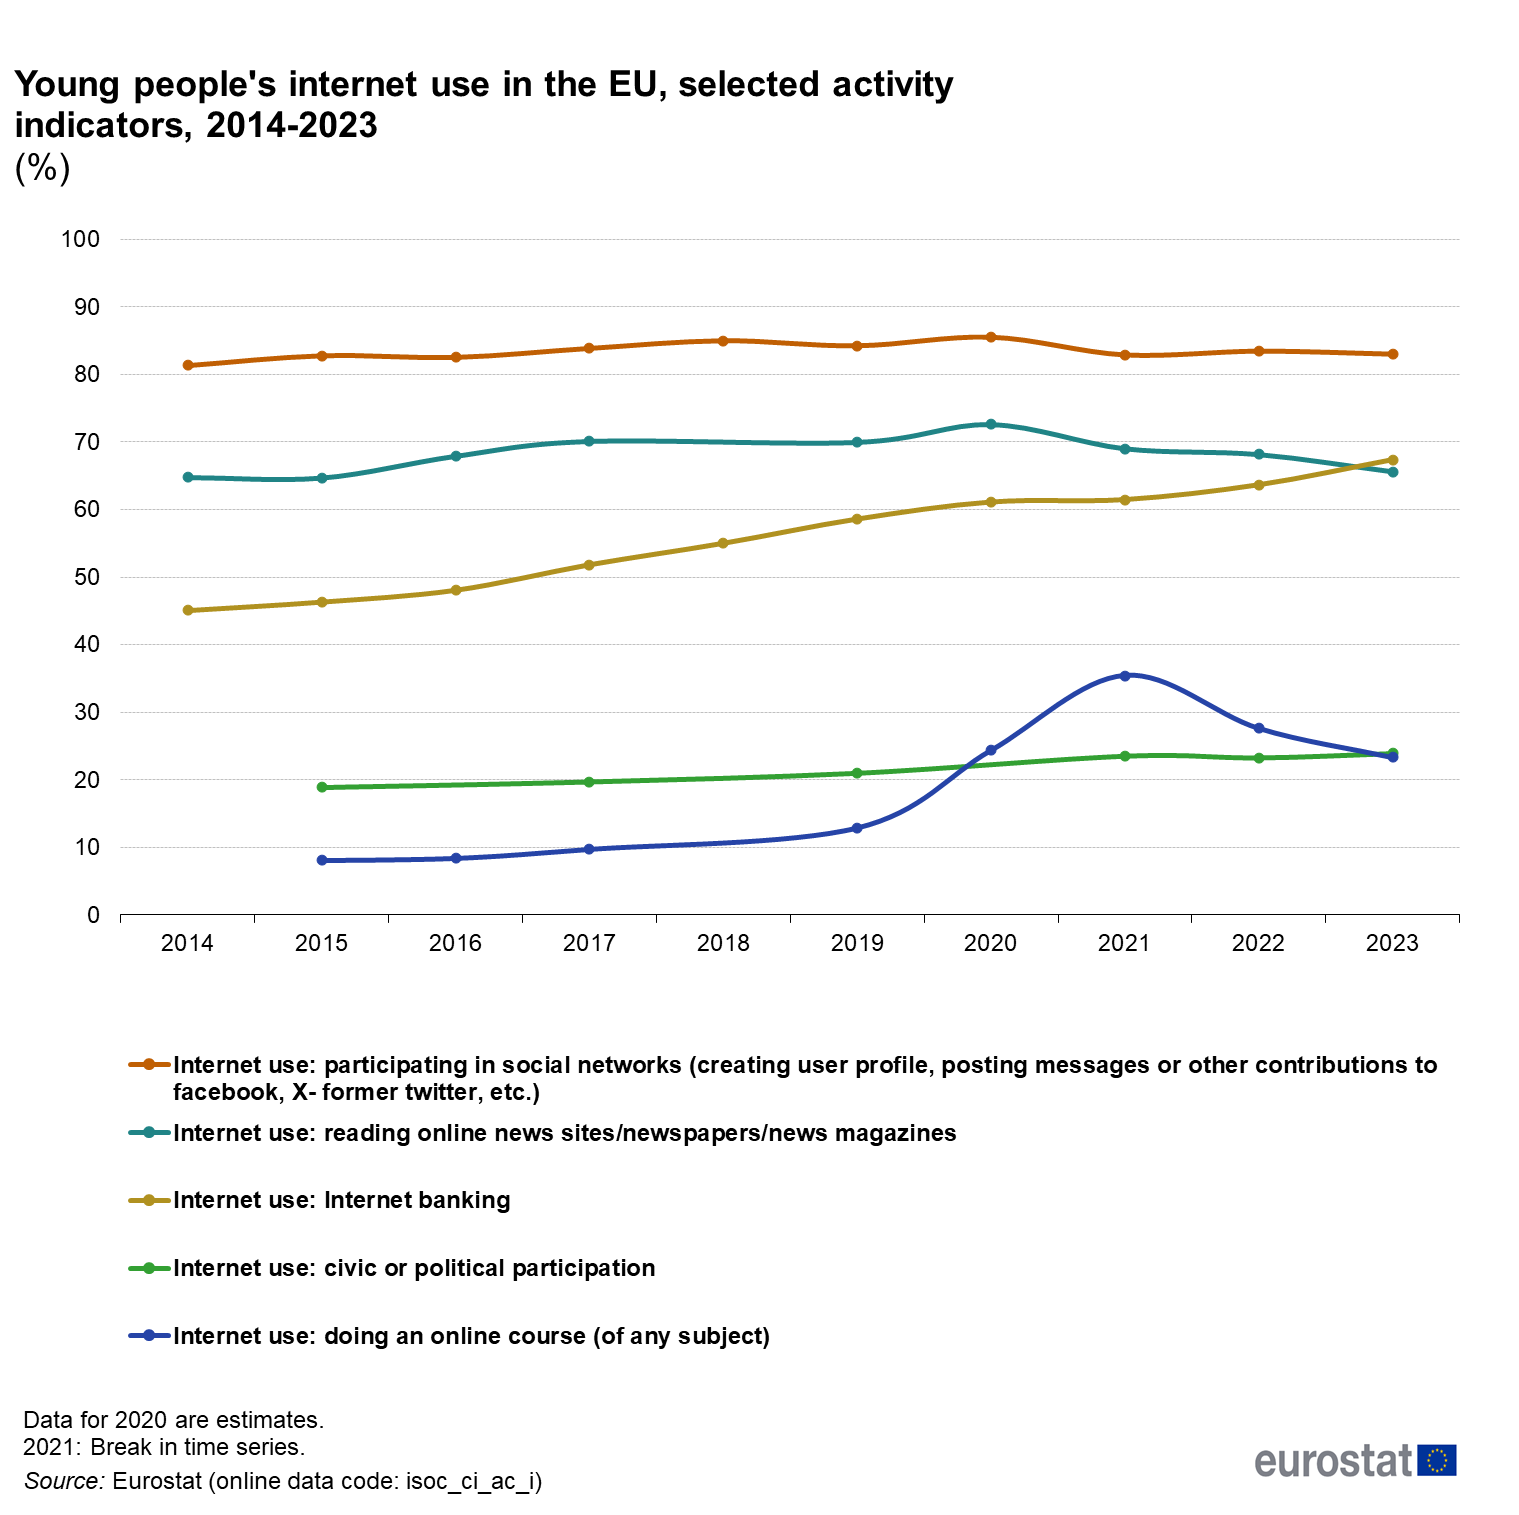
Figure 6 Young people's internet use in the EU, selected activity indicators, 2014-2023 (%) .png
(
file
)
86 KB
1
10:55, 29 May 2024
Figure 2 People who participated in social networks, 2023 (%).png
(
file
)
145 KB
1
10:54, 29 May 2024
Figure 5 Percentage of individuals who have verified the information or content found on the internet, 2023 (%).png
(
file
)
114 KB
1
10:53, 29 May 2024
Figure 3 People who used the internet for civic or political participation, 2023 (%).png
(
file
)
139 KB
1
09:59, 29 May 2024
Tourism industries - employment -29-05-2024 dynamic graphV2.xlsx
(
file
)
16 KB
1
First page
Previous page
Next page
Last page
Special page
ISSN 2443-8219

.png)
_(million_EUR)V1.png)


V2.png)
V1.png)
.png)


,_in_2023.png)


_.png)
.png)
.png)
.png)