Road freight transport by vehicle characteristics
Data extracted in September 2023.
Planned article update: 29 September 2024.
Highlights
In 2022, more than three-quarters (78.6 %) of EU road freight transport in tonne-kilometres was carried by heavy goods vehicles with a maximum permissible laden weight of over 30 tonnes.
In 2022, close to two-thirds (61.7 %) of road freight transport in tonne-kilometres in the EU were carried by goods vehicles aged 5 years or less.
In 2022, road tractors and semi-trailers accounted for more than three-quarters (77.8 %) of EU road freight transport measured in tonne-kilometres, while in vehicle-kilometres they accounted for nearly two-thirds (65.5 %).
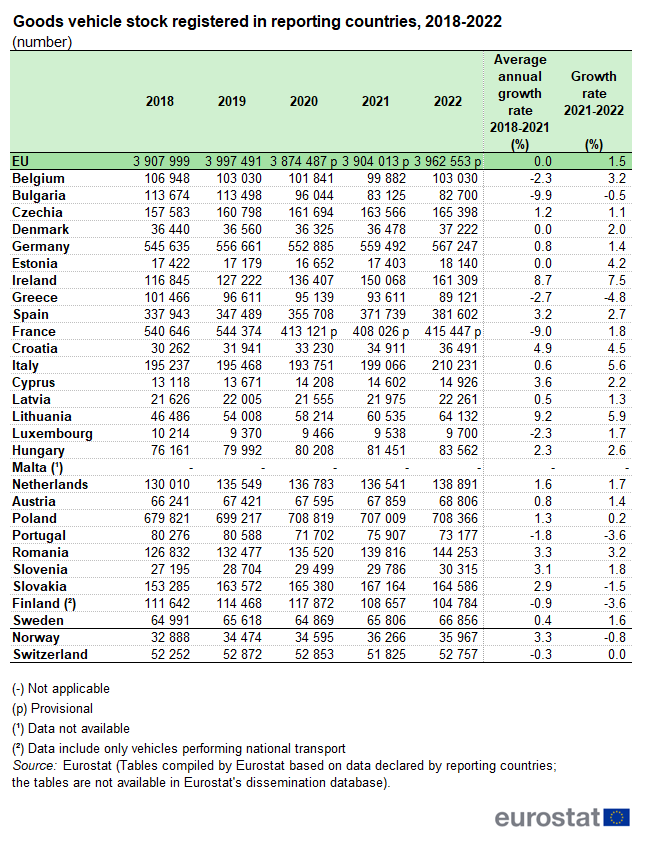
Goods vehicle stock in reporting countries, 2022
This article presents road freight transport in the European Union (EU) focusing on road freight vehicles. It deals with vehicle stocks in the EU Member States and road freight transport broken down by the following vehicle characteristics: maximum permissible laden weight, load capacity, age and axle configuration.
This article and the articles 'Road freight transport statistics', 'Road freight transport by type of goods', 'Road freight transport by journey characteristics' and 'Road freight transport statistics - cabotage' present a complete overview of road freight transport in Europe.
Full article
The EU fleet of goods vehicles
There were nearly 4.0 million goods vehicles registered in the EU in 2022. This number was 1.5 % higher than in 2021 (see Table 1). When looking at the average annual growth rate, no significant changes occurred between 2018 and 2021.
Among the EU Member States, Poland had the largest stock of goods vehicles in 2022, with 17.9 % of the EU fleet, while Germany had the second largest fleet, with 14.3 %, followed by France and Spain, with 10.5 % and 9.6 %, respectively.
From 2021 to 2022, there were different trends among the EU Member States regarding the stock of goods vehicles. In 21 countries, the stock increased, while in five countries it decreased. Ireland recorded the highest growth rate of goods vehicle stock (+7.5 %), followed by Lithuania and Italy (+5.9 % and +5.6 %, respectively).
Several EU Member States followed the opposite trend and recorded decreases in the number of goods vehicles between 2021 and 2022. The strongest fall in the number of goods vehicle stock was in Greece (-4.8 %); Portugal and Finland followed with -3.6 % each. For Bulgaria and Greece, the falls in 2022 continued the trends seen in the previous years.
Between 2018 and 2021 the average annual growth rate of goods vehicle stocks increased in 17 countries, in two countries (Denmark and Estonia) it remained at the same level, while in 7 countries it decreased. Lithuania recorded the highest positive average annual growth rate over the period 2018-2021 (+9.2 %), followed by Ireland (+8.7 %) and Croatia (+4.9 %), while Bulgaria was at the other end with an average annual growth rate of -9.9 %, followed by France (-9.0 %) and Greece (-2.7 %).
Road freight transport by maximum permissible laden weight of vehicle
In 2022, vehicles with a maximum permissible laden weight over 30 tonnes carried 78.6 % of EU road freight transport in million tonne-kilometres. Vehicles with a maximum permissible laden weight under 10 tonnes accounted for merely 0.3 % of the total EU transport performance in 2022 (see Table 2). Vehicles with a maximum permissible laden weight from 10.1 to 20.0 tonnes made up 16.1 % while the ones from 20.1 to 30.0 tonnes performed 5.1 % of total EU transport.
In 14 EU Member States, the highest share of their transport performance was carried by heavy goods vehicles with maximum permissible laden weight of more than 40 tonnes. In 2022, these heavy vehicles performed more than 90 % of the total road freight transport in the Netherlands (96.7 %), Luxembourg (96.5 %), Estonia (95.0 %), Sweden (91.7 %) and Croatia (90.9 %). The largest shares of goods vehicles with maximum permissible laden weight from 30.1 to 40 tonnes were observed in Poland (93.2 %), Spain (91.0 %) and Portugal (89.7 %). Italy (85.3 %), Belgium (75.2 %) and France (63.7 %) recorded the highest shares of transport performance for vehicles with maximum laden weight from 10.1 to 20 tonnes.
In 2022, Cyprus recorded the highest increase in total tonne-kilometres compared with 2021, by 29.8 %, followed on some distance by Luxembourg with 6.5 % and Slovakia with 4.3 %. At the other end of the scale, Estonia recorded the highest decrease in total tonne-kilometres between 2021 and 2022 (-13.3 %), followed by Belgium (-7.4 %) and Lithuania (-6.9 %).
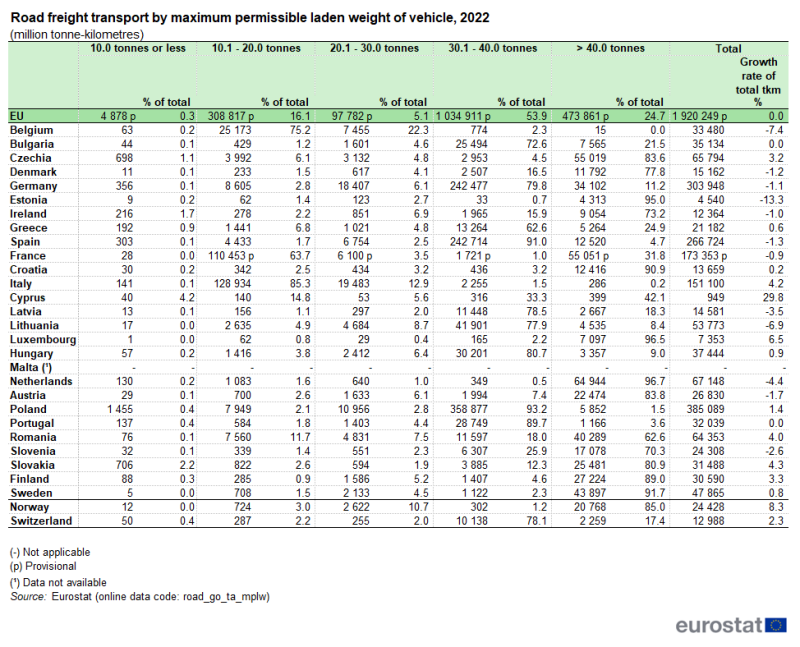
(million tonne-kilometres)
Source: Eurostat (road_go_ta_mplw)
EU road transport in tonne-kilometres performed by lighter vehicles (maximum permissible laden weight 10.1 - 20.0 tonnes) increased by 100.1 % in 2021 compared with 2018 (see Figure 1). However, in 2022 the transport performance by these vehicles fell by 9.4 %. Transport performance by the heaviest goods vehicles with maximum permissible laden weight more than 40 tonnes decreased by 40.0 % in 2021 compared with 2018, whereas in 2022 it increased by 8.4 %.
When looking at the other three individual categories (10.0 tonnes or less, 20.1 to 30.0 tonnes and 30.1 to 40.0 tonnes), the category 10.0 tonnes or less recorded decreases in both 2021 and 2022 compared with 2018. The category 20.1 to 30.0 tonnes slightly increased in 2021 (compared with 2018) and remained constant in 2022, while the category 30.1 to 40.0 tonnes recorded a significant increase in 2021 (compared with 2018) and remained almost at the same level in 2022.
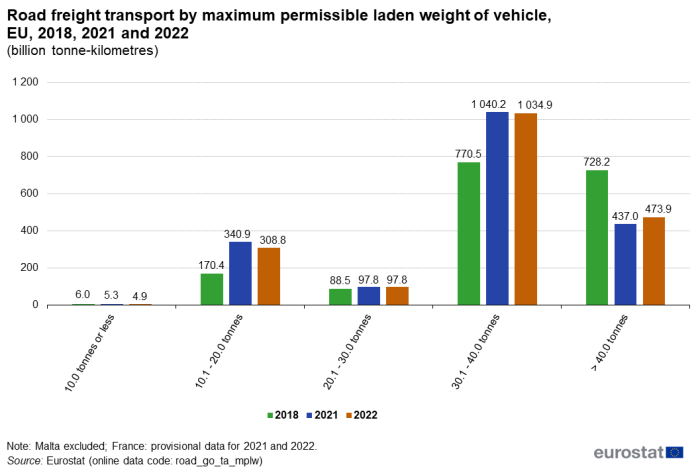
(billion tonne-kilometres)
Source: Eurostat (road_go_ta_mplw)
Road freight transport by load capacity
In 2022, three-quarters (75.3 %) of EU road freight transport in terms of million tonne-kilometres were carried by vehicles with a load capacity of 20.6 tonnes or more. Vehicles with a load capacity of 9.5 tonnes or less represented 3.5 % of the EU transport performance (see Table 3).
Among the EU Member States, Poland (93.3 %), Spain (93.2 %) and Latvia (90.5 %) had the highest shares of transport performed by vehicles with a load capacity between 20.6 and 30.5 tonnes, while Belgium, Italy, and Luxembourg had the smallest shares in the same category with only 0.3 %, 0.8 % and 1.3 %, respectively. Belgium and Italy reported that 85.1 % and 76.9 %, respectively, of their transport were carried by vehicles with a load capacity between 9.6 and 15.5 tonnes. Luxembourg (87.2 %), Sweden (87.0 %) and Finland (83.6 %) had the highest shares for vehicles with a load capacity of more than 30.5 tonnes.
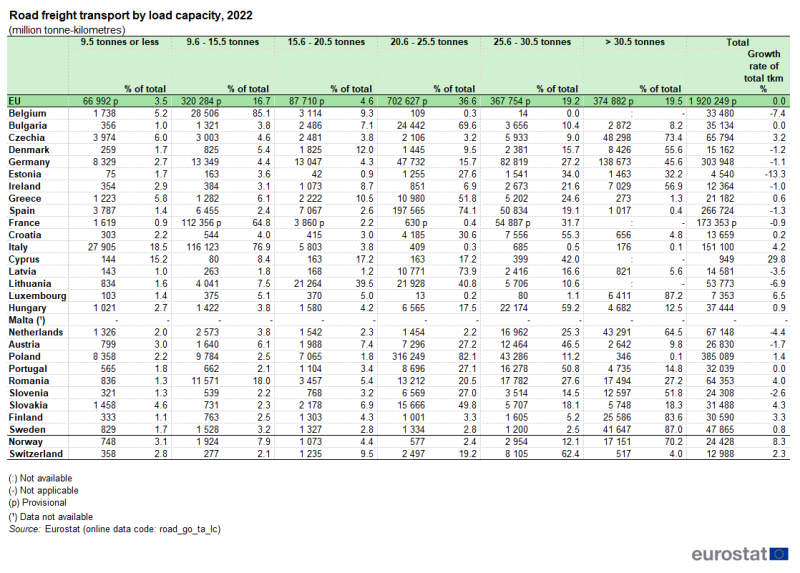
(million tonne-kilometres)
Source: Eurostat (road_go_ta_lc)
Compared with 2018, in 2021 there was a substantial growth in EU transport performance by vehicles with a load capacity between 9.6 and 15.5 tonnes (+92.7 %), however, followed by a decrease of 11.1 % in 2022 (see Figure 2). On the opposite end, transport performance by vehicles with a load capacity between 25.6 and 30.5 tonnes decreased by 27.2 % in 2021 compared with 2018. By contrast, it recorded a slight increase in 2022 (+0.7 %).
For goods vehicles with a load capacity of 20.6 to 25.5 tonnes, there was an increase in transport performance in 2021 compared with 2018 of 13.7 %, followed by an increase of 4.3 % in 2022. For goods vehicles with capacity over 30.5 tonnes, the growth recorded in 2021 compared with 2018 (+10.2 %) was also continued in 2022 (+2.1 %). For the other categories (9.5 tonnes or less; and 15.6 to 20.5 tonnes) the increases from 2018 to 2021 were rather small: the category 9.5 tonnes or less recorded an increase of 5.0 %, while the category 15.6 to 20.5 tonnes increased by 2.9 %. In 2022, transport performance for the category 9.5 tonnes or less continued to increase (+7.2 %), while for the category 15.6 to 20.5 tonnes it decreased by 5.0 %.
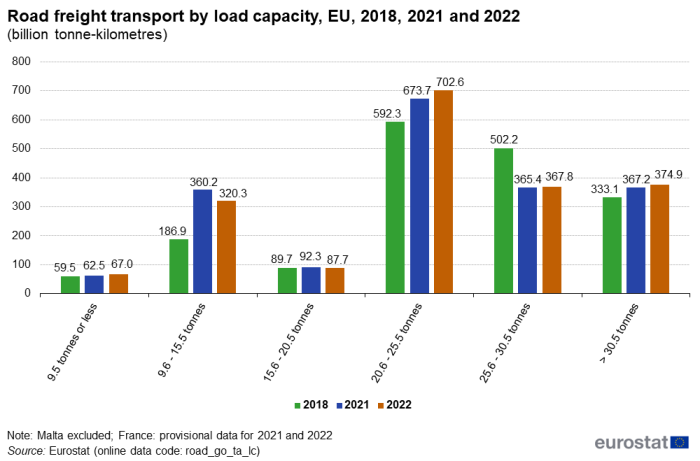
(billion tonne-kilometres)
Source: Eurostat (road_go_ta_lc)
Road freight transport by age of vehicle
The goods vehicles aged between 2 and 5 years carried 837.7 billion tonne-kilometres in 2022. These vehicles accounted for 43.6 % of the total transport performance, a decrease of 9.8 % compared with 2021, and an average annual growth rate of 7.7 % between 2018 and 2021 (see Table 4). The goods vehicles aged between 6 and 9 years carried 448.4 billion tonne-kilometres and accounted for more than a fifth (23.4 %) of the total transport performance. Their performance increased compared with 2021 (+11.9 %); during the period 2018-2021, the average annual growth rate of transport performance for these vehicles was at 6.5 %.
The youngest goods vehicles, with less than 2 years since their first registration, carried 346.2 billion tonne-kilometres (18.0 % of the total tonne-kilometres in the EU) in 2022. The tonne-kilometres performed by these vehicles rose by 13.8 % compared with 2021. By contrast, the average annual growth rate of their transport performance was negative during 2018-2021, at -4.6 %.
The vehicles between 10 and 14 years accounted for a smaller share of the transport performance (183.2 billion tonne-kilometres, representing 9.5 % of the total tonne-kilometres), while the transport performance of the vehicles aged 15 years and over was limited (94.5 billion tonne-kilometres, representing 4.9 % of the total tonne-kilometres).
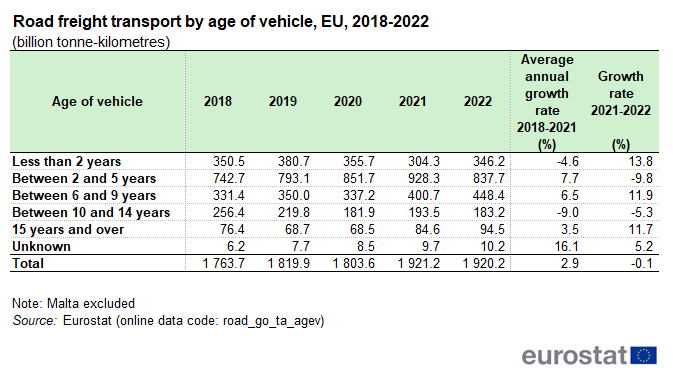
(billion tonne-kilometres)
Source: Eurostat (road_go_ta_agev)
Compared with 2018, in 2022 there was a decline in road freight transport performed (in tonne-kilometres) by the youngest vehicles with less than 2 years since their first registration (see Figure 3). Their share of the total EU freight transport decreased from 19.9 % in 2018 to 15.8 % in 2021 (a fall by 4.1 percentage points (pp)) and increased to 18.0 % in 2022 (an increase of 1.9 pp compared with 2018). More or less the same trend was recorded by the vehicles between 10 and 14 years, from 14.5 % in 2018 to 10.1 % in 2021 (a fall by 4.4 pp), to 9.5 % in 2022 (a fall by 5.0 pp compared with 2018). By contrast, transport performed by vehicles between 6 and 9 years increased from 18.8 % in 2018 to 20.9 % in 2021, and to more than a fifth of the total tonne-kilometres performed in 2022 (23.4 %). Between 2018 and 2022, it represented an increase by 4.6 pp. The transport performed by vehicles between 2 and 5 years recorded an increase by 6.2 pp between 2018 and 2021, followed by a decrease by 4.7 pp between 2021 and 2022. The overall change was 1.5 pp between 2018 and 2022.
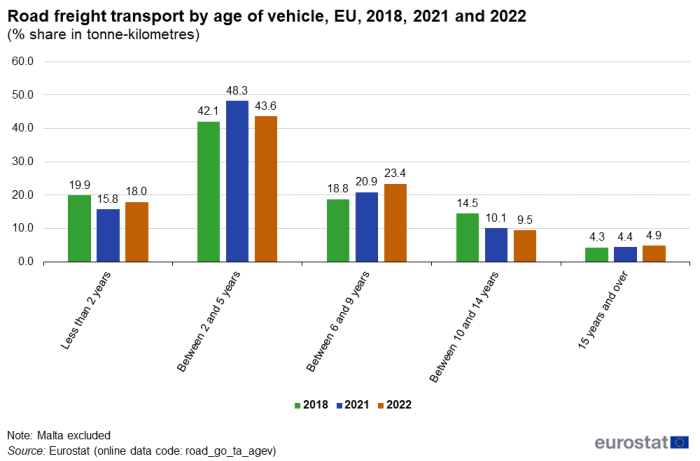
(% share in tonne-kilometres)
Source: Eurostat (road_go_ta_agev)
At EU level, goods vehicles of 5 years or less accounted for 60.0 % of the total vehicle-kilometres (vkm) in 2022, while goods vehicles of 10 years or more accounted for only 16.7 % (see Figure 4). In 10 EU Member States, more than 60 % of their total vehicle-kilometres were performed by goods vehicles that were 5 years or less in 2022. The highest shares of vehicle-kilometres performed by 'young' goods vehicles, i.e. 5 years or less since first registration, were recorded by Germany, with 80.0 %, followed by Luxembourg (79.1 %), Denmark (75.6 %) and France (73.8 %). At the other end of the scale, the major part of the vehicle-kilometres was performed by aged goods vehicles (i.e. 10 years and over) in Ireland (100.0 %), Greece (77.4 %) and Cyprus (49.4 %).
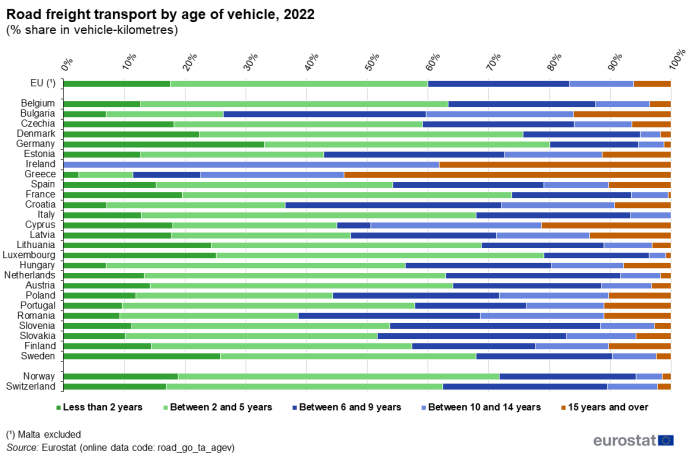
(% share in vehicle-kilometres)
Source: Eurostat (road_go_ta_agev)
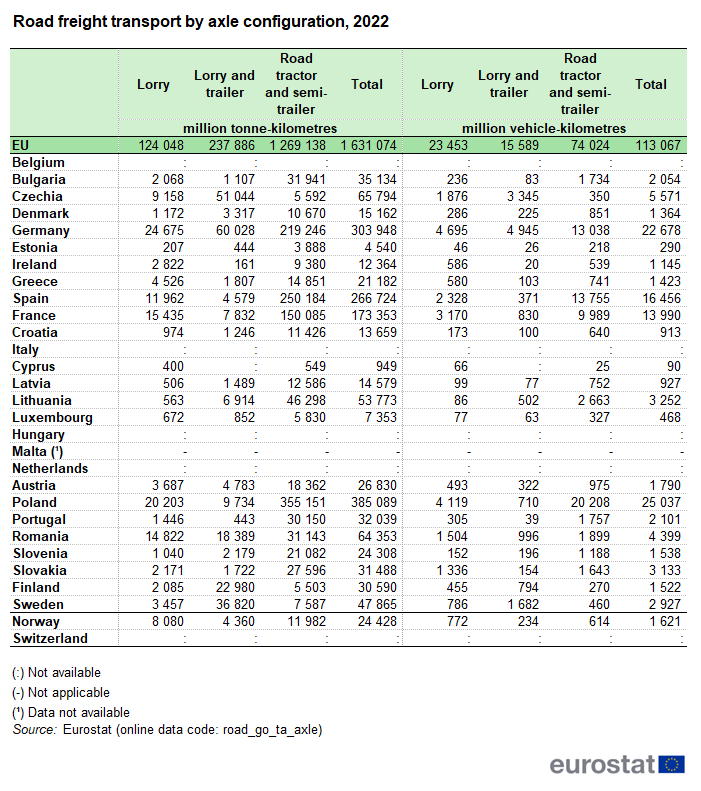
Road freight transport by axle configuration
Concerning road freight transport by axle configuration, road tractors attached to semi-trailers (road tractors and semi-trailers) performed in 2022 more than three-quarters (77.8 %) of the total tonne-kilometres in the EU. Correspondingly, lorries and lorries with trailers accounted for 22.2 % (see Table 5). At national level, road tractors and semi-trailers performed more than 60 % of total transport in 17 countries in 2022. Lorries and lorries with trailers performed the majority of tonne-kilometres only in Czechia (91.5 %), Sweden (84.1 %) and Finland (81.9 %).
In terms of the total vehicle-kilometres in the EU, road tractors and semi-trailers performed close to two-thirds (65.5 %), while lorries and lorries with trailers accounted together for more than one-third (34.5 %). At national level, road tractors and semi-trailers performed more than 60 % of total transport in 12 countries. Lorries and lorries with trailers performed together the majority of vehicle-kilometres only in Czechia (93.7 %), Sweden (84.3 %) and Finland (82.1 %). The data presented in this section are available for 22 EU Member States (see also the methodological notes).
Source data for tables and graphs
Context
Data presented in this publication were collected in the framework of Regulation (EU) No 70/2012 on statistical returns in respect of the carriage of goods by road (recast). These data are based on sample surveys carried out in the reporting countries, i.e. the EU Member States, Norway and Switzerland, and record the road goods transport undertaken by vehicles registered in these countries.
Reporting countries use their own national surveys for the collection of data based on returns from road hauliers. The results are microdata referring to vehicles and their linked journeys providing detailed information on goods transported. At the European level, common aggregation procedures have been used that might diverge from national practices. Therefore, differences might occur between the figures in this publication and national values.
Country specific notes
Croatia: While Croatia had no obligation to report data prior to their accession to the EU in 2013, it started reporting data from reference year 2008 onwards.
France: Following a partial redesign of the survey in 2020, the calculation of the weighting factors for the vehicles was impacted. This change in the weighting factors affects the final number of vehicles in the different categories by maximum permissible laden weight and load capacity. For the time being, data should be considered as provisional as the redesign exercise is ongoing.
Malta: Regulation (EU) No 70/2012 does not apply to Malta, as long as the number of Maltese registered goods road transport vehicles licensed to engage in international transport does not exceed 400 vehicles.
Finland: National and international surveys have been harmonised and follow a common methodology from the first quarter of 2011 onwards, leading to a break in time series in 2011.
Sweden: A break in series occurred in 2014 following a change in methodology. On the basis of a specific survey, Sweden corrected the European road freight survey results for trucks which were not in use over the surveyed period but still part of the survey sample.
Liechtenstein: Liechtenstein reports only international road freight. Starting with the reference year 2014, Liechtenstein is exempted from reporting road freight data.
Methodological notes
The road freight transport survey (RFTS) data is a collection based on sample surveys carried out in the reporting countries, which have the right to exclude from their surveys different types of vehicles. Such choices are allowed by Regulation (EU) No 70/2012 on the carriage of goods by road, which permits the exclusion from the survey of road vehicles with a load capacity (LC) of less than 3.5 tonnes or with a maximum permissible laden weight (MPLW) below 6 tonnes. In this context, some countries consider goods vehicles with a load capacity less than 3.5 tonnes (e.g. 1 or 2 tonnes) and some others are using the maximum permissible laden weight as a threshold for their survey vehicles (e.g. more than 6 tonnes). For more insight on what types of vehicles each country considers for the RFTS, please consult the manual 'Methodologies used in road freight transport surveys in EU Member States, EFTA and candidate countries — 2021 edition'.
The aforementioned choices have an impact on the number of goods vehicles stock reported by each country and disseminated in Eurostat's database.
EU totals calculated in this publication refer to road freight transport reported by the EU Member States, excluding Malta which is not reporting road freight statistics. Certain totals might be different from the sum of their components (e.g. summing up the data by axle configuration for one year will give a slightly different result than the total value). This is due to the use of the 'u' flag (for unreliable data). By using this flag, values behind it are not considered in the detailed data, whereas they are included in the totals.
Road freight transport by axle configuration is an optional variable. Therefore, not all countries report this variable. The EU total in this case is calculated as the sum of available data.
Vehicle-kilometre (vkm): Unit of measurement representing the movement of a road motor vehicle over one kilometre (loaded or empty). Units made up of a road tractor with a semi-trailer or of a lorry with a trailer are counted as one vehicle. The distance taken into account is the distance actually driven. It excludes any distance covered while the goods road vehicle is itself being transported by another means of transport, e.g. by rail or by sea.
Data availability: The figures presented in this publication have been extracted from Eurostat's free dissemination database and reflect the state of data availability in September 2023.
In this article:
- 1 billion = 1 000 000 000
- "- "not applicable
- ": "not available
Direct access to
- Transport, see:
- Road transport (t_road)
- Transport, see:
- Road transport (road)
- Road freight transport measurement (road_go)
- Key figures on European transport — 2022 edition - Statistical book
- Eurostat regional yearbook — 2022 edition - Statistical book
- Energy, transport and environment statistics — 2020 edition - Statistical book
- Road freight transport measurement (ESMS metadata file)
- Glossary for transport statistics — 5th edition — 2019 — Manuals and guidelines
- Methodologies used in road freight transport surveys in Member States, EFTA and candidate countries — 2021 edition — Manuals and guidelines
- Road freight transport methodology — Revised edition, August 2017 — Manuals and guidelines
- Regulation (EU) No 70/2012 of 18 January 2012 on statistical returns in respect of the carriage of goods by road (recast)
- Regulation (EC) No 1304/2007 of 7 November 2007 amending Directive 95/64, Regulation (EC) No 1172/98, Regulations (EC) No 91/2003 and (EC) No 1365/2006 with respect to the establishment of NST 2007 as the unique classification for transported goods in certain transport modes
- Commission Regulation (EC) No 202/2010 amending Regulation (EC) No 6/2003 concerning the dissemination of statistics on the carriage of goods by road
