Electricity market indicators
Data extracted in March 2024.
Planned article update: June 2025.
Highlights
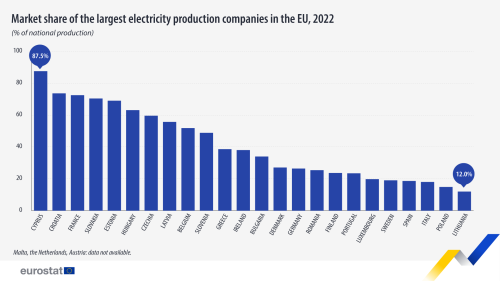
The market share of the largest generator in the electricity market in 2022 was 88% in Cyprus, 74% in Croatia and 72% in France.
This article takes a look at electricity markets in the European Union (EU), presenting recent statistical data on the number of electricity generating and retailing companies across EU countries, as well as Montenegro, North Macedonia, Serbia, Türkiye, Bosnia and Herzegovina, Kosovo*, Moldova and Georgia.
From 2013 to 2022, the number of main electricity generating companies (main = market coverage above 5 % of national electricity generation) in the European Union fluctuated between 80 and 87 companies, without a clear trend.
(*)This designation is without prejudice to positions on status, and is in line with UNSCR 1244/1999 and the ICJ Opinion on the Kosovo Declaration of Independence.
Full article
Electricity markets - generation and installed capacity
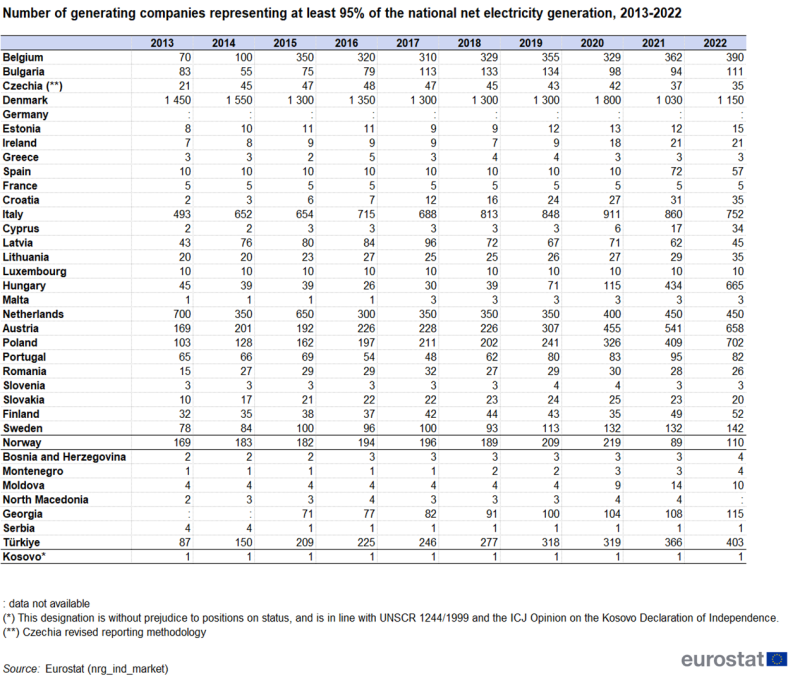
Table 1 refers to the number of companies cumulatively generating at least 95 % of net electricity generation at national level. In 2022, it remained limited to five companies or less in four EU countries. Between 2021 and 2022, it was stable in seven EU countries. Increases were observed in twelve EU countries (Table 1).
Source: Eurostat (nrg_ind_market)
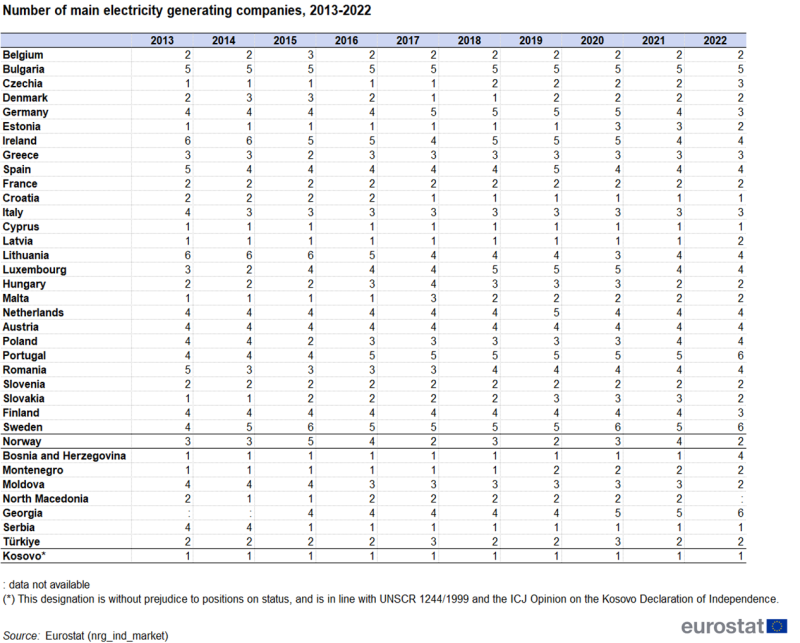
Table 2 displays the number of main companies that have a market coverage for at least 5 % of the total national net electricity generation.
Source: Eurostat (nrg_ind_market)
Two EU countries (Croatia and Cyprus) declared only one single enterprise, had a significant share of electricity generation at national level in 2022. This number of countries has decreased when compared to 2021 (when three countries reported one enterprise). In Bulgaria there were five electricity generating companies of considerable significance and in Portugal and Sweden there were six, increased by one, when compared to 2021.
The number of main enterprises in the EU fluctuated between 80 and 87 companies between 2013 and 2022.
As depicted in Figure 1, the lowest market coverage of main production companies was reported by Italy (33 %), which means that relatively small companies cover 67 % of Italy's total electricity market.
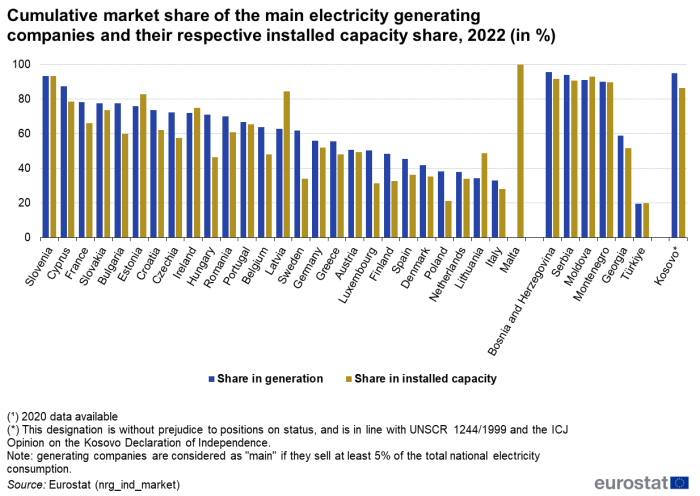
Source: Eurostat (nrg_ind_market)
Table 3 displays the percentage market share of the single largest national electricity generator's production in 2022. Cyprus and Croatia reported the highest percentage shares of 88 % and 74 %, respectively. Significant market dominance with figures of 70 % and above for the largest electricity generators were observed in France (72 %) and in Slovakia (70 %). By contrast, market shares of the largest electricity generation company below 20 % were observed in Spain (19 %), Sweden (19 %), Italy (18 %), Poland (15 %) and Lithuania (12 %).
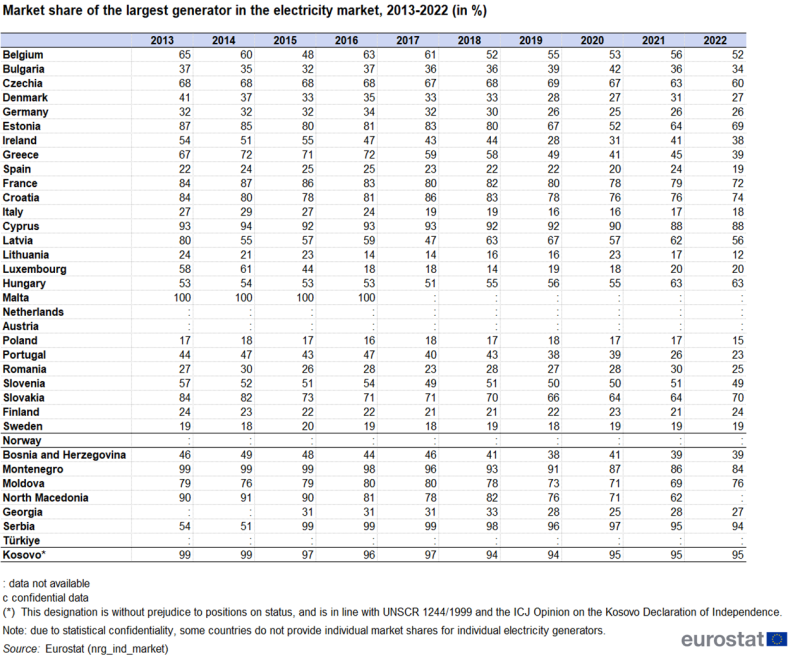
Source: Eurostat (nrg_ind_market)
EU countries also provided information on newly installed electricity generation capacity in 2022. Table 4 shows that the newly installed capacity increased from 43.7 Gigawatts (GW) in 2021 to 53.9 GW in 2022. This increase is mainly due to significant changes (in absolute terms) in Italy (+3.3 GW), then Spain (+2.2 GW) and Finland (+1.8 GW).
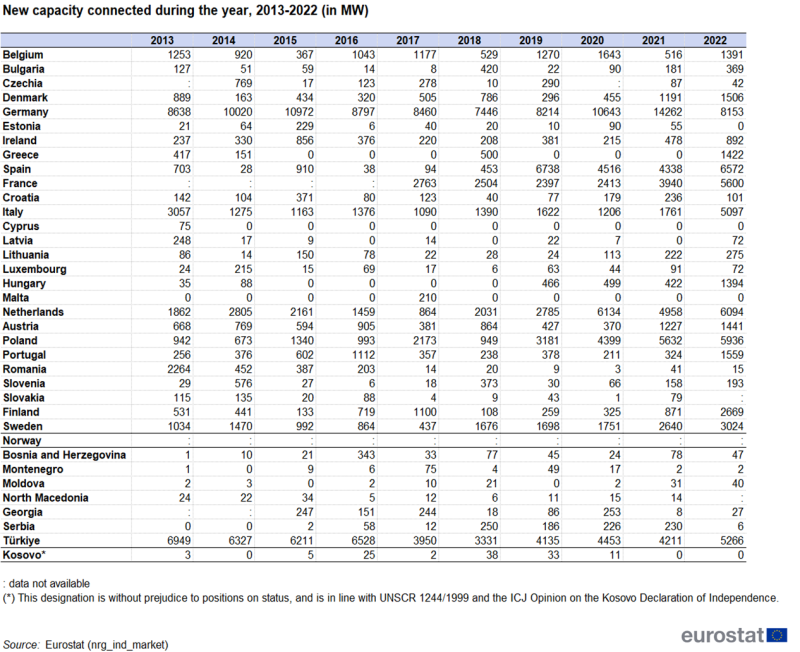
Source: Eurostat (nrg_ind_market)
Electricity markets - retail
All EU countries, as well as Montenegro, Serbia, Türkiye, Bosnia and Herzegovina, Kosovo, Moldova and Georgia reported information concerning the retailing (sales) sector.
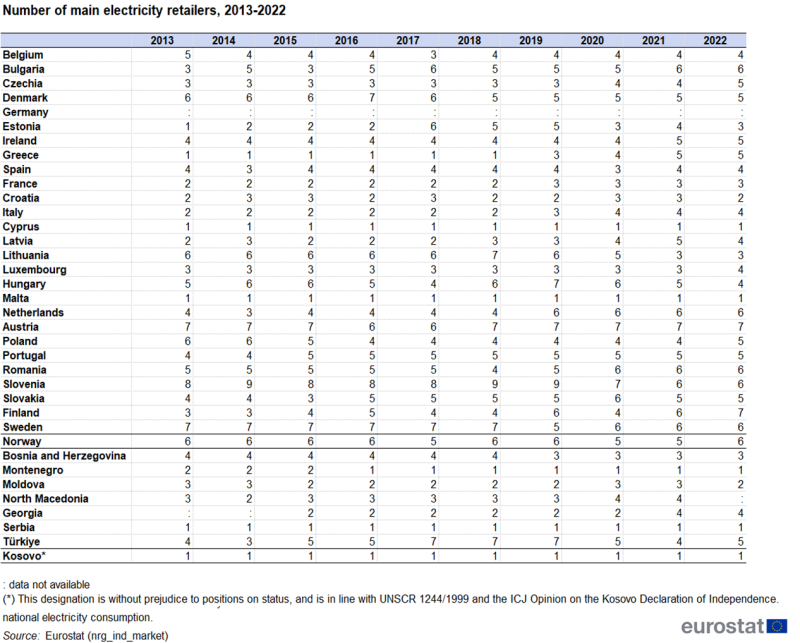
Table 5 presents information on the total number of retailers that sell electricity to final customers. When looking at the estimated number of retailers, it increased in the EU from 3437 in 2013 to 3927 in 2022 (the decrease in Czechia is due to different methodology).
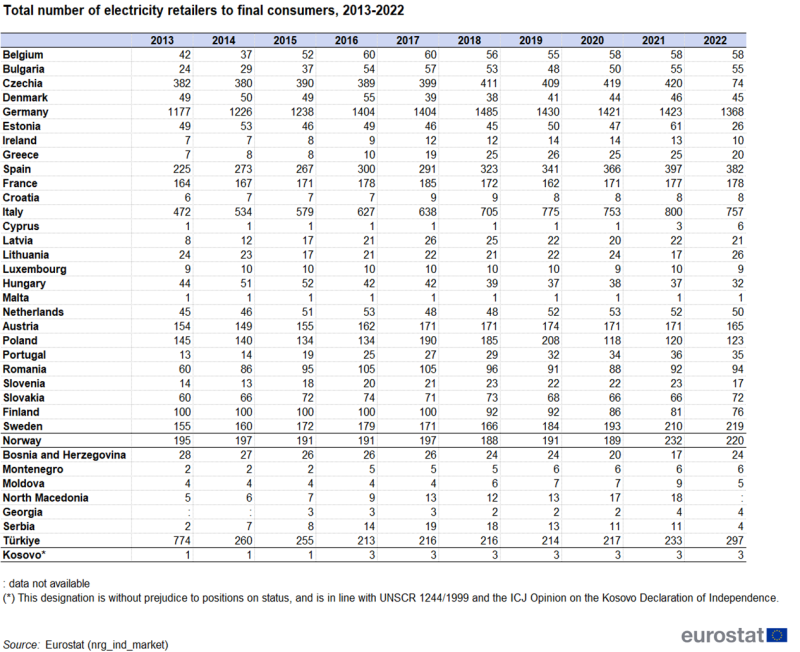
Source: Eurostat (nrg_ind_market)
Austria and Finland had seven electricity retailers with more than 5 % market share each in 2022. This was the largest number in the EU. Cyprus and Malta, had one main retailer each (see Table 6). Germany did not report the number of main retailers.
Figure 2 illustrates the number of main electricity retailers to final consumers and their cumulative market shares for all EU countries that reported the data, as well as for Montenegro, North Macedonia, Serbia, Türkiye, Bosnia and Herzegovina, Kosovo, Moldova and Georgia.
Looking at the remaining market, which is the market covered by non-main retail companies, their market share is largest in Italy and Sweden (47 % and 43.8 %, respectively). It is below 20 % in eleven out of the 25 EU countries that reported this indicator.
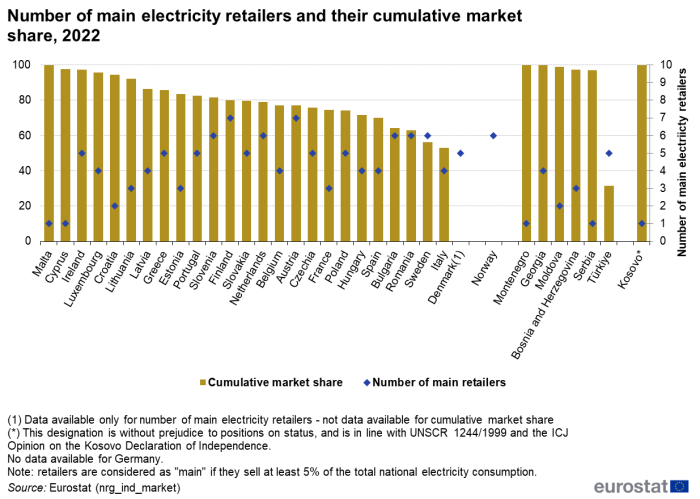
Source: Eurostat (nrg_ind_market)
Source data for tables and graphs
Data sources
The information on electricity market indicators is collected via a voluntary data collection. Although the participation of countries in this voluntary data collection is very high, sometimes the information on individual indicators is not available or is confidential.
The full dataset is available at
Context
The electricity market was liberalised for small business consumers in July 2004 and for all consumers in July 2007. However, initially the opening-up of markets faced a number of shortcomings and several legal packages followed. The most relevant recent ones are:
- On 1 January 2020, the Regulation (EU) No 2019/943 of 5 June 2019 on the internal market for electricity entered into force. An important part of the new electricity market design, agreed under the Clean energy for all European's package, the regulation establishes the fundamental principles for an efficient electricity market.
- In the framework of Clean energy for all Europeans package, the Directive (EU) 2019/944 of 5 June 2019 on common rules for the internal market for electricity and amending Directive 2012/27/EU, was adopted. The focus of Directive (EU) 2019/944, among others, is: "The internal market for electricity, which has been progressively implemented throughout the Union since 1999, aims, by organising competitive electricity markets across country borders, to deliver real choice for all Union final customers, be they citizens or businesses, new business opportunities, competitive prices, efficient investment signals and higher standards of service, and to contribute to security of supply and sustainability."
- The Clean energy for all Europeans package key part is to make the EU electricity market fit for the clean energy transition.
- Regulation (EU) 2019/942 of 5 June 2019 establishing a European Union Agency for the Cooperation of Energy Regulators.
Direct access to
Other articles
Database
- Energy (nrg), see:
- Energy statistics - market structure indicators - natural gas and electricity (nrg_market)
- Energy market indicator (nrg_ind_market)
- Energy Statistics - quantities (nrg_quant)
- Energy Statistics - quantities, annual data (nrg_quanta)
- Supply, transformation and consumption - commodity balances (nrg_cb)
- Supply, transformation and consumption of electricity (nrg_cb_e)
- Supply, transformation and consumption - commodity balances (nrg_cb)
- Energy Statistics - quantities, monthly data (nrg_quantm)
- Energy statistics - supply, transformation, consumption (nrg_10m)
- Supply of electricity - monthly data (nrg_105m)
- Energy statistics - supply, transformation, consumption (nrg_10m)
- Energy Statistics - quantities, annual data (nrg_quanta)
- Energy statistics - prices of natural gas and electricity (nrg_price)
- Energy statistics - natural gas and electricity prices (from 2007 onwards) (nrg_pc)
- Electricity prices for household consumers - bi-annual data (from 2007 onwards) (nrg_pc_204)
- Electricity prices for non-household consumers - bi-annual data (from 2007 onwards) (nrg_pc_205)
- Household consumption volumes of electricity by consumption bands (nrg_pc_204_v)
- Non-household consumption volumes of electricity by consumption bands (nrg_pc_205_v)
- Electricity prices components for household consumers - annual data (from 2007 onwards) (nrg_pc_204_c)
- Electricity prices components for non-household consumers - annual data (from 2007 onwards) (nrg_pc_205_c)
- Energy statistics - natural gas and electricity prices (from 2007 onwards) (nrg_pc)
Dedicated section
Visualisations
Methodology
- Energy Statistics - quantities, annual data (ESMS metadata file — nrg_quant_esms)
Legislation
- Directive (EU) 2019/944 of 5 June 2019 on common rules for the internal market for electricity and amending Directive 2012/27/EU
- Summaries of EU legislation: Internal market in electricity (from 2021)
- Regulation (EU) No 2019/942 of 5 June 2019 establishing a European Union Agency for the Cooperation of Energy Regulators
- Summaries of EU legislation: Agency for the cooperation of national energy regulators
- Regulation (EU) No 2019/943 of 5 June 2019 on the internal market for electricity
- Summaries of EU legislation: Cross-border exchanges in electricity
