Causes of death statistics by age group
Data extracted in March 2024.
Planned article update: April 2025.
Highlights
Among older people (aged 65 years and over), the standardised death rate from circulatory diseases in 2021 was higher for men than for women in all EU Member States.
The lowest standardised death rate from circulatory disease among people aged 65 years and over in 2021 was reported in France and the highest in Bulgaria.
In the population aged less than 65 years, the highest standardised death rate from COVID-19 among the EU Member States in 2021 was reported for Bulgaria. The highest rates among older people were in Bulgaria and Slovakia.
The standardised death rate from COVID-19 in 2021 was higher for men aged 65 years and over than for women aged 65 years and over in all EU Member States, with the largest relative difference in Estonia.
Standardised death rate for deaths from COVID-19 among people aged 65 years and over, by sex, 2021
This article uses the most recent statistics on causes of death in the European Union (EU). It is important to identify and record the underlying reasons for deaths and make this information available to policymakers, health services and the public. With these data, it is possible to describe and understand the rate and trends in mortality.
The data also serve to give information on changing epidemiological circumstances. Most causes of death vary significantly by age and by sex. This article gives an overview of standardised death rates for the EU as a whole and for EU Member States with analyses by country of residence and age of the deceased. The use of standardised death rates facilitates comparisons both over time and between countries, independent of different population age structures.
This article is one of a set of statistical articles concerning health status in the EU which forms part of an online publication on health statistics.
Full article
Most frequent causes of death in the EU in 2021
There were 5.3 million deaths of residents in the European Union (EU) in 2021. Among these, 4.5 million (84.4 % of the total) occurred among people aged 65 years and over (hereafter referred to as elderly people); the remaining 826 000 were among people aged less than 65 years. The principal causes of death and their related death rates differ between these age groups.
Just over one-third (34.7 %) of all deaths in the EU’s elderly population in 2021 was caused by diseases of the circulatory system (see Table 1). Nearly one in three of these (or 11.2 % of all deaths) was caused by ischaemic heart disease. The second most frequent cause of death among elderly people was cancer, accounting for one-fifth (20.0 %) of all deaths. The third most common cause of death among elderly people was COVID-19, accounting for just over one-tenth (10.9 %) of all deaths among elderly people.
Among residents of the EU aged less than 65 years, the two leading causes of mortality were reversed: cancer was the most frequent cause of death, accounting for 3 in 10 (30.6 %) deaths in this age group; diseases of the circulatory system were the second most frequent cause of death (19.6 % of the total). These two common causes were followed at some distance by external causes with an 10.6 % share (of which more than half were accidents).

Source: Eurostat (hlth_cd_asdr2) and (hlth_cd_aro)
Analyses by sex and age of the most frequent causes of death in the EU in 2021
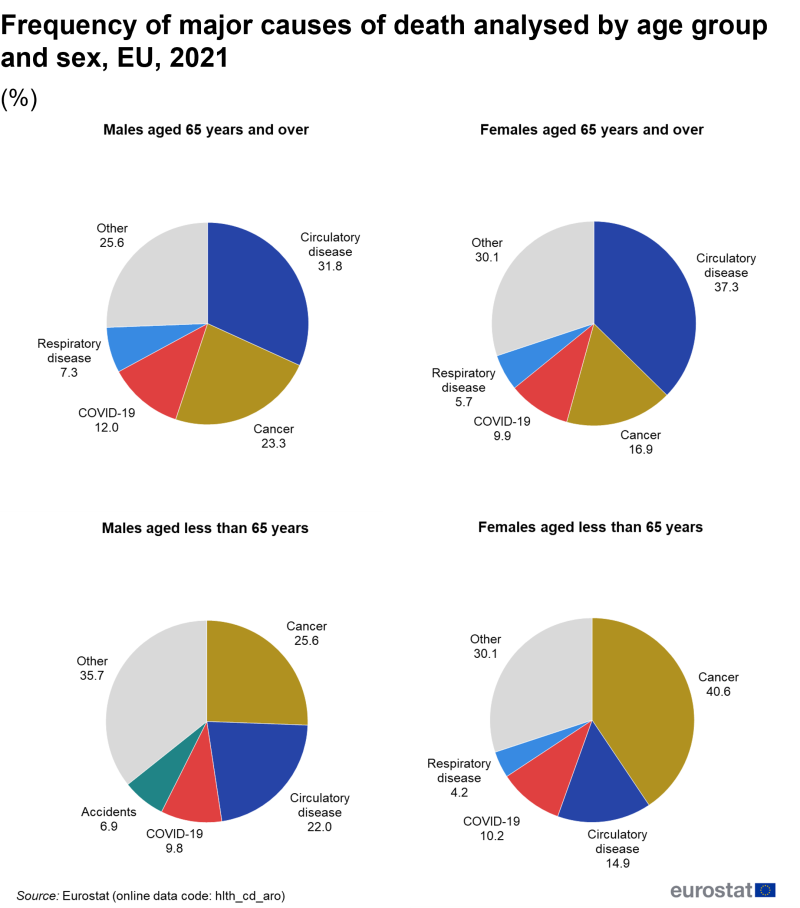
In the EU, circulatory diseases were a more frequent cause of death among elderly women than among elderly men. This disease accounted for 37.3 % of all deaths among elderly women in 2021 and 31.8 % of all deaths among elderly men – see Figure 1. The reverse situation was observed in 2021 for three other leading causes of death:
- cancer accounted for 16.9 % of all deaths among elderly women and 23.3 % among elderly men;
- COVID-19 accounted for 9.9 % of all deaths among elderly women and 12.0 % among elderly men;
- respiratory disease [1] accounted for 5.7 % of all deaths among elderly women and 7.3 % among elderly men.
Among EU residents aged less than 65 years who died in 2021, cancer was the principal cause of death for more than two-fifths (40.6 %) of females and more than one quarter (25.6 %) of males (see Figure 1). By contrast, circulatory diseases accounted for 14.9 % of all deaths among females aged less than 65 years compared with 22.0 % among males. The third most common cause of death among people aged less than 65 years was COVID-19, which accounted for 10.2 % of all deaths among females aged less than 65 years, compared with 9.8 % among males aged less than 65 years. As such, COVID-19 was, in 2021, a more common cause of death than accidents among people aged less than 65 years, where shares of 3.3 % for females and 6.9 % for males were recorded.
(%)
Source: Eurostat (hlth_cd_aro)
Standardised death rates – higher death rates among elderly people
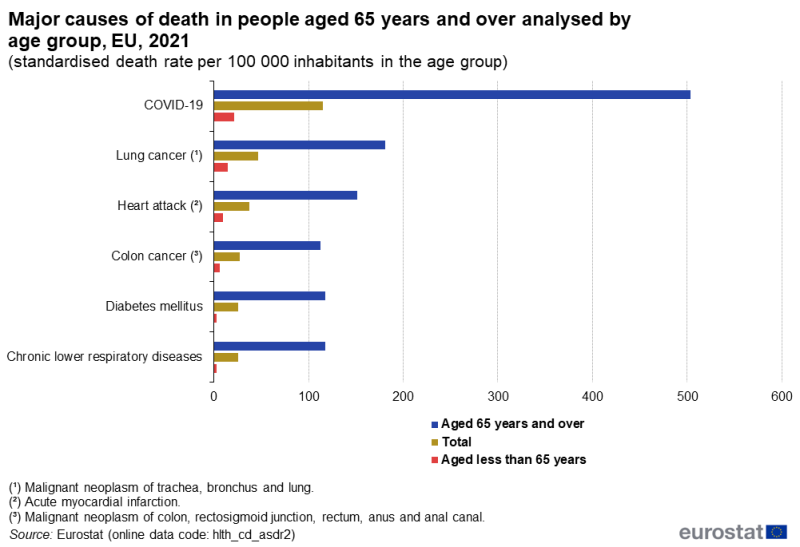
Standardised death rates in 2021 were systematically higher among elderly residents in the EU than among younger residents; this pattern was observed for the overall death rate and for each of the main causes of death among elderly people. Figure 2 shows the major conditions causing death among elderly people and for each of these the standardised death rate is shown for the whole population and both age groups.
- At this level of detail of the classification of causes of death, COVID-19 was, by far, the condition with the highest standardised death rate for the elderly population in 2021, with 504 deaths per 100 000 elderly inhabitants.
- Among people aged less than 65 years, this condition also had the highest rate, at 21 deaths per 100 000 inhabitants aged less than 65 years.
- Lung cancer was the condition with the second highest standardised death rate for the elderly population, with 181 deaths per 100 000 elderly inhabitants.
- Among people aged less than 65 years, this condition also had the second highest rate, at 15 deaths per 100 000 inhabitants aged less than 65 years.
(standardised death rate per 100 000 inhabitants in the age group)
Source: Eurostat (hlth_cd_asdr2)
Standardised death rates by country – circulatory disease
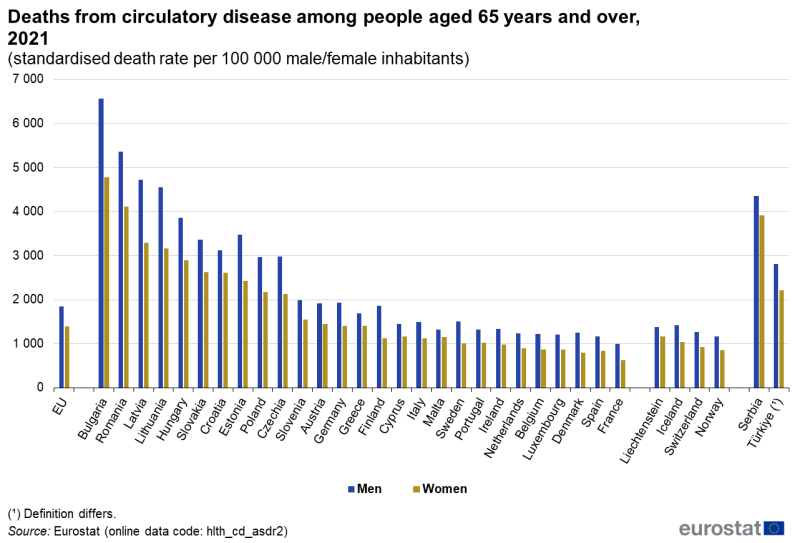
The standardised death rate from circulatory disease in 2021 was higher among elderly men than elderly women in all EU Member States (see Figure 3). The highest standardised death rates from circulatory disease among elderly men and elderly women were reported in Bulgaria, followed by Romania.
France was the only EU Member State to report a standardised death rate from circulatory disease among elderly men below 1 000 deaths per 100 000 male inhabitants in 2021, while rates below this level were reported for elderly women by seven Member States. In 2021, the lowest standardised death rates from circulatory disease within the elderly population were reported by France, 998 deaths per 100 000 male inhabitants and 632 deaths per 100 000 female inhabitants.
(standardised death rate per 100 000 male/female inhabitants)
Source: Eurostat (hlth_cd_asdr2)
Standardised death rates by country – COVID-19
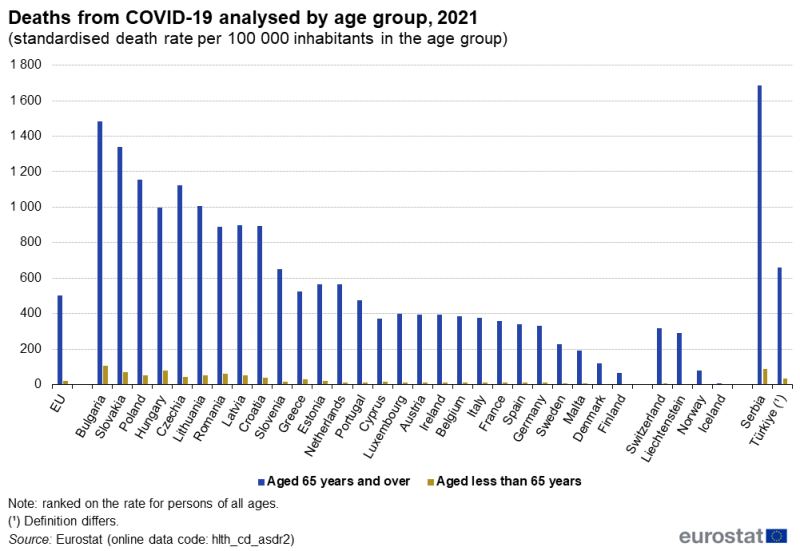
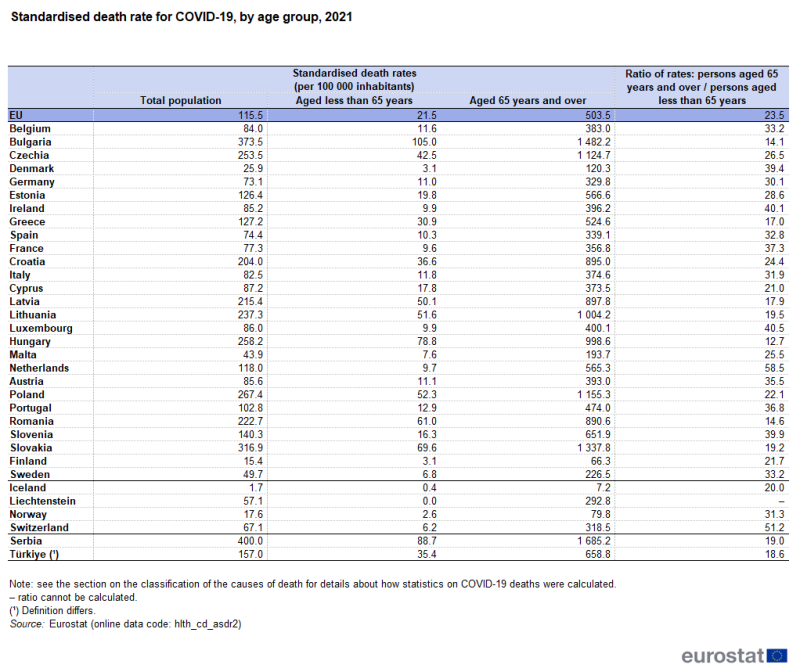
In 2021, the highest standardised death rates from COVID-19 among the EU Member States were observed in Bulgaria and Slovakia (see Figure 4); these high overall rates reflected particularly high death rates among elderly people, 1 482 and 1 338 per 100 000 people aged 65 years and over, respectively. The lowest standardised death rates from COVID-19 were observed in Denmark and Finland, which also had the lowest rates for elderly people, 120 and 66 per 100 000 people aged 65 years and over, respectively.
In all EU Member States, considerably higher standardised death rates from COVID-19 were observed in 2021 for elderly people than for people aged less than 65 years. In the Netherlands, the standardised death rate for elderly people was 58 times as high as the equivalent rate for people aged less than 65 years, the highest such ratio among the Member States. For the EU as a whole, the rate for elderly people was 23 times as high as for the younger age group. The lowest ratio between the rates for these two age groups was observed in Hungary, with the rate for elderly people 13 times as high as for those aged less than 65 years.
(standardised death rate per 100 000 inhabitants in the age group)
Source: Eurostat (hlth_cd_asdr2)
In the elderly population, the highest standardised death rates from COVID-19 in 2021 among the EU Member States were recorded for men in Bulgaria and Slovakia (see Figure 5). The same Member States also reported the highest standardised death rates from COVID-19 for elderly women. Equally, the lowest rates for elderly men and for elderly women were observed in Denmark and Finland. Among all elderly people (both sexes), the ratio between the standardised death rates in Bulgaria (the highest rates) and Finland (the lowest rates) was 22.4 : 1, with similar ratios for elderly men (21.0 : 1) and for elderly women (24.2 : 1).
In all EU Member States, the standardised death rate from COVID-19 was higher in 2021 among elderly men than among elderly women. Nevertheless, the range in this ratio was quite narrow (compared with some other causes of death): the largest gender difference was in Estonia, where the rate for elderly men was 2.2 times as high as that for elderly women, while the ratio was lowest (1.5 times as high) in Greece and Ireland.
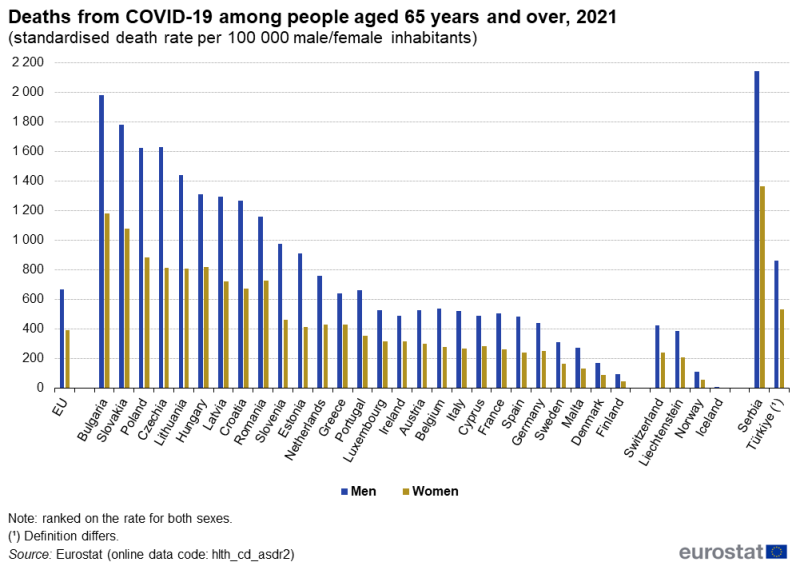
(standardised death rate per 100 000 male/female inhabitants)
Source: Eurostat (hlth_cd_asdr2)
In the EU, the standardised death rate from COVID-19 in 2021 was 23.5 times higher among elderly people (those aged 65 years and over) than among people under 65 years (see Table 2). Bulgaria reported the highest standardised death rate from COVID-19 among people aged 65 years and older, with 1 482 deaths per 100 000 elderly inhabitants. Thereafter followed Slovakia, Poland, Czechia and Lithuania, which reported over 1 000 deaths per 100 000 elderly persons. Within this age group, Finland reported the lowest standardised death rate with 66 deaths per 100 000 elderly inhabitants; no other EU Member State reported fewer than 100 deaths per 100 000 people over 65.
For those under the age of 65 years, the highest standardised death rate from COVID-19 was also reported by Bulgaria, with 105.0 deaths per 100 000 people under 65. Bulgaria was the only EU Member State to report a standardised death rate of more than 80.0 deaths per 100 000 people in this age group. Denmark and Finland reported the lowest standardised death rates, each with 3.1 deaths per 100 000 inhabitants under 65.
Source: Eurostat (hlth_cd_asdr2)
Developments over time
Men aged 65 years and over
Between 2011 and 2021, the EU standardised death rate of cerebrovascular disease for elderly men decreased by more than one quarter (down 29 %). Decreases of around one-fifth were observed for, ischaemic heart disease (down 20 %), lung cancer (down 19 %) and colorectal cancer (down 18 %). Among the eight causes of death shown in Figure 6, the smallest decrease in the standardised death rate was for prostate cancer which decreased 15 %. On the other hand, the EU standardised death rate of dementia for elderly men increased by over a third (up 33 %) during this time period, despite a 15 % decrease between 2018 and 2020. The EU standardised death rate of diabetes mellitus among elderly men increased by 7 %, largely due to a 12 % between 2019 and 2020. An increase was also observed for accidents (up 15 %).

(index based on standardised death rate per 100 000 inhabitants, 2011 = 100)
Source: Eurostat (hlth_cd_asdr2)
Women aged 65 years and over
Figure 7 shows the EU standardised death rates for selected major causes of death among elderly women in the EU between 2011 and 2021. Among elderly women the greatest decrease was observed for cerebrovascular disease which fell by 30 %, similar to the fall observed for elderly men. The rate for colorectal cancer was down 19 % for elderly women, similar to the fall observed for elderly men. Despite increases in the two most recent years, the rate for ischaemic heart disease for elderly women decreased by 25 %. As such, the overall decline in the rate for elderly women was larger than that observed for elderly men. For breast cancer, the decrease was relatively small, down 4 % overall, largely due to a fall of 3 % in 2021. Similarly, a decrease was also observed for diabetes mellitus (down 4 %) due to the 3 % fall in 2021, although similar to to elderly men, a relatively large increase (10 %) was observed in 2020. In contrast to the situation observed for elderly men, the standardised death rate for lung cancer increased every year in the EU among elderly women and the overall increase was 24 %. Similar to the situation observed in men, the largest increase was observed for dementia (up 37 %); the EU standardised death rate for accidents among elderly women also increased during this time period(up 15 %).
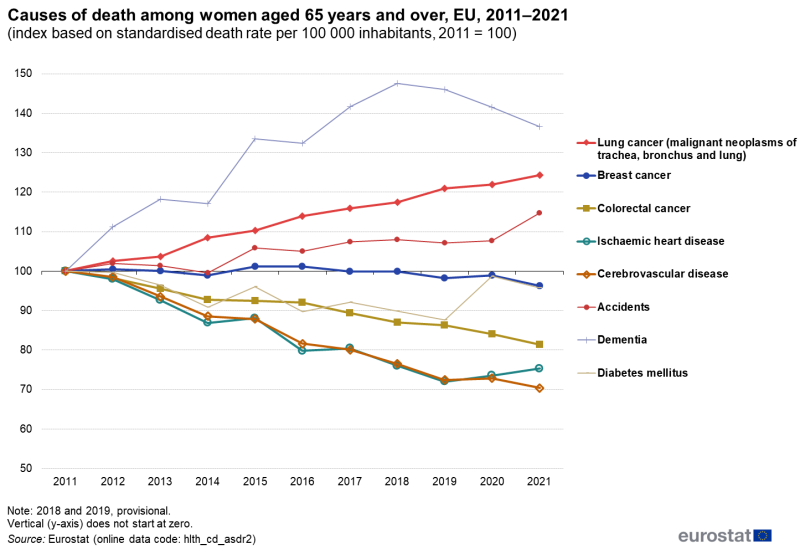
(index based on standardised death rate per 100 000 inhabitants, 2011 = 100)
Source: Eurostat (hlth_cd_asdr2)
People aged less than 65 years
The EU standardised death rate for people aged less than 65 years fell by 5 % between 2011 and 2021 (see Table 3). Larger than average decreases were noted for each of the three main causes of death. The standardised death rate for circulatory disease fell 17 %, that for accidents fell 20 % and that for cancer fell 23 %.
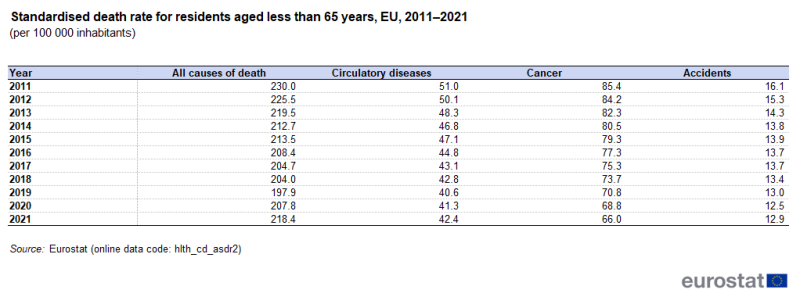
(per 100 000 inhabitants)
Source: Eurostat (hlth_cd_asdr2)
Source data for tables and graphs
Data sources
Statistics on the underlying causes of death provide information on mortality patterns. This source is documented in more detail in this background article which provides information on the scope of the data, its legal basis, the methodology employed, as well as related concepts and definitions.
Legal basis for the data collection
Since the 2011 reference year, reporting countries have submitted data to Eurostat based on the requirements of Regulation (EC) No 1338/2008 on Community statistics on public health and health and safety at work, and Regulation (EU) No 328/2011 on Community statistics on public health and health and safety at work, as regards statistics on causes of death. For data before the 2011 reference year, countries submitted data to Eurostat based on a gentleman’s agreement established within the context of Eurostat’s Working Group on Public Health Statistics.
There are currently 33 countries submitting data on the causes of death to Eurostat:
- all 27 EU Member States,
- EFTA countries (Iceland, Liechtenstein, Norway and Switzerland),
- two candidate countries (Serbia and Türkiye).
National and regional (NUTS level 2) data are collected.
Classification of the causes of death
Statistics on the causes of death are based on medical information provided in death certificates. Causes of death are classified by the 86 causes in the European shortlist which is based on the International Classification of Diseases and Related Health Problems.
When the COVID-19 pandemic started, the WHO introduced emergency codes in the ICD version 10 (ICD-10) that countries could use to report deaths from COVID-19. In Eurostat’s dissemination database, the codes are available as follows.
- U071 – COVID-19, virus identified (deaths where COVID-19 has been confirmed by laboratory testing)
- U072 – COVID-19, virus not identified (COVID-19 virus not identified)
- U_COV19_OTH – COVID-19 other (COVID-19 death not elsewhere defined)
The data for COVID-19 reported in this article were calculated by adding the data for these three codes, however the data disseminated in Eurostat’s dissemination database are for each separate code. More information about ICD-10 codes can be found here.
Standardised death rate
The number of deaths from a particular cause of death can be expressed relative to the size of the population. A standardised death rate is adjusted to a standard age distribution. This facilitates comparisons of rates over time and between countries. The European standard population used for the standardisation of crude rates is based on the European Standard Population (ESP) in use since summer 2013.
Context
Statistics on causes of death are among the oldest medical statistics available. They provide information on developments over time and differences between countries in causes of death. These statistics play a key role in the general information system relating to the state of health in the EU. They may be used to determine which preventive and medical-curative measures or which investments in research might increase the life expectancy of the population.
Statistics concerning causes of death among people aged 65 years and over (referred to in this article as elderly people) are of increasing interest. A dramatic change in the nature and delivery of healthcare over the past century has resulted in much longer life spans and a greater prevalence of chronic illnesses. This in turn has led to increased demand on healthcare systems, particularly for long-term care. Public health programmes throughout the EU are often targeted at reducing mortality among people aged less than 65 years through preventive measures, for example, the promotion of healthier lifestyles through improved nutrition, lower tobacco and alcohol consumption, an increase in physical activity or a reduction of workplace risk.
According to Eurostat’s 2023 baseline year projections, the share of the population aged 65 years and over in the EU is projected to increase relatively rapidly to 27.5 % of the total population by 2042 and then to 30.0 % by 2059 before increasing more slowly to 32.5 % by 2100; in 2023, the share was 21.3 %.
Direct access to
Online publications
Causes of death
- Causes of death statistics
- Causes of death – monthly statistics
- Preventable and treatable mortality statistics
Health status
Specific health conditions
- Accidents and injuries statistics
- Cardiovascular diseases statistics
- Cancer statistics
- Cancer statistics – specific cancers
- Respiratory diseases statistics
- Mental health and related issues statistics
Methodology
General health statistics articles
- Health (t_hlth)
- Causes of death (t_hlth_cdeath)
- Health (hlth)
- Causes of death (hlth_cdeath)
- Causes of death statistics (ESMS metadata file – hlth_cdeath_sims)
- Revision of the European Standard Population – Report of Eurostat’s task force – 2013 edition
Notes
- ↑ Data on respiratory diseases do not include COVID-19.