Archive:Statistics on regional typologies in the EU
Data extracted in March 2018.
Planned article update: none.
This Statistics Explained article is outdated and has been archived - for recent articles on Regions and cities see here.
Highlights
Almost half — 44.8 % — of the EU’s population was living in predominantly urban regions, compared with 36.0 % in intermediate regions and 19.2 % in predominantly rural regions.
Berlin was the only capital city metropolitan region in the EU with a level of GDP per person employed below the national average.
The European Union’s (EU’s) overall economic activity reflects a myriad of actions taken by different levels of government, enterprises and households. At a more detailed level, most economic processes have a specific territorial dimension — they are located in a fixed place — with the level of activity dependent, to some degree, upon a range of territorial assets, for example, transport or communications networks, access to services, natural resources, the supply or qualifications of the local labour force. This considerable geospatial diversity makes analysing the situation in different regions/areas a complex task.
Full article
Although not always the case, most of the articles within this publication show that regional differences for socioeconomic outcomes can often be greater within individual EU Member States than they are between national territories. For example, there is a considerable degree of variation in crude rates of population change between eastern and southern areas of Germany, while there are widespread socioeconomic differences between northern and southern parts of Italy. Differences such as these also exist at other territorial levels: for example, compare the socioeconomic situation in the wealthy, residential suburb of Neuilly-sur-Seine just to the west of Paris with that of Roubaix, a town in northern France characterised by wide-ranging challenges linked to de-industrialisation; or, alternatively the situation in the deprived coastal resort of Blackpool in the north-west of England with the affluent, technology-based economy of Cambridge.
Some of the most pressing challenges facing the EU — for example, globalisation, climate change, or social exclusion — have traditionally been approached through broad sectoral policies. However, as differences in economic performance between areas widened, policymakers have looked more closely at uneven spatial developments in the context of whether they are inevitable or even desirable: for example, does it make sense to have the same target for pollution in a city centre as in an area of natural beauty, or does it make sense to have the same target for educational attainment in a capital city as in a remote village? These critiques led to the development of place-based development policy, which highlights the need to reduce inefficiencies in a specific location by relying on local knowledge and capital to deliver a framework for promoting growth, and also resulted in a territorial dimension being introduced into a range of EU policy areas.
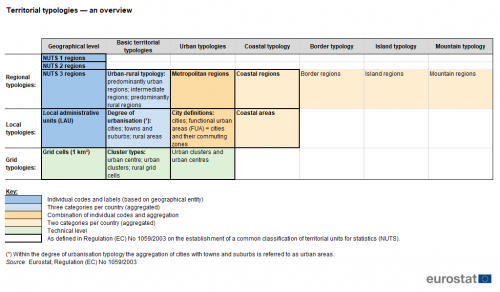
Grouping regions and areas according to territorial types can help in understanding common patterns: for example, urban areas/regions generally perform better in economic terms, and they often act as hubs for innovation and education; at the same time, they may also be characterised by a range of different challenges such as congestion, pollution or housing problems. In order to be able to analyse and understand these patterns, Eurostat has expanded the range of statistics that are published on a number of territorial typologies that may help categorise various administrative and functional areas. Figure 1 provides an overview of the main territorial typologies adopted by Eurostat: they form the basis for the statistics shown in this article, which presents examples of the wide-ranging analyses that may be performed. At their most basic level, these concepts can be split into two groups, those based on regional typologies and those based on local typologies. The former relate to statistics classified according to the classification of territorial units for statistics (NUTS); among others, this classification is used as the basis for allocating structural and investment funds between different regions of the EU. By contrast, local typologies are established for more detailed levels, with their basic geographical level that of the local administrative units (LAU), comprising the municipalities/communes of the EU. At an even more detailed level, Eurostat also collects information based on a 1 km² statistical grid, which is used for population-based territorial typologies. These building blocks — statistics by NUTS region, statistics by LAU, and statistics for 1 km² grids — can be aggregated into different typologies — as shown in Figure 1 — to allow a more comprehensive analysis of territorial patterns and developments in the EU.The EU integrated a number of territorial typologies into the NUTS regulation in December 2017: this underlines the importance of regional statistics as an important instrument for targeted policymaking and a useful tool for understanding and quantifying the impact of policy decisions in specific territories. The regulation provides a legal basis for the use of NUTS, LAU and 1 km² grid cells, as well as information as to how each of these relates to establishing a complementary set of EU territorial typologies.
- Grid-based information is used to establish: urban centres, urban clusters and rural grid cells;
- Statistics for local administrative units are used to establish:
- the degree of urbanisation (cities; towns and suburbs; rural areas);
- functional urban areas (cities and their surrounding commuting zones);
- coastal areas (coastal and non-coastal areas).
- Statistics at NUTS level 3 are used to establish:
- the urban-rural typology (predominantly urban regions, intermediate regions and predominantly rural regions);
- the metropolitan typology (metropolitan and non-metropolitan regions);
- the coastal typology (coastal and non-coastal regions).
By codifying these territorial typologies into a single legal text, it is hoped that they will be applied consistently and harmoniously across various stands of European legislation, while allowing for them to be cross-referenced from other acts and programmes. Note that the NUTS regulation does not provide a legal basis for border, island or mountain typologies.
Urban-rural typology
The urban-rural typology is based on statistics for NUTS level 3 regions: these are classified according to the density of population in 1 km² grid cells, through the share of the population living in urban clusters and rural grid cells, to identify:
- predominantly urban regions (NUTS level 3 regions where at least 80 % of the population live in urban clusters);
- intermediate regions (NUTS level 3 regions where between 50 % and 80 % of the population live in urban clusters);
- predominantly rural regions (NUTS level 3 regions where at least 50 % of the population live in rural grid cells).
In 2016, some 44.8 % of the EU-28 population was living in predominantly urban regions, while more than one third (36.0 %) were living in intermediate regions, and just under one fifth (19.2 %) in predominantly rural regions.
Around three quarters of the population in the Netherlands and the United Kingdom was living in a predominantly urban region, while more than half of the population in Ireland, Romania and Slovenia was living in a predominantly rural region
The statistics presented in Figure 2 confirm that there were considerable differences in terms of population distributions across the EU Member States. In 2016, the vast majority of the populations living in Malta (100.0 %), the United Kingdom (74.6 %) and the Netherlands (74.0 %) were concentrated in predominantly urban regions, while more than half of the total number of inhabitants from Spain, Belgium, Latvia and Sweden and a simple majority of the populations living in Italy, Portugal, Greece, Germany and France were also living in predominantly urban regions.
Several eastern and northern EU Member States were characterised by having the highest share of their populations living in intermediate regions. This was particularly the case in Bulgaria, where more than two thirds (68.5 %) of the total population lived in an intermediate region in 2016; the same was true for three out of every five persons living in Lithuania and Hungary. Otherwise, there were more people living in intermediate regions of the Czech Republic, Slovakia, Denmark and Poland than in either of the other two types of region. Although shares of 100.0 % in intermediate regions were recorded for Luxembourg and Cyprus, it is important to note that both of these are composed of a single region at NUTS level 3.
In Ireland, Slovenia and Romania, an absolute majority of the population was living in predominantly rural regions, this share peaking in Ireland (60.2 % in 2016). Predominantly rural regions also accounted for the highest share of the total number of inhabitants in Estonia, Croatia, Austria and Finland.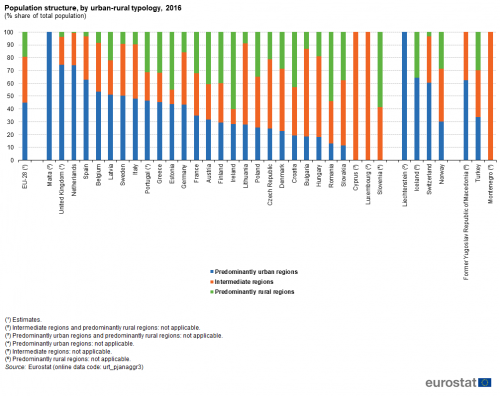
(% share of total population)
Source: Eurostat (urt_pjanaggr3)
GDP per inhabitant in the predominantly urban regions of Bulgaria, Hungary, Romania and Slovakia was at least 3.0 times as high as in predominantly rural regions
Figure 3 presents an alternative analysis based on the urban-rural typology. In 2016, gross domestic product (GDP) per inhabitant in purchasing power standards (PPS) — a unit that takes account of price level differences between countries — averaged 29 200 PPS in the EU-28; note that this derived indicator is often used as a measure for overall living standards, although it does not shed any light on income or poverty distributions.
While predominantly urban regions had the highest share of the EU-28 population, their relative weight in economic terms was even greater. GDP per inhabitant in the EU-28’s predominantly urban regions was 35 000 PPS, which was 38 % higher than for intermediate regions and 65 % higher than for predominantly rural regions.
A more detailed analysis among the EU Member States confirms that predominantly urban regions were consistently more productive, insofar as their GDP per inhabitant was at a higher level than for either intermediate regions or predominantly rural regions in each of the 24 Member States where all three different types of region are present. These differences were most pronounced in eastern EU Member States, for example: in 2016, GDP per inhabitant in the predominantly urban regions of Romania (2015 data), Hungary, Slovakia and Bulgaria, was at least 3.0 times as high as in their respective predominantly rural regions. Although the most productive forms of economic activity appear to be concentrated in predominantly urban regions, it is important to note that the ratio of GDP per inhabitant may, to some degree, be overstated. This is particularly true in those regions that are characterised by high numbers of commuters travelling across regional boundaries, as their economic output (the numerator) is attributed to the region where they work, while for the count of inhabitants (the denominator) they are attributed to the region where they live.
It is also interesting to note that the ratio between the highest and lowest level of GDP per inhabitant was lower for predominantly urban regions. Among the 24 EU Member States where all three different types of region are present, Ireland had the highest level of GDP per inhabitant for predominantly urban regions (62 900 PPS), which was 2.5 times as high as the lowest ratio in Latvia (25 000 PPS; 2015 data). For predominantly rural regions, the highest level of GDP per inhabitant was also recorded in Ireland (32 700 PPS), which was 3.2 times as high as in Bulgaria (10 100 PPS). Finally, Austria had the highest level of GDP per inhabitant for intermediate regions (42 100 PPS; 2015 data), some 4.0 times as high as in Bulgaria (10 600 PPS).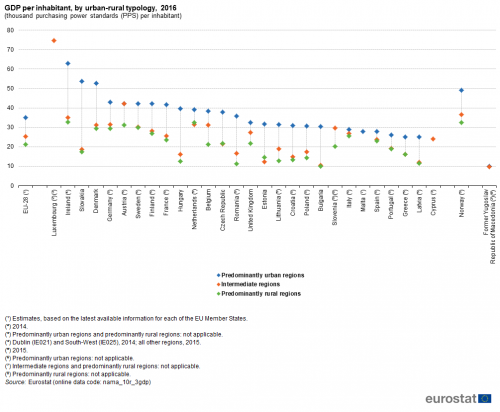
(thousand purchasing power standards (PPS) per inhabitant)
Source: Eurostat (nama_10r_3gdp)
Metropolitan regions
Metropolitan regions are a single or an aggregation of NUTS level 3 region(s) in which at least 50 % of the population live in functional urban areas of at least 250 000 inhabitants. The classification is based on identifying urban centres — contiguous grid cells of 1 km² with a population density of at least 1 500 inhabitants per km² and a minimum population of 50 000 inhabitants. These are subsequently used to identify cities and their surrounding commuter zones (where at least 15 % of the population commutes to work in that city). In a final step, each NUTS level 3 region is assessed to see if it contains a functional urban area — in other words, a city and its commuting zone — of more than 250 000 inhabitants. The typology distinguishes between capital city metropolitan regions, second-tier metropolitan regions, and smaller metropolitan regions.
There were 296.3 million people living in the EU’s metropolitan regions in 2016; as such, metropolitan regions accounted for almost three out of every five inhabitants. The highest numbers of people living in metropolitan regions were in Germany (55.3 million), France (43.8 million) and the United Kingdom (43.3 million). In relative terms, all of the population (100.0 %) in Cyprus and Luxembourg lived in metropolitan regions (note both of these are single regions at NUTS level 3), while the next highest share was recorded in Malta (92.7 %; composed of two NUTS level 3 regions). Otherwise, more than 65.0 % of the total population lived in metropolitan regions in Spain (69.2 %), Denmark (69.0 %), Germany (67.5 %), the United Kingdom (66.2 %) and France (65.6 %). These figures confirm that the largest and most concentrated populations living in metropolitan regions were predominantly found in western parts of the EU.
Figure 4 also shows the speed at which metropolitan populations were expanding. The fastest growth rate, 2.1 % per annum during the period 2006-2016, was recorded in Luxembourg, while Cyprus, Ireland, Sweden and Malta all saw their metropolitan populations increase by 1.1-1.3 % per annum. By contrast, the total number of people living in the metropolitan regions of Romania, Greece, Lithuania and Latvia declined during the period 2006-2016.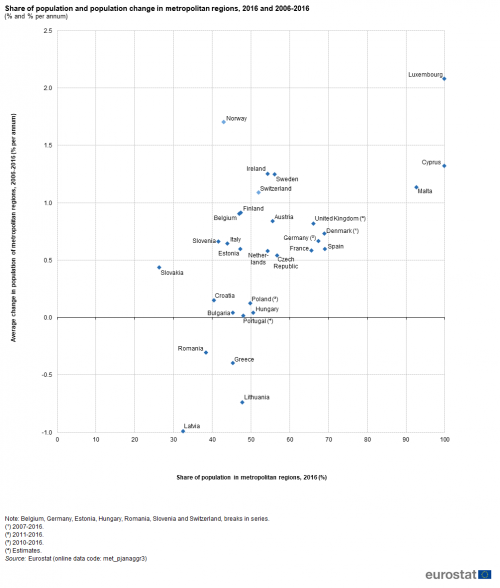
(% and % per annum)
Source: Eurostat (met_pjanaggr3)
Economic activity was highly concentrated in metropolitan regions: based on the latest information available, these regions contributed almost 72 % of the EU-28’s GDP, which could be contrasted against their share of the total population, which was just less than 60 %; as noted above, some of this difference may be attributed to the daily flow of commuters that swell the size of metropolitan workforces and their levels of economic activity.
GDP per person employed in the Romanian capital city metropolitan region of Bucuresti was more than twice as high as the national average
In order to demonstrate the concentration of economic activity in metropolitan regions, Map 1 contrasts levels of GDP per person employed in metropolitan and non-metropolitan regions; note that the information shown is presented in relation to national averages (which are set equal to 100). One of the most striking aspects of the map is that average GDP per person employed in non-metropolitan regions was consistently lower than the national average. In 2015, this pattern was particularly pronounced in Bulgaria (2016 data), the Baltic Member States (Estonia; 2016 data), Ireland (2014 data), Greece, Malta (2016 data) and Romania, where GDP per person employed for non-metropolitan regions was less than 85 % of the national average.
At the other end of the range, there were 16 metropolitan regions where average GDP per person employed was at least 30.0 % higher than the national average in 2015 (as shown by the darkest blue shade in the map). Several of these highly productive metropolitan regions were capital cities, principally located in eastern parts of the EU: Warszawa (Poland), Bratislava (Slovakia; 2016 data), Sofia (Bulgaria; 2016 data) and Bucuresti (Romania). Based on this relative measure, productivity was particularly high in Bucuresti, as its GDP per person employed was more than twice the national average (203.2 %; 2015 data); the next highest ratios in the EU were recorded in two further Romanian metropolitan regions, namely, Constanta (on the Black Sea; 170.9 %) and Cluj-Napoca (north-west Romania; 149.9 %) and there were three more metropolitan regions in Romania — Timisoara, Brasov and Ploiesti — where GDP per person employed was at least 30.0 % higher than the national average. The remaining capital city metropolitan regions where GDP per person employed was at least 30.0 % higher than the national average were Vilnius (Lithuania), Paris (France) and London (the United Kingdom). It is interesting to note the monocentric distribution of productivity across France and the United Kingdom, as the vast majority of their second-tier and smaller metropolitan regions recorded average levels of GDP per person employed that were below the national average, emphasising the dominant position of their capital cities. A similar pattern was also observed in the Nordic and Baltic Member States, the Czech Republic, Greece and Portugal, although their capital city metropolitan regions did not reach a level of GDP per person employed that was 30.0 % or more above their national averages.
By contrast, there were two neighbouring, metropolitan regions in the south of Germany where GDP per person employed was at least 30.0 % higher than the national average in 2015 — Ingolstadt and München — while productivity levels were almost as high in Frankfurt am Main, Stuttgart and Düsseldorf; this would suggest a more polycentric pattern to the distribution of productivity across Germany. It is also interesting to note that Berlin was the only capital city metropolitan region to report GDP per person employed below its national average. Such a polycentric distribution of relatively high levels of productivity was also evident in Poland and the Netherlands, as well as northern parts of Italy and Spain.
Map 1 shows that there were 49 metropolitan regions in the EU where GDP per person employed was less than 85 % of the national average. More than half of these 49 regions were located in the United Kingdom (16 regions) and Germany (14 regions), although there were also six regions from Poland and four regions from each of France and Italy. The lowest levels of productivity in the United Kingdom were in the metropolitan regions of Doncaster, Stoke-On-Trent, Medway, Kirklees, Cardiff, Kingston upon Hull, Swansea and Middlesbrough, while the lowest levels in Germany were in Schwerin, Neubrandenburg, Görlitz, Erfurt, Dresden, Rostock and Leipzig. Many of these are former industrial heartlands that have been left behind by economic developments, for example, the impact of globalisation and de-industrialisation and/or reunification in the case of eastern German regions, underlying why the policy debate often focuses on rebalancing economic activity.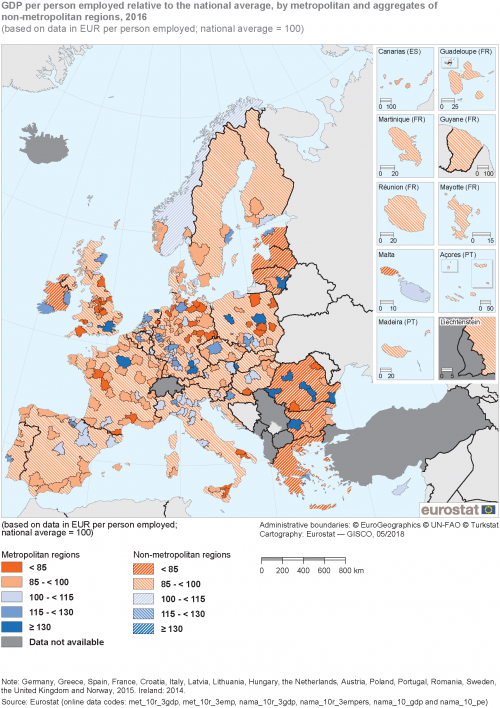
(based on data in EUR per person employed; national average = 100)
Source: Eurostat (met_10r_3gdp), (met_10r_3emp), (nama_10r_3gdp), (nama_10r_3empers), (nama_10_gdp) and (nama_10_pe)
Coastal regions
The coastal typology establishes a classification of EU coastal and non-coastal regions for NUTS level 3 regions. Coastal regions are defined according to one of the following three criteria:
- the region has a sea border (448 different regions in the EU, EFTA and candidate countries);
- the region has more than half of its population residing within 50 km of the sea, based on data using a 1 km² statistical grid (an additional 87 regions);
- the region is Hamburg in Germany, where there is a strong maritime influence (a single region).
As such, Map 2 shows information for the 536 coastal regions, detailing the crude rate of net migration across the 23 EU Member States with a coastline; note there are five landlocked Member States — the Czech Republic, Luxembourg, Hungary, Austria and Slovakia. It is important to note that the statistics presented refer exclusively to migrant flows with other countries (EU Member States and non-member countries) and that they exclude any movements between different regions of the same Member State.
Among EU coastal regions, the highest crude rates of net migration were recorded in the Greek islands of Lesvos, Limnos, Ikaria and Samos, each of which is located in the Aegean Sea, close to Turkey
In 2016, the crude rate of net migration for the EU-28 was 2.4 per 1 000 inhabitants, with the total number of inhabitants living in the EU-28 increasing by 1.2 million as a result of migrant flows between the EU-28 and non-member countries. Map 2 shows that net migration was usually positive in EU coastal regions: there were 355 regions that had positive rates of net migration, compared with 121 that had negative rates, while six regions had no change. Some of the highest crude rates of net migration were recorded for the coastal regions of Germany and Sweden, as well as the islands of Greece, Spain and Malta.
Looking in more detail, the highest crude rates of net migration were recorded in the Greek island regions of Lesvos, Limnos (49.2 per 1 000 inhabitants) and Ikaria, Samos (38.3 per 1 000 inhabitants); both of these regions are located in the Aegean Sea and they were common destinations for asylum seekers and migrants travelling by sea between Turkey and the EU. The three next highest crude rates of net migration — each with a rate that was within the range of 20.0-23.0 per 1 000 inhabitants — were disparately spread across the EU territory: Malta, Kalmar län (in the south-east of Sweden) and Fuerteventura (the second largest of the Canary Islands).
It is also interesting to contrast patterns between coastal and non-coastal regions: for example, in France and Portugal, crude rates of net migration to most coastal regions were considerably higher than for non-coastal (interior) regions. One potential explanation for these differences is that a higher proportion of retirees prefer to move to coastal regions, especially those with more clement climates; note that coastal regions in both northern France and northern Portugal experienced negative rates of net migration.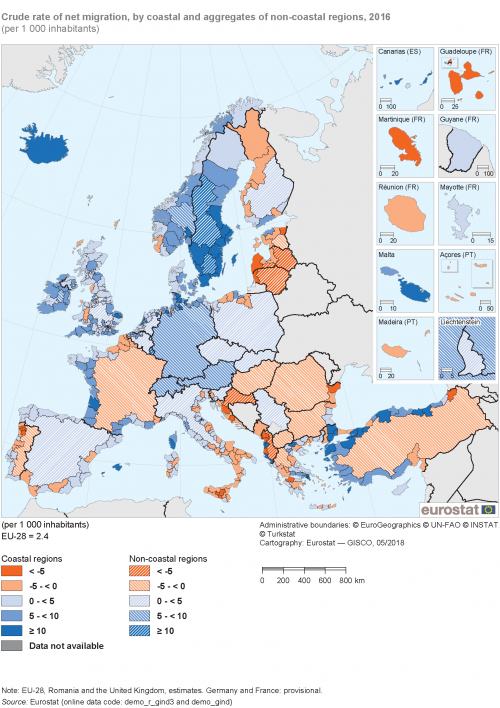
(per 1 000 inhabitants)
Source: Eurostat (demo_r_gind3) and (demo_gind)
Border regions
The classification of EU border and non-border regions is established for NUTS level 3 regions and is based on those regions that have population within 25 km of a land (as opposed to maritime) border. Two main types of border region can be distinguished:
- internal border regions — those regions that share a common border with regions in other EU Member States and/or European Free Trade Area (EFTA) countries;
- external border regions — those regions that are characterised by a common border with countries outside the EU and EFTA.
Location theories traditionally suggested that border regions were likely to suffer from lower levels of attractiveness as national boundaries divided markets. Furthermore, border regions tended to have lower levels of economic activity and poorer infrastructure, which may have prompted some enterprises to settle in regions closer to the geographical centre (where they were better connected to a critical mass of customers). The launch of the European single market in 1993 removed many of these impediments and sought to establish the four freedoms, guaranteeing the free movement of goods, services, capital and labour across the EU. As well as encouraging competition, these changes also drove a process of economic integration, which was stimulated further by successive enlargements. As a result, some border regions in the EU have found themselves at the centre of an integrated market of more than 500 million consumers, with their close proximity to a border losing some of its relevance, as people and goods flow freely between countries. Most of the main cross-border commuting flows in the EU are centred on western Europe, with Switzerland and Luxembourg attracting large numbers of commuters from their neighbouring Member States. That said, the majority of border regions in the EU continue to underperform for a variety of socioeconomic indicators when compared with results at a national level.
Employment rates tended to be lower for border regions than for non-border regions
There are 475 NUTS level 3 regions within the EU that are considered as border regions. Figure 5 aggregates this data to show employment rates among the working-age population (defined here as persons aged 20-64 years) for border and non-border regions. In a majority of the 21 EU Member States for which data exists for both border and non-border regions in 2016, the employment rate was higher for non-border regions. The biggest differences in favour of non-border regions were in several Baltic and eastern Member States, as well as Finland; many of these are characterised by the fact that they share an eastern border with neighbouring non-member countries.
On the other hand, employment rates were higher in border regions (than in non-border regions) in Italy, Slovenia, Spain, Denmark, Romania and Belgium. The situation in Italy was of particular interest insofar as the employment rate for border regions was 12.0 percentage points higher than for non-border regions and reflects, in part, relatively high numbers of Italians from the northern regions of Piemonte and Lombardia crossing the border each day to work in neighbouring Switzerland.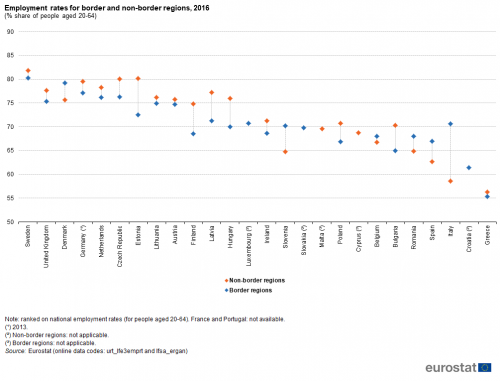
(% share of people aged 20-64)
Source: Eurostat (urt_lfe3emprt) and (lfsa_ergan)
Island regions
As for border regions, the territorial typology used for island regions is established on the basis of NUTS level 3 regions. They are territories with: a minimum surface of 1 km²; a minimum distance of 1 km between the island and the mainland; a resident population of more than 50 inhabitants; no fixed link (for example, a bridge or tunnel) between the island and the mainland. On this basis, there are 70 island regions in the EU, they are subdivided into the following categories:
- major island with <50 000 inhabitants;
- major island with 50 000 - <100 000 inhabitants;
- major island with 100 000 - <250 000 inhabitants;
- island with 250 000 - <1 000 000 inhabitants;
- island with ≥1 000 000 inhabitants.
As with other territorial typologies, island regions are diverse: some are popular holiday destinations (for example, Mallorca in Spain or Kyklades in Greece), others exercise considerable autonomous powers (for example, Região Autónoma da Madeira in Portugal or Åland in Finland), while others are outermost regions of the EU (for example, Guadeloupe or Mayotte in France). That said, smaller island regions may suffer from their insularity, which often means that they have lower levels of economic activity than regions that are located within mainland Europe.
GDP per inhabitant in the island regions of Greece, Spain and Italy was systematically lower than the EU-28 average
Figure 6 shows data for a selection of island regions, namely, those from Greece, Spain and Italy; note that at NUTS level 3 some of the larger Mediterranean islands — like Sardegna or Sicilia in Italy — are divided into two or more regions (this is also the case for some other islands in the EU not shown in Figure 6 — for example, Ireland, Corse in France or Northern Ireland in the United Kingdom).
In 2015, GDP per inhabitant in the EU-28 averaged 29 000 PPS. The average level of economic output per inhabitant was somewhat lower in Italy (27 700 PPS) and Spain (26 300 PPS) and considerably lower in Greece (20 200 PPS). Looking in more detail, it is interesting to note that none of these island regions had a level of GDP per inhabitant that was as high as the EU-28 average in 2015. Equally, the pace of economic growth per inhabitant during the period 2005-2015 was systematically lower than the EU-28 average (2.2 % per annum) in each of the Greek, Spanish and Italian island regions.
Comparing the levels of economic activity between the island regions of Italy, none of them had a level of GDP per inhabitant that was above the Italian national average. In 2015, economic output per inhabitant ranged from an average of 14 600 PPS in Medio Campidano (south-east Sardegna; which was 52.7 % of the Italian national average) to 24 600 PPS in Cagliari (the capital city region of Sardegna; 88.8 %). A similar situation was observed among the Spanish island regions in 2015, although Mallorca (one of the Illes Balears) was an exception, as its GDP per inhabitant was 8.0 % higher than the Spanish national average. The lowest level of economic activity among the Spanish island regions was in El Hierro (one of the Canary Islands), as its GDP per inhabitant averaged 19 000 PPS (72.2 % of the national average). A similar analysis for the Greek island regions reveals there were two regions where GDP per inhabitant was higher than the national average in 2015: Kyklades (in the Aegean Sea; 32.2 % higher) and Zakynthos (in the Ionian Sea; 6.9 % higher). By contrast, the lowest level of GDP per inhabitant among the Greek island regions was in Chios (also in the Aegean Sea; 73.3 % of the national average).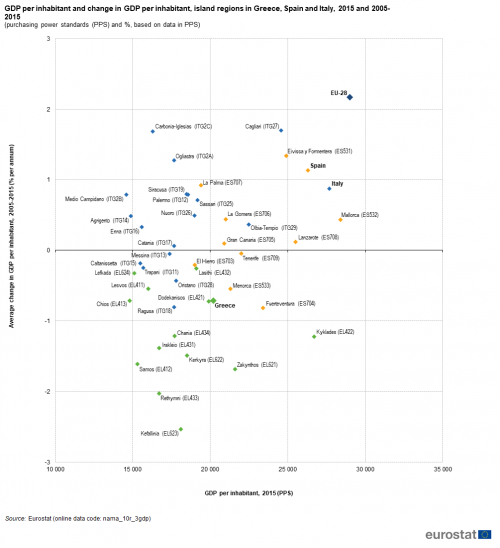
(purchasing power standards (PPS) and %, based on data in PPS)
Source: Eurostat (nama_10r_3gdp)
Mountain regions
The final typology covered in this article concerns mountain regions. As for border and island regions this typology is established for NUTS level 3 regions. A mountain region is defined as one in which more than 50 % of the surface is covered by topographic mountain areas, or a region in which more than 50 % of the regional population lives in a topographic mountain area. There are 322 mountain regions in the EU, they are subdivided into the following categories:
- regions where > 50 % of the total population lives in mountain areas;
- regions where > 50 % of surface area is in mountain areas;
- regions where > 50 % of population and > 50 % of the surface area are in mountain areas.
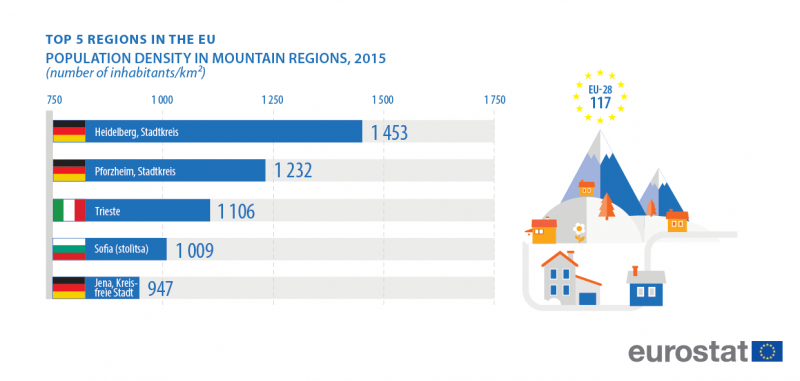
As for island regions, problems linked to marginalisation may also impact mountain regions. Other problems are congestion and overcrowding (and related problems) in major valleys that form transit routes. Map 3 contrasts population density in mountain and non-mountain regions: there were, on average, 117.1 inhabitants per km² across the whole of the EU-28 in 2015. A closer analysis reveals that population density was lower than the EU-28 average for 198 mountain regions, while 124 mountain regions had higher ratios.
The least densely populated mountain regions in the EU were in remote areas
There were 17 mountain regions in the EU where population density was lower than 25.0 inhabitants per km² in 2015 (as shown by the lightest shade of blue): four of these were located in Spain, three in each of France and Austria, two in each of Greece and the United Kingdom, and single regions from each of Croatia, Portugal and Sweden. It is interesting to note that the lowest population density ratios were generally recorded in remote regions rather than the highest mountain ranges (where the impact of tourism may, at least in part, have led to more economic development and higher numbers of inhabitants). There were just five mountain regions in the EU where population density fell to less than 10 inhabitants per km²: Teruel in Aragon (eastern Spain); Licko-senjska županija to the north of Zadar (Croatia); Caithness & Sutherland and Ross & Cromarty as well as Lochaber, Skye & Lochalsh, Arran & Cumbrae and Argyll & Bute in northern Scotland (the United Kingdom) and Jämtlands län (in the centre of Sweden).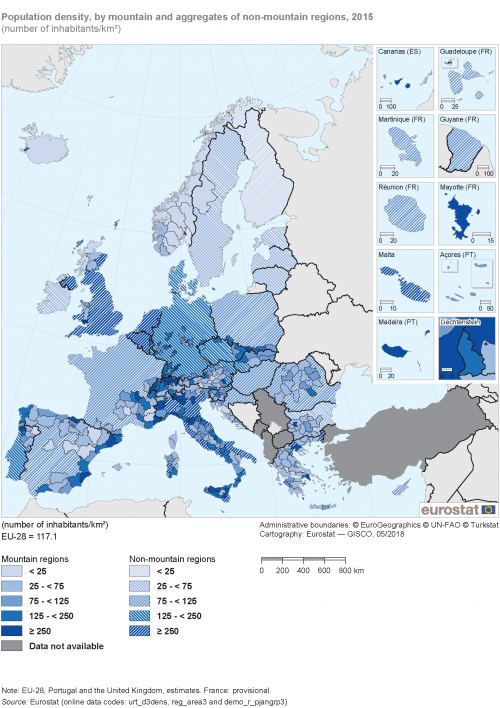
(number of inhabitants/km²)
Source: Eurostat (urt_d3dens), (reg_area3) and (demo_r_pjangrp3)
Source data for figures and maps
Data sources
Traditionally, territorial typologies were determined by population size and population density in local administrative units (LAU), such as communes, municipalities or local authorities. The typologies described here go beyond the confines of administrative territorial units, as they are based on a 1 km² statistical/population grid; this is stable over time — as each grid cell has the same shape and surface — which therefore avoids distortions and promotes comparable results that are exempt from historical and/or political circumstances, as is often the case for administrative boundaries. The population density of the grid cells is updated, when new Census data becomes available.
The typologies are based on the same basic building blocks: classifying statistical grid cells of 1 km² to a typology of clusters according to their similarities in terms of population size and density. For example, the urban-rural typology is based on the share of the population living in urban clusters and rural grid cells, whereby each grid cell is classified to one type of cluster only, using the following definitions:
- urban clusters: clusters of contiguous grid cells of 1 km² with a density of at least 300 inhabitants per km² and a minimum population of 5 000 inhabitants — the contiguity criteria for urban clusters includes diagonals (in other words, cells with only their corners touching);
- rural grid cells: grid cells with a density below 300 inhabitants per km² and other cells outside urban clusters.
Having classified each grid cell, the information can then be aggregated up into a variety of different typologies; these can be in the form of local typologies (based on LAU) or regional typologies (based on NUTS), with each area or region classified according to the population share of the different clusters. In the case of the urban-rural typology, NUTS level 3 regions are classified as follows:
- predominantly urban regions: where the rural population — in other words, the share of the population living in rural grid cells — accounts for less than 20 % of the total population;
- intermediate regions: where the rural population accounts for 20-50 % of the total population;
- predominantly rural regions: where the rural population accounts for 50 % or more of the total population.
In some cases, additional criteria may be added to take account of specific situations, for example, within the urban-rural typology, a region that is classified as predominantly rural becomes intermediate if it contains a city of more than 200 000 inhabitants representing at least 25 % of the region’s population, while a region classified as intermediate becomes predominantly urban if it contains a city of more than 500 000 inhabitants representing at least 25 % of the region’s population.
For more information:
Eurostat plans to release a methodological manual on territorial typologies during the autumn of 2018.
Context
The Lisbon Treaty identified territorial cohesion alongside economic and social cohesion as an objective for the EU. Regional policy is designed to reduce the gap between the development levels of the various regions. The main instruments for regional development include the cohesion fund, the regional development fund and the social fund, each designed to help finance a variety of projects in the EU’s regions and cities.
Issues such as coordinating policy in large areas such as the Mediterranean or Baltic Sea regions, promoting globally competitive and sustainable cities, addressing social exclusion in deprived urban neighbourhoods, or improving access to health care and education in remote regions are just some of the difficulties that are faced by areas and regions with specific geographic features. Territorial cohesion policy is designed to foster harmonious development, making sure that each area or region is able to make the most of its inherent features, thereby transforming diversity into an asset that contributes towards the EU’s sustainable development.
Over time, diverse regions and areas have been grouped together according to various criteria, reflecting different areas of policy attention and the specific challenges that they face. To study these differences, the European Commission has developed a range of territorial typologies, covering — among others — rural and urban areas, metropolitan regions, coastal and non-coastal regions and areas, border regions, island regions, or mountain regions. To promote cohesion and to provide a unique insight into developments at local and regional levels, these policy areas have to be supported by harmonised and reliable data at different territorial levels.
The EU’s urban development policy seeks to promote the economic, social and environmental transformations of cities through integrated and sustainable solutions. During the 2014-2020 funding period, EU policymakers have given increasing recognition to the important role that may be played by the urban dimension of regional policy, in particular, measures that are designed to assist in the fight against poverty and social exclusion. Indeed, the EU has put the urban dimension at the heart of cohesion policy, with at least half of the resources foreseen under the European Regional Development Fund (ERDF) being invested in urban areas. The EU’s regional policy will target, among others, urban development through:
- focusing investment priorities on issues such as sustainable urban mobility, the regeneration of deprived communities, or improved research and innovation capacity;
- committing at least 5 % of the European regional development fund to integrated sustainable urban development;
- setting-up an urban development network to be responsible for reviewing the deployment of European funds;
- encouraging cities to promote community-led local developments for urban regeneration.
The EU’s rural development policy is designed to help rural areas meet a wide range of economic, environmental and social challenges. Regulation (EU) No 1305/2013 details the reform of the EU’s rural development policy post-2013; it is the latest in a series of developments. Three long-term strategic objectives have been identified for the period 2014-2020: improving the competitiveness of agriculture; safeguarding the sustainable management of natural resources and climate action; and ensuring that the territorial development of rural areas is balanced. In keeping with other structural and investment funds, EU Member States and their regions draw up coordinated rural development programmes (RDPs). These programmes are financed through the European Agricultural Fund for Rural Development (EAFRD) which has a budget of EUR 100 billion for the period 2014-2020. Aside from the EAFRD, several other EU funds provide support to rural areas, namely: the European Regional Development Fund (ERDF), the European Social Fund (ESF), the Cohesion Fund and the European Maritime and Fisheries Fund.
The EU’s integrated maritime policy stresses the importance of coastal regions and it seeks to: maximise the sustainable use of the oceans and seas; support blue growth through the promotion of the marine and maritime sectors; enhance Europe’s knowledge and innovation potential in maritime affairs; ensure development and sustainable growth in coastal regions; strengthen Europe’s maritime leadership and raise the profile of maritime issues across Europe.
On 20 September 2017 the European Commission adopted a Communication, Boosting Growth and Cohesion in EU Border Regions (COM(2017) 534 final). It highlights ways to reduce the complexity, length and costs of cross-border interaction (for example, addressing legal and administrative barriers), while promoting the pooling of services along internal EU borders so that people living in border regions can take full advantage of the opportunities offered on both sides of a border. It is hoped that these initiatives will lead to socioeconomic improvements for those living in border regions, such that people may go about daily activities such as studying, training, working, or doing business regardless of the existence of an administrative national border.
Island regions of the EU are disparate in nature, with varying sizes, populations and levels of economic activity. There are, however, a range of common issues that impact particularly smaller islands, including: transportation issues linked to connectivity; environmental issues such as fragile ecosystems; underdeveloped economies that are characterised by a lack of diversification (outside of tourism-related activities); a declining and ageing population; seasonal and part-time employment; arrivals of migrants and asylum-seekers.
In June 2017, the European Commission jointly organised a conference on cohesion policy in mountain areas. It reflected on how to develop better a place-based and territorial approach to address the specific needs for developing mountain regions, with the goal of creating an agenda for mountainous regions, while supporting plans for the allocation of specific funds for mountain regions as part of the cohesion policy in the future.
Direct access to
- Degree of urbanisation classification — 2011 revision (background article)
- Geospatial analysis at Eurostat (background article)
- Population grids (background article)
- Archive:Regional typologies overview (background article)
- Territorial typologies (background article)
- Territorial typologies for European cities and metropolitan regions (background article)
- Degree of urbanisation (degurb)
- Metropolitan regions (met)
- Regional statistics by NUTS classification (reg)
- Tourism statistics by coastal areas (LAU2) (mare)
- Urban audit (urb), see:
- Cities and greater cities (urb_cgc)
- Functional urban areas (urb_luz)
- Perception survey results (urb_percep)
- Eurostat statistical atlas (Chapter 14)
- Border regions illustrated
- Coastal regions illustrated
- City statistics illustrated
- Degree of urbanisation illustrated
- Island regions illustrated
- Metropolitan regions illustrated
- Mountain regions illustrated
- Outermost regions illustrated
- Urban-rural typology illustrated
- A harmonised definition of cities and rural areas: the new degree of urbanisation — European Commission — 2014
- Cities in Europe — The new OECD-EC definition — European Commission — 2012
- Coastal regions and coastal areas in the EU
- Local administrative units (LAU)
- Metadata on city statistics (ESMS metadata file — urb_esms)
- Methodological manual on city statistics — Eurostat — 2017
- Tercet — territorial typologies
- Urban-rural typology
- European Commission — Cities and urban development
- European Commission — Regional and urban development — Boosting growth and cohesion in EU border regions
- European Commission — Regional and urban development — Outermost regions
- European Commission — Regional and urban development — Rural development
- European Commission — Territorial cohesion
Maps can be explored interactively using Eurostat’s statistical atlas (see user manual).
