Statistics Explained is both an electronic publishing platform and a gateway to Eurostat's statistical information, providing rich information on any statistical subject treated by Eurostat. Since it works in a way similar to Wikipedia, it is easy to use and easy to navigate.
Statistics Explained is:
- an encyclopaedia on European Union statistics;
- a portal to further information for both occasional and regular users;
- a statistical glossary.
Statistics Explained makes extensive use of hyperlinking and similar possibilities offered by the internet to provide seamless access to information at various levels. It contains statistical data and explanations, but also direct links to all kinds of relevant background information which may be useful to understand the statistics.
The content of Statistics Explained
Statistical articles are the core of Statistics Explained. Each set of statistics produced by Eurostat is described by one or several statistical articles.
The typical statistical article starts with an indication of the freshness of the data used and the forthcoming update date, followed by some tweetable main messages, an interactive graph and a short introduction. Then follows the article itself with clickable chapters and icons where further information can be found. Within the article, Data sources briefly describes how the data were obtained (for example, by which survey) as well as potential limitations and problems. Context discusses reasons behind the data collection and the uses that may be made of the data; it may refer to the legal basis, the policy context, the importance for politics, business or the society as a whole.
The statistical articles are supplemented by pages providing background information on statistics, either short glossary pages with definitions or more detailed background articles focusing on methodological issues rather than presenting data.
The easiest way to find a particular article in Statistics Explained is simply through a standard web search on keywords, as chances are high that the article will appear near the top of the ranking of results. A more focused way is to use the search function of Statistics Explained or the Eurostat main website.
Besides a search on keywords, two other navigation tools within Statistics Explained may help users find an article: statistical themes and categories.
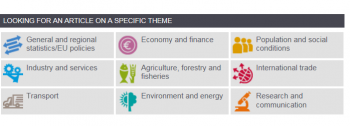
The hierarchy of statistical themes (and sub-themes) reflects the traditional logic of Eurostat’s website, where data and publications are grouped in one of nine statistical themes. The statistical themes are also easily found in the boxes on the main page under the title "Looking for a specific theme".
In a similar way categories are used for grouping articles, in a less formal way; categories are not classified in a hierarchy and new categories can be created if they are useful for grouping related articles. Categories are listed at the bottom of every article, and they are often used to find related articles. The categories are also easily found by clicking on a box on the main page.
An automatic translation in all EU languages is available by clicking on the blue icon “Translate” up in the right corner of the articles.


