Air pollution statistics - air emissions accounts
Data from December 2023
Next update of the article: December 2024
Highlights
Between 2008 and 2021, emissions of acidifying gases (ammonia, nitrogen oxides and sulphur dioxide) in the EU decreased by 38 %.
Between 2008 and 2021, emissions of ozone precursors (nitrogen oxides, non-methane volatile organic compounds, carbon monoxide and methane) in the EU decreased by 30 %.
Ozone precursor emissions by chemical compound, EU, 2008-2021
This article is about emissions of acidifying gases and ozone precursor substances classified by emitting economic activities. Eurostat records and publishes those in annual air emissions accounts (AEA), one of the modules in the European environmental economic accounts (for which the legal basis is Regulation (EU) No 691/2011). AEA are suited for integrated environmental economic analyses such as calculating emission intensities or 'footprints'.
In addition, Eurostat disseminates emissions of air pollutants classified by technical processes. These are recorded in emission inventories for air pollutants and form the official data for international policies on transboundary air pollution. Furthermore, Eurostat estimates and disseminates 'footprints' which are emissions of air pollutants classified by final products that are demanded by households or government, or that are invested in or exported.
Full article
Editorial note: Throughout this article, which deals with time periods when the United Kingdom was a Member State of the European Union, the acronym EU refers to the post-Brexit composition of the European Union as of 1 February 2020.
General overview
The EU emissions of acidifying gases (sulphur dioxide (SO2), nitrogen oxides (NOx) and ammonia (NH3)) have been continuously decreasing over the past years. In 2021, emissions of NH3 and NOx contributed 44 % and 43 %, respectively, while sulphur dioxide contributed 13 % to the total acidifying potential.
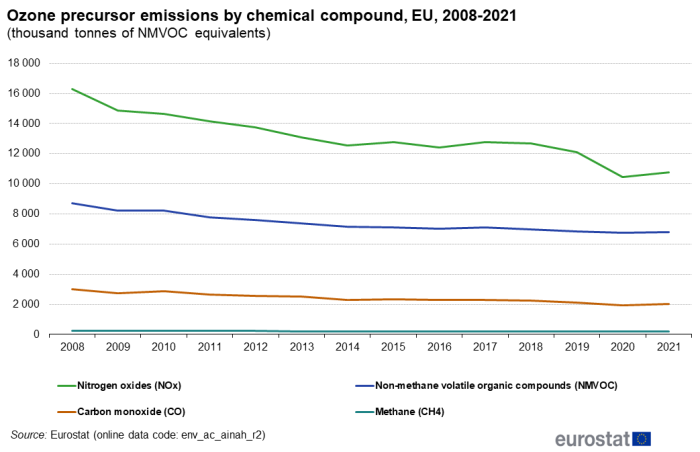
The EU emissions of ozone precursors (nitrogen oxides (NOx), methane (CH4), carbon monoxide (CO) and non-methane volatile organic compounds (NMVOC) have also been falling over the past years. In 2021, the main contributors to the tropospheric ozone formation potential were NOx and NMVOC with 54 % and 34 %, respectively.
Acidifying gases
Several air pollutants contribute to the acidification of the environment. The most important ones are sulphur dioxide (SO2), nitrogen oxides (NOx) and ammonia (NH3). The impact of SO2, NOx and NH3 can be observed in the progressive degradation of soils, water and forests. They also contribute to the formation of fine particles in the air that cause respiratory diseases. The acidifying potential of SO2, NOx and NH3 is commonly measured in SO2 equivalents (SO2 eq.).
Emissions of acidifying gases have been on a continuous decrease
The acidifying potential associated with EU residents' emissions has been continuously decreasing over the past decade (Figure 1). Between 2008 and 2021 emissions of the three main acidifying gases decreased by approximately 9 million tonnes of SO2 eq. to reach 14.4 million tonnes of SO2 eq. (-38 %). SO2 emissions decreased by 73 % and contributed 13 % to the total acidifying potential. NOx emissions decreased by 34 % and contributed 43 % to the total acidifying potential. Emissions of ammonia (NH3), quantitatively the most significant acidifying gas decreased by 10 % and contributed 44 % to the total acidifying potential.
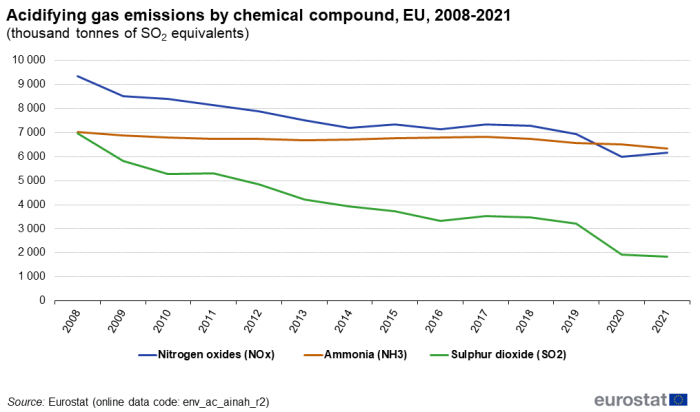
(thousand tonnes of SO2 equivalents)
Source: Eurostat (env_ac_ainah_r2)
Acidifying gas emissions by economic activity
Agriculture, forestry and fishing emits the most acidifying gases. In 2021, it contributed 47 % of the acidifying gases emitted by EU industries and households (Figure 2). Ammonia (NH3) is the most significant acidifying substance emitted by agriculture, forestry and fishing (Figure 3). In 2021, transportation and storage was the production activity with the second largest share (22 %) in total acidifying emissions (Figure 2). In this case, NOx was the dominant acidifying gas (Figure 3).
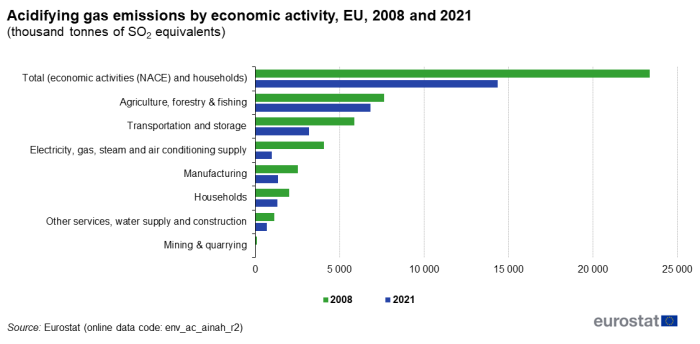
(thousand tonnes of SO2 equivalents)
Source: Eurostat (env_ac_ainah_r2)
Most activities recorded significant drops in acidifying gas emissions. The largest decrease was observed in electricity, gas, steam and air conditioning supply industry, which dropped from 1.1 million tonnes of SO2 eq. in 2008 to 1.0 million tonnes of SO2 eq. in 2021 (-76 %). A more systematic use of end-of-pipe pollution filters and the use of more efficient combustion technologies in electricity and heat production are the main contributors to this development.
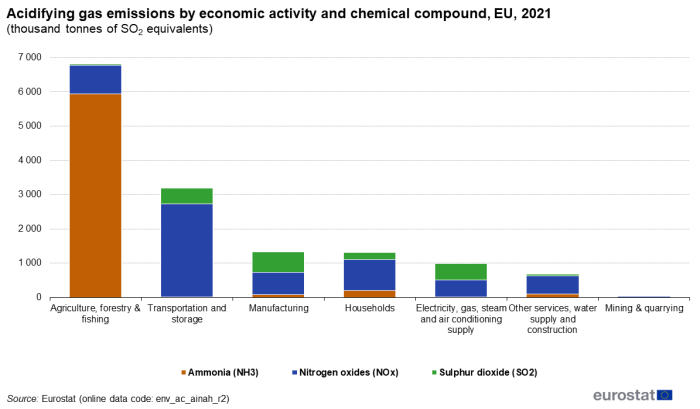
(thousand tonnes of SO2 equivalents)
Source: Eurostat (env_ac_ainah_r2)
Comparing acidifying gas emissions with gross value added
Figure 4 compares acidifying gas emissions (AGE) with the gross value added (GVA) of 64 production activities (NACE classification) in the EU in 2021. This breakdown into 64 production activities is the same that is used in economic statistics (national accounts), therefore enabling integrated analyses. In Figure 4 the production activities are in descending order of their acidifying gas emissions. Both bars (AGE and GVA) of each production activity show the cumulated percentage, in other words, the percentage of all the activities, which are to the left of the activity and the activity itself.
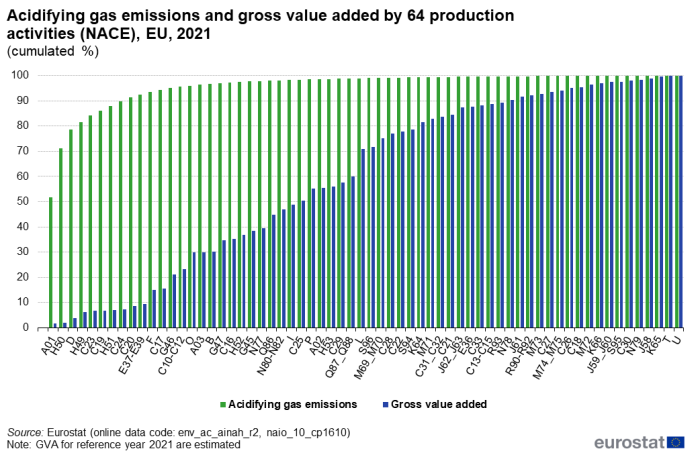
(cumulated %)
Source: Eurostat (env_ac_ainah_r2) and (naio_10_cp1610)
Figure 4 shows that the top five emitters account for 84 % of the total acidifying gas emissions of the 64 production activities, while these five production activities only contribute approximately 7 % to the gross domestic product (GDP) of the EU economy. These five production activities are crop and animal production, hunting and related service activities (NACE A01), water transport (NACE H50), electricity, gas, steam and air conditioning supply (NACE D), land transport and transport via pipelines (NACE H49) and manufacture of other non-metallic mineral products (NACE C23). The GDP is the sum of gross value added of the 64 production activities plus net taxes on products. In Figure 4 only the NACE codes of the production activities are given due to space restrictions. Their names and descriptions are available here.
Ozone precursors
Tropospheric ozone occurs when ozone precursor substances (i.e., non-methane volatile organic compounds (NMVOC), nitrogen oxides (NOx), carbon monoxide (CO) and methane (CH4)) react in the lower atmosphere in the presence of sunlight. High ozone levels occur during the warmer summer months as the sun makes, for example, exhaust fumes from vehicles react in the lower atmosphere. High ozone levels are known to damage human tissue and are a health risk, especially for people with respiratory problems. Through the National Emissions Ceilings Directive (NECD) and the Gothenburg Protocol under UNECE-CLRTAP (United Nations Economic Commission for Europe Convention on Long-range Transboundary Air Pollution), the EU focuses on the emissions of NOx and NMVOC as they are the most relevant of the four pollutants.
Emissions of ozone precursors have been on a continuous decrease, NOx is the most significant ozone precursor
From 2008 to 2021, the tropospheric ozone formation potential associated with EU residents' emissions of ozone precursors continuously decreased by 8.5 million tonnes of NMVOC equivalents (NMVOC eq.), to reach 19.8 million tonnes of NMVOC eq. (-30 %). The most significant ozone precursor NOx, decreased the most throughout the last twelve years (-5.6 million tonnes). NMVOC emissions decreased by 1.9 million tonnes and CO emissions decreased by 0.9 million tonnes NMVOC eq. (Figure 5).
(thousand tonnes of NMVOC equivalents)
Source: Eurostat (env_ac_ainah_r2)
Ozone precursor emissions by economic activity
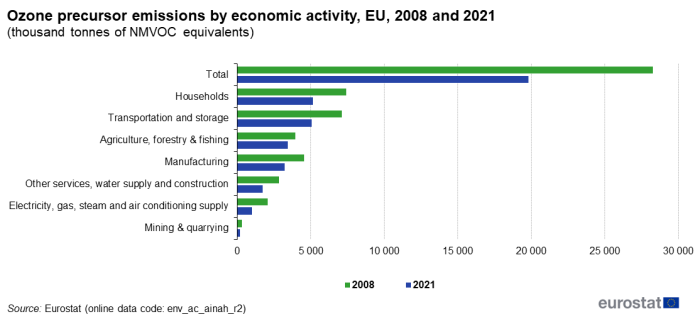
With 26 % each, private households and the transport industry contributed the most to total emissions of ozone precursors in 2021. Agriculture, forestry and fishing industry was the third largest emitter with 17 % (Figure 6).
Between 2008 and 2021, the largest absolute drop occurred in households (2.3 million tonnes of NMVOC eq. or -31 %). For the same period, the largest relative drop was observed in electricity, gas, steam and air conditioning supply with -52 %.
(thousand tonnes of NMVOC equivalents)
Source: Eurostat (env_ac_ainah_r2)
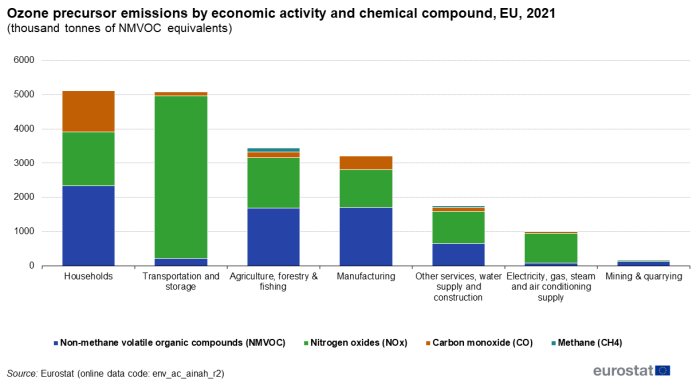
In 2021, NMVOC was the most significant ozone precursor emitted by households, manufacturing and agriculture. NOx was the most significant ozone precursor emitted by the transportation industry and the electricity, gas, steam and air conditioning industry (Figure 7).
(thousand tonnes of NMVOC equivalents)
Source: Eurostat (env_ac_ainah_r2)
Comparing ozone precursor emissions with gross value added
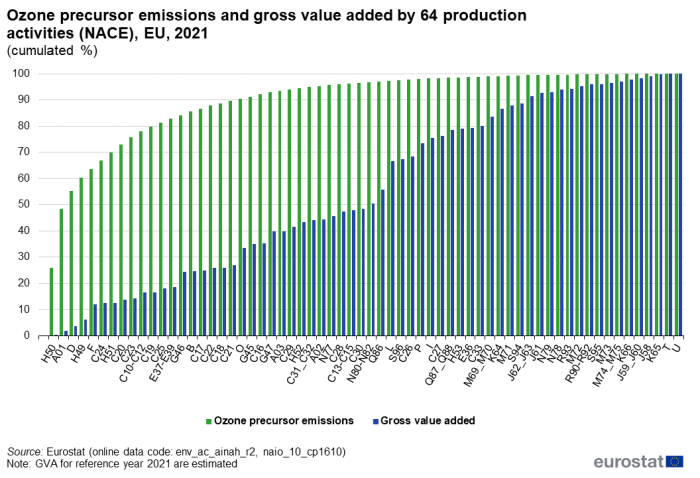
Figure 8 compares ozone precursor emissions (O3PR) with the gross value added (GVA) for 64 production activities (NACE classification) in the EU in 2021. This breakdown into 64 production activities is used for economic statistics (national accounts), therefore enabling integrated analyses. In Figure 8 the production activities are in descending order of their ozone precursor emissions. Both bars (O3PR and GVA) of each production activity show the cumulated percentage, in other words the percentage of all the activities, which are to the left of the activity and the activity itself.
(cumulated %)
Source: Eurostat (env_ac_ainah_r2) and (naio_10_cp1610)
Figure 8 shows that top five emitters account for nearly 64 % of ozone precursor emissions of the 64 production activities, while these top five production activities only contribute to 12 % of the gross domestic product (GDP). These five production activities are water transport (NACE H50), crop and animal production, hunting and related service activities (NACE A01), electricity, gas, steam and air conditioning supply (NACE D), land transport and transport via pipelines (NACE H49) and construction (NACE F). The GDP is the sum of gross value added of the 64 production activities plus net taxes on products. In Figure 8 only the NACE codes of the production activities are given due to space restrictions. Their names and descriptions are available here.
Source data for tables and graphs
Data sources
The basis for Eurostat's air emissions accounts is Regulation (EU) No 691/2011 on European environmental economic accounts.
Annual data are transmitted by the EU Member States, as well as the European Free Trade Association (EFTA) countries and some candidate countries.
Emissions of individual acidifying gases and ozone precursor substances are converted and aggregated to provide information for the environmental pressures 'acidifying potential' and 'tropospheric ozone formation potential'. They use common units (SO2 equivalent and NMVOC equivalent) to allow comparison and combination of the relative effect of different gases. For calculating SO2 equivalents the following conversion factors are used: nitrogen oxides 0.7, sulphur dioxide 1.0 and ammonia 1.9. For calculating NMVOC equivalents the following conversion factors are used: nitrogen oxides 1.22, non-methane volatile organic compounds 1.0, carbon monoxide 0.11 and methane 0.014.
In air emissions accounts, emission data are organised by economic activity, using NACE. This makes it possible to have an integrated environmental-economic analysis to supplement national accounts. Economic activities encompass production by all businesses resident in a country, including those operating ships, aircraft and other transportation equipment in other countries.
Air emissions accounts also include households as consumers. Their emissions are accounted for whenever household consumption is directly responsible for environmental pressures. For example, emissions from a privately owned car are counted under households, whereas cars owned by transport businesses (such as taxis) are counted under transport services.
The following activity groupings are used in this article:
- agriculture, forestry and fishing — NACE Rev. 2 Section A;
- mining and quarrying — NACE Rev. 2 Section B;
- manufacturing — NACE Rev. 2 Section C;
- electricity, gas, steam and air conditioning supply — NACE Rev. 2 Section D;
- transportation and storage — NACE Rev. 2 Section H;
- other services, water supply and construction — NACE Rev. 2 Sections E to G and I to U, in other words all remaining economic activities as defined in NACE;
- households — households as consumers.
Three perspectives of emission statistics for air pollutants
Eurostat presents three perspectives of emission statistics for air pollutants:
| Perspective | Statistical framework | Purpose | Related data set | Related SE article |
|---|---|---|---|---|
| 1. Emissions of air pollutants classified by economic activities | Air Emissions Accounts (AEA) by Eurostat | tailored for integrated environmental-economic analyses | env_air_aa | this article |
| 2. Emissions of air pollutants classified by technical processes | Emission inventories for air pollutants by UNECE (United Nations Economic Commission for Europe) | official international reporting framework for CLRTAP (Convention on Long-range Transboundary Air Pollution) | env_air_emis | link |
| 3. 'footprints' = Greenhouse gas (GHG) emissions classified by final use of products | Modelling results published by Eurostat | one particular analytical application of AEA | env_ac_io10 | not available |
Emissions accounts versus emission inventories
The main differences between air emissions accounts (AEA) and emission inventories for air pollutants are:
| Air emissions accounts – air pollutants (residence principle) | Emission inventories for air pollutants (territory principle) |
|---|---|
| Emissions are assigned to the country where the economic operator causing the emission is resident. | Emissions are assigned to the country where the emission takes place |
| Emissions are classified by economic activity, following the NACE classification of the system of national accounts. | Emissions are assigned to processes classified according to their technical nature (e.g. combustion in power plants, solvent use). |
| Emissions from international navigation and aviation are assigned to the countries where the operator of the ship/aircraft is resident, regardless of where the emission takes place. | Emissions from international navigation and aviation are assigned to the countries where the associated fuel is bunkered, irrespective of the operator's place of residence. |
Note: National and EU totals differ between the two approaches, as different boundaries apply. GHG inventories include international aviation and maritime transport (international bunker fuels) as memorandum items, which means that they are excluded from national totals reported. However, they are included in air emissions accounts totals. Therefore total emissions reported in GHG inventory databases can differ significantly from the total reported in air emissions accounts for countries with a large international aircraft and/or shipping fleet. AEA reconciles totals with emission inventories through 'bridging items'.
Context
The need to supplement information on the economy with environmental indicators has been recognised in a European Commission Communication titled 'GDP and beyond' (COM(2009) 433). Furthermore, similar recommendations have been made within the Report by the Commission on the Measurement of Economic Performance and Social Progress,the so-called Stiglitz report. The recommendations support the expansion of the statistical understanding of human well-being by supplementing economic indicators such as GDP with additional information, including physical indicators related to the environment.
Air emissions accounts measure the interplay between the economy and the environment with respect to air emissions, in order to assess whether current production and consumption activities are on a sustainable path of development. Measuring sustainable development is a complex undertaking as it has to incorporate economic, social and environmental indicators. The data obtained from air emissions accounts may subsequently feed into political decision-making, underpinning policies that target both continued economic growth and sustainable development, for example, the European Commission's latest initiative, the European Green Deal.
Direct access to
- Air emissions accounts (env_air_aa)
- env_ac_ainah_r2
- env_ac_aibrid_r2
- env_ac_aeint_r2
- Manual for Air Emissions Accounts, 2015 edition
- Environmental accounts, see publications
- Air emissions accounts by industry and households (NACE Rev. 2) (ESMS metadata file — env_ac_ainah_r2_esms)
- System of Environmental - Economic Accounting 2012 - Central Framework