Data extracted in July 2020.
Planned article update: February 2024.
Highlights
It is projected that there will be close to half a million centenarians in the EU-27 by 2050.
Women outnumber men at older ages within the EU-27 population: in 2019, there were more than twice as many very old women (aged 85 years or more) as very old men.
The median age in the EU-27 is projected to increase by 4.5 years between 2019 and 2050, to reach 48.2 years.
(% share of total population)
Source: Eurostat (demo_pjangroup) and (proj_19np)
Ageing Europe — looking at the lives of older people in the EU is a Eurostat publication providing a broad range of statistics that describe the everyday lives of the European Union’s (EU) older generations.
Europeans are living longer than ever before and the age profile of society is rapidly developing. Demographic ageing means the proportion of people of working age in the EU is shrinking, while the number of older people is expanding; this pattern will continue in the next couple of decades, as the post-war baby-boom generation completes its move into retirement.
Such developments are likely to have profound implications, not only for individuals, but also for governments, business and civil society, impacting, among others: health and social care systems, labour markets, public finances and pension entitlements (each of which is covered by subsequent chapters in this publication). However, the focus of this opening chapter is a set of demographic indicators that describe the latest developments for an ageing Europe.
Older people — population overview
Population ageing will rapidly transform the structure of society
Population ageing is a long-term development that has been apparent for several decades in Europe. This process is being driven by historically low fertility rates, increasing life expectancy and, in some cases, migratory patterns (for example, those EU Member States characterised by net inflows of retired persons). Population projections suggest that the ageing of the EU’s population will quicken in the coming decades, with a rapid expansion in the number and share of older people.
The total population of the EU-27 is projected to increase marginally from 446.8 million at the start of 2019 to peak at 449.3 million during the period 2026-2029, before falling slowly back to 441.9 million by 2050 (see Figure 1).
The population of older people (defined here as those aged 65 years or more) in the EU-27 will increase significantly, rising from 90.5 million at the start of 2019 to reach 129.8 million by 2050. During this period, the number of people in the EU-27 aged 75-84 years is projected to expand by 56.1 %, while the number aged 65-74 years is projected to increase by 16.6 %. By contrast, the latest projections suggest that there will be 13.5 % fewer people aged less than 55 years living in the EU-27 by 2050.

(million inhabitants)
Source: Eurostat (demo_pjangroup) and (proj_19np)
There will be close to half a million centenarians by 2050
Perhaps the most remarkable aspect of the projected changes to the EU’s population structure concerns the progressive ageing of the older population itself: the relative importance of the very old (people aged 85 years or more) is growing at a faster pace than any other age group. Between 2019 and 2050, the number of very old people in the EU-27 is projected to more than double, up 113.9 %. To give some idea of the magnitude of this change, the number of people aged 85 years or more is projected to increase from 12.5 million in 2019 to 26.8 million by 2050, while the number of centenarians (people aged 100 years or more) is projected to grow from 96 600 in 2019 to close to half a million (484 000) by 2050.
Given the shrinking size of the working-age population and the growing number of older and very old people in society, one of the most pressing concerns for policymakers is to encourage older people to remain, for as long as possible, in the labour force.
In 2019, people aged 55 years or more accounted for just over one third (33.6 %) of the total EU-27 population (see Figure 2). Among the EU Member States, this share was higher than one third in 10 of the EU Member States and peaked at 36.5 % in Italy. At the other end of the range, people aged 55 years or more accounted for one quarter (25.0 %) of the population in Ireland. The share of this age group (55 years or more) in the EU-27 population is projected to reach 40.6 % by 2050; it will increase in each of the EU Member States. By 2050, those aged 55 years or more are projected to account for 45.9 % of the population in Italy, and for more than 45.0 % in Lithuania, Portugal, Greece and Latvia.

(% share of total population)
Source: Eurostat (demo_pjangroup) and (proj_19np)
The population is turning increasingly grey
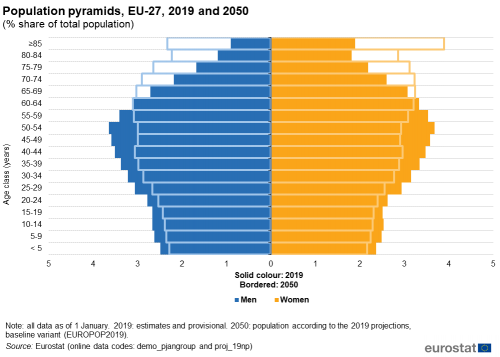
Population pyramids provide an illustration as to how the population is distributed across various age groups. Each pyramid shows the distribution of the population by sex and by five-year age group, with bars corresponding to the share of the given sex and age group in the total population; the sex and age structure of a population determines the ultimate shape of each population pyramid.
Figure 3 presents two pyramids for the EU-27 that are overlaid, one showing the situation at the start of 2019 (the solid bars) and the other a projection for 2050 (the bars with borders); they highlight the demographic transition that is projected to take place across the EU during the next three decades. The EU-27 population pyramid for 2019 is relatively narrow at the bottom and is more like a rhomboid, with a bulge in the middle of the pyramid indicating that the baby-boom generation are approaching retirement. Falling fertility rates from the 1970s onwards explain why the base of the pyramid for 2019 is relatively narrow; this process is known as ‘ageing at the bottom’ (of the population pyramid).
In the coming decades, a high number of baby-boomers will swell the number of old and very old people as the EU-27 population pyramid takes on an almost pillar-like shape, with each age group having a similar share of the total population. The growing proportion of older people may be explained in part by increased longevity; this process is often referred to as ‘ageing at the top’ (of the population pyramid). One of the most striking aspects of the pyramid for 2050 is the lengthening of the bars for the upper age group (compared with those for 2019), indicating that a greater share of the population will live to be very old (85 years or more); this is particularly notable among women.

(% share of total population)
Source: Eurostat (demo_pjangroup) and (proj_19np)
Older people — differences between the sexes
There were more than twice as many very old women as very old men
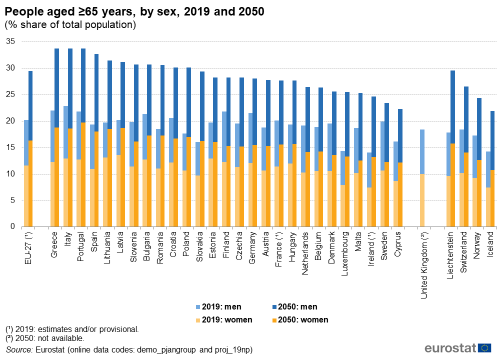
Women outnumber men at older ages within the EU-27 population. In recent years, this gap has started to narrow, as an increasing number of men survive to older ages. In 2019, there were, on average, 1.33 women aged 65 years or more in the EU-27 for every man of the same age. The biggest gender imbalances were recorded in the Baltic Member States: for example, there were more than two women aged 65 years or more for every man of the same age in Latvia.
Figure 4 shows that this gender gap is projected to narrow somewhat in the coming years with an increasing share of older men. While there were 1.33 women aged 65 years or more for every man of the same age in 2019, this ratio is projected to fall to 1.24 women aged 65 years or more for every man of the same age by 2050. The ratio of older women to older men is projected to be 1.49 : 1 in Latvia by 2050 — the highest ratio among the EU Member States — while the latest projections suggest in Malta there will be more old men than old women by 2050.
(% share of total population)
Source: Eurostat (demo_pjangroup) and (proj_19np)
Figure 5 shows that the gender imbalance for older people was most apparent among very old people (aged 85 years or more). In 2019, there were more than twice as many very old women in the EU-27 as very old men, a ratio of 2.09 : 1. The largest gaps between the sexes for this age group were also recorded in the Baltic Member States, as very old women outnumbered very old men by more than three to one. At the other end of the range, the gender imbalance for very old people was relatively narrow in Cyprus and particularly Greece (where there were 1.46 very old women for every man of the same age).

(ratio of women to men)
Source: Eurostat (demo_pjangroup)
Older people — increasingly old and with growing dependency
The median age is projected to increase by 4.5 years between 2019 and 2050
The median age of a population provides a useful summary of the overall age profile. A range of factors may influence the median age, including: fertility, life expectancy, social and economic development. In 2019, the median age of the EU-27 population was 43.7 years (see Figure 6). Across the EU Member States, the median age was below 40.0 years in Luxembourg (39.5 years), Cyprus and Ireland (where the lowest median ages were recorded, both 37.7 years). By contrast, the median age of the population was considerably higher in Germany (46.0 years) and peaked in Italy (46.7 years).
The EU-27’s median age is projected to increase by 4.5 years during the next three decades, to reach 48.2 years by 2050. An increase is projected in each of the EU Member States, with the median age of the population projected to rise by more than 8.0 years in Poland, Slovakia and Malta. At the other end of the range, the age profiles of France, Belgium, the Netherlands and Denmark are projected to develop at a slower pace, as their median ages are projected to increase by 3.0-4.0 years during the period under consideration. The pace of change is projected to be even slower in Sweden (where the median age is projected to increase by 2.6 years) and particularly Germany (a projected increase of 1.2 years).

(years)
Source: Eurostat (demo_pjanind) and (proj_19ndbi)
In the timespan of 50 years, the old-age dependency ratio is projected to more than double
The old age dependency ratio may be used to study the level of support that potentially can be given to older people by the working-age population (defined here as people aged 20-64 years); this ratio expresses the relative size of the older part of the population compared with the working-age population. The old-age dependency ratio for the EU-27 was 25.9 % in 2001 (see Figure 7); as such, there were slightly fewer than four persons of working age for every person aged 65 years or more. By 2019, the old-age dependency ratio was 34.1 %, in other words, there were fewer than three persons of working age for every older person. Population projections suggest that the EU-27 old-age dependency ratio will continue to climb and will reach 56.7 % by 2050, when there will be fewer than two persons of working age for each older person.

(%)
Source: Eurostat (demo_pjanind) and (proj_19ndbi)
In 2019, the old-age dependency ratio ranged, across the EU Member States, from lows of 22.4 % in Luxembourg and 24.0 % in Ireland to highs of 37.6 % in Greece, 38.4 % in Finland and 38.6 % in Italy. Figure 8 illustrates how this ratio is projected to develop during the next three decades: between 2019 and 2050, the old-age dependency ratio of Slovakia is projected to increase at a particularly rapid pace, with the rate in 2050 projected to be 2.2 times that of 2019.
By 2050, more than two thirds of the EU Member States are projected to have an old-age dependency ratio above 50.0 %; in other words, they will have less than two persons of working age for every person aged 65 years or more. There are seven Member States where the old-age dependency ratio is projected to reach a level of at least 60.0 %, with the highest ratios projected in Italy (66.5 %), Greece (68.1 %) abd Portugal (68.8 %). At the other end of the range, the old-age dependency ratio is projected to remain below 40.0 % in 2050 in Cyprus.

(%)
Source: Eurostat (demo_pjanind) and (proj_19ndbi)
A rapid expansion in the number of very old people
The growing number of very old people (aged 85 years or more) in the EU-27 has a range of consequences. One of the principal areas of concern for policymakers is the cost of providing adequate health and long-term care, as very old people tend to consume proportionally more social services (their needs are usually greater than those of other age groups).
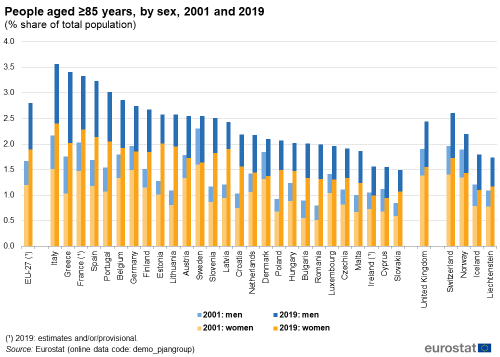
In 2019, the share of the very old people in the EU-27 population was 2.8 %. There were five EU Member States where this share was less than 2.0 %, with Ireland, Cyprus and Slovakia registering the lowest shares (1.5-1.6 %). By contrast, France and four southern Member States — Portugal, Spain, Greece and Italy — had the highest shares of very old people, with a peak of 3.6 % recorded in Italy.
There were more very old women than very old men in each of the EU Member States: however, the share of very old men was generally rising at a faster pace than the share of very old women between 2001 and 2019. Those Member States with the highest shares of very old people in their populations were characterised by having relatively large populations of very old men; this was particularly notable in Greece, where very old men accounted for 1.4 % of the total population (both sexes) in 2019. The highest share for very old women was recorded in Italy (2.4 % of the total population).
(% share of total population)
Source: Eurostat (demo_pjangroup)
Older people — global developments
While population ageing is a global phenomenon, the ageing process is more advanced in some regions of the world than in others. The pace of population ageing in many developing countries is substantially faster than the historical precedents observed in developed economies. As such, the former are likely to face far greater pressures when adapting to the needs of their ageing populations.
Behind Japan, the EU provides one of the most distinctive examples of demographic ageing
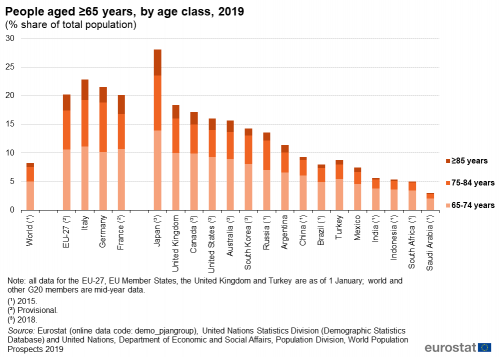
The G20 countries are at various stages of economic and population development. While the process of population ageing is particularly established in Japan, this may be contrasted with South Africa or Saudi Arabia where young people dominate the population profile.
Figure 10 shows the share of older people (aged 65 years or more) in the total populations of the G20 nations. In 2015, older people accounted for 8.2 % of the world’s population. At one end of the spectrum, the share of older people was more than three times the global average in Japan, where the share of people aged 65 years or more in the total population was more than one quarter (28.0 % in 2018). The EU-27 had the next highest share of older people among the G20 nations (20.3 % in 2019). Half of the remaining non-EU G20 countries had shares of older people in their total populations that were above the global average; these included the United States (16.0 % in 2018) and China (9.3 % in 2015). The G20 countries where older people accounted for a relatively small proportion of the total population are often characterised as emerging economies, with relatively young populations and expanding labour forces; examples include Mexico (where older people accounted for 7.4 % of the total population in 2019), India (5.6 % in 2015), Indonesia (5.4 % in 2015), South Africa (5.0 % in 2015) and Saudi Arabia (3.0 % in 2015).
(% share of total population)
Source: Eurostat (demo_pjangroup), United Nations Statistics Division (Demographic Statistics Database) and United Nations, Department of Economic and Social Affairs, Population Division, World Population Prospects 2019
In 2020, the median age of the world population is projected to be 30.9 years. Japan (48.4 years) had the highest projected median age among the G20 nations and was followed by the EU-27 (43.9 years). There were only four G20 countries where the median age was below the world average: Indonesia, Mexico, India and South Africa.
Figure 11 also shows a set of projections [1]: by 2050, the median age of the world population is projected to reach 36.2 years. The highest median ages are projected for eastern Asia, peaking at 56.5 years in South Korea and 54.7 years in Japan, while the median age of the population in China (47.6 years) is projected to rise to almost the same level as in the EU-27 (48.2 years). By 2050, the only G20 country where the median age is projected to remain below the world average is South Africa (33.9 years).

(years)
Source: Eurostat (demo_pjanind) and (proj_19ndbi) and United Nations, Department of Economic and Social Affairs, Population Division, World Population Prospects 2019
The information presented in Figure 12 confirms the process of rapid population ageing in eastern Asia. The old-age dependency ratio for Japan is projected to continue to rise at a rapid pace through to 2050, when it is projected to reach 80.7 %. This implies that, having had almost four working-age people (defined here as those aged 20-64 years) for each older person (aged 65 years or more) in 2000, Japan will move to a situation of having approximately 1.2 working-age persons for every older person by 2050. During the next three decades there will also be a considerable shift in the structure of the Chinese population. From having an old-age dependency ratio that was close to but just below the world average in 2015, China is projected to see its ratio rise rapidly such that it will be 1.7 times the level projected for the world by 2050.

(%)
Source: Eurostat (demo_pjanind) and (proj_19ndbi) and United Nations, Department of Economic and Social Affairs, Population Division, World Population Prospects 2019
Older people — where do they live?
Older people were more likely to live in rural areas
Rural areas can be places of great natural beauty, which offer a wide range of recreational activities. While such locations might appeal to other older people when they come to consider where to retire, these areas often suffer from a low provision of services. This may be particularly problematic for older people who face a greater risk of reduced mobility, illness or social exclusion. By contrast, urban environments may be advantageous for older people, notably in terms of providing better access to public transport, as well as a greater variety of housing options, public and commercial services.
In 2019, there were 90.4 million older people (aged 65 years or more) living in the EU-27. Of these, 39.7 % were living in intermediate regions and 38.2 % in predominantly urban regions, leaving 22.1 % in predominantly rural regions. Figure 13 compares the population distribution of older people by urban-rural typology. It shows that older people in the EU-27 were generally more inclined than younger people to live in predominantly rural regions and intermediate regions (as shown by indexed values greater than 100 %) and were less inclined to live in predominantly urban regions.
This pattern — a higher than average proportion of older people living in predominantly rural regions — was repeated in the vast majority of EU Member States; in 2019, the only exceptions were Slovakia, Belgium and Poland [2]. By contrast, the share of older people living in predominantly rural regions was high (relative to the share for the rest of the population) in France, the Netherlands and particularly Spain. In some cases, the relatively high shares of older people living in rural regions may reflect younger generations leaving sparsely populated regions (for example, in search of job opportunities and/or a better quality of life), while older people continue to live in rural areas.

(%, share of total population living in each type of region = 100)
Source: Eurostat (urt_pjangrp3)
Older people accounted for a high share of the population in eastern Germany and northern Italy
Subnational breakdowns of demographic statistics can be useful to policymakers, particularly when making preparations for age-related services. Map 1 provides information by NUTS level 2 regions and is based on the shares of older people (aged 65 years or more) in the total population. In 2019, there were 17 regions across the EU where older people made up more than one quarter of the total population. These regions were principally located in eastern Germany, northern/central Italy and north-western/central Spain (with only 5 of the 17 regions from other EU Member States): the highest shares were recorded in Chemnitz (eastern Germany; 28.9 %), Liguria (north-western Italy; 28.5 %) and Ipeiros (north-western Greece; 27.0 %).
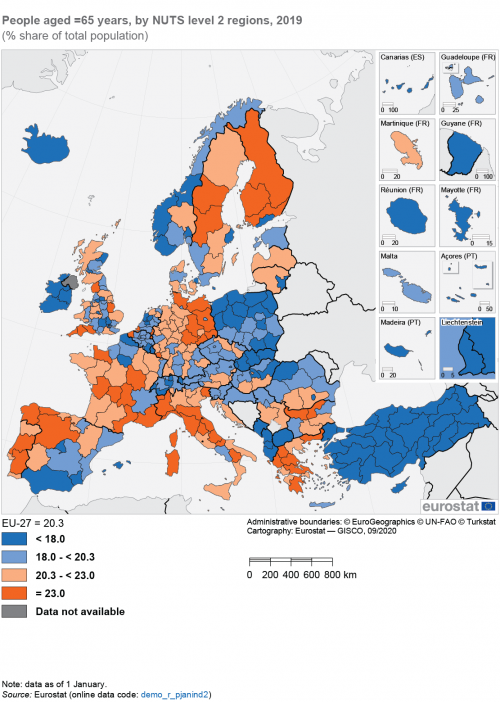
(% share of total population)
Source: Eurostat (demo_r_pjanind2)
There were high concentrations of older people in rural, sparsely populated regions
Figure 14 provides more detailed figures, namely for NUTS level 3 regions. It underlines the considerable regional variations that exist in some of the EU Member States regarding the share of older people (aged 65 years or more) in the total population. Normally these differences reflect the contrasting situations that prevail between sparsely populated rural regions and urban centres; note that it was common to find the lowest shares of older people in capital city regions.
In 2019, older people accounted for more than one third (36.7 %) of the total population in the central Greek region of Evrytania — a relatively mountainous, rural region, which is sparsely populated. The next highest shares were recorded in the Belgian region of Arr. Veurne (32.5 %) that is located close to the English Channel and shares a border with France, and the eastern German city of Suhl, Kreisfreie Stadt (32.2 %).
Aside from Evrytania, there were several other relatively sparsely populated, remote regions where older people accounted for at least 30.0 % of the total population: Ourense (north-western Spain; 31.4 %), Creuse (central France; 30.3 %), Alto Tâmega (northern Portugal; 30.3 %) or Etelä-Savo (south-eastern Finland; 30.1 %). By contrast, the lowest shares of older people were recorded in two of the outermost regions of France (Mayotte (2.7 %) and Guyane (5.8 %)).
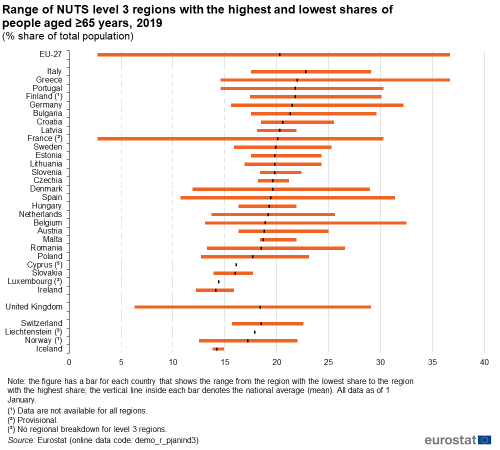
(% share of total population)
Source: Eurostat (demo_r_pjanind3)
Older people — where do they come from?
While declining fertility and increasing longevity are the key drivers of population ageing in the EU, international migration can also play a role in determining the age profile of a population. Indeed, migration usually slows down the ageing process, as a majority of immigrants tend to be relatively young, fleeing persecution or conflict, searching for work opportunities and the chance of a better quality of life.
A relatively small proportion of older people are foreign citizens
Figure 15 presents information on the prominence of foreign citizens. In 2019, foreign citizens accounted for 7.9 % of the EU-27 population, a share that was 4.1 % among older people (aged 65 years or more). Across the EU it was relatively common to find the share of foreign citizens in the total population falling as a function of age. This may reflect several factors, such as:
- the size of migratory flows may have changed over time;
- the age structure of migratory flows may have changed;
- some people may move to a country for a specific reason, for example to study or to work, and then leave thereafter;
- demographic factors such as fertility rates may be different among foreign and national citizens.
For example, in Luxembourg foreign citizens made up almost half (47.5 %) of the total population in 2019, while their share among older people was considerably lower (at 34.7 %). There were two exceptions to this pattern, Latvia and Estonia, where a higher share of older people (than the total population) were foreign citizens. This may be linked to a high number of older people in these two Member States being classified as recognised non-citizens; these people are mainly former Soviet Union citizens, who are permanently resident but have not acquired any other citizenship.
Source data for tables and graphs
Notes
Explore further
Other articles
Online publications
Categories of publications
Database
- Population (demo_pop)
- Population on 1 January by age group and sex (demo_pjangroup)
- Population: Structure indicators (demo_pjanind)
- Population on 1 January by age group, sex and citizenship (migr_pop1ctz)
- Population projections (proj)
- EUROPOP2019 - Population projections at national level (2019-2100) (proj_19n)
- Population on 1st January by age, sex and type of projection (proj_19np)
- Demographic balances and indicators by type of projection (proj_19ndbi)
- EUROPOP2019 - Population projections at national level (2019-2100) (proj_19n)
- Population (demo_pop)
- Regional demographic statistics (reg_dem)
- Population and area (reg_dempoar)
- Population: Structure indicators by NUTS 2 region (demo_r_pjanind2)
- Population: Structure indicators by NUTS 3 region (demo_r_pjanind3)
- Population and area (reg_dempoar)
- Regional demographic statistics (reg_dem)
Thematic section
Selected datasets
Methodology
Metadata
- Population (ESMS metadata file — demo_pop_esms)
- Population projections (ESMS metadata file — proj_esms)
Further methodological information

