Disability statistics - housing conditions
Data extracted in: July 2024.
Planned article update: December 2025.
Highlights
In 2023, 68.2% of people in the EU aged 16 years or over with a disability lived in a household that owned their own home, while 31.8% lived in rented accommodation.
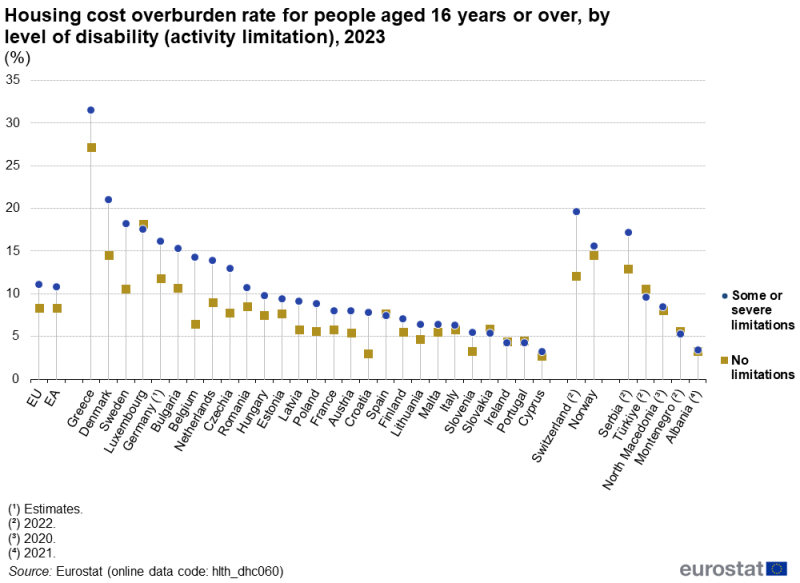
In 2023, the housing cost overburden rate for people in the EU aged 16 years with a disability was 11.1%, ranging from 3.2% in Cyprus to over 20.0% in Denmark and Greece.
Housing cost overburden rate for people aged 16 years or over, by level of disability (activity limitation), 2023
This article is part of a set of articles on disability and presents various aspects of the housing conditions faced by people with a disability (activity limitation). The data come from the EU statistics on income and living conditions (EU-SILC) and relate to the 2023 reference year; they cover people aged 16 years or over.
Full article
Tenure status
In the EU as a whole, there was no major difference between people with or without a disability in terms of home ownership, but people with a disability were much less likely to have an outstanding loan or mortgage
In 2023, 68.2% of people aged 16 years or over with a disability (some or severe activity limitation) in the EU lived in a household that owned their own home – see Table 1. Among people with a disability, 15.7% were owners who still had a mortgage or loan to pay off and 52.5% had no outstanding mortgage or housing loan. For comparison, 70.3% of people aged 16 years or over with no disability lived in a household that owned their own home, 2.1 percentage points (pp) higher than the share for people with a disability. Among people with no disability, 24.7% still had a mortgage or loan to pay off, 9.0 pp higher than the share for people with a disability. Therefore, the share of people with no disability who had no outstanding mortgage (45.6%) was lower than the share for people with a disability. At least in part, these differences may reflect different age structures of the subpopulations of people with or without a disability which in turn impacts on the likelihood that people are at a stage of their lives when they have paid off any mortgages or house loans.

(%)
Source: Eurostat (hlth_dhc010)
This means that 31.8% of people with a disability in the EU lived in rented accommodation in 2023: 19.5% paid rent at the market rate and the remaining 12.3% paid a reduced rent or no rent at all. For people without a disability, some 29.7% lived in rented accommodation: 20.6% paid rent at the market rate and 9.2% paid a reduced rent or no rent.
- The share of people without a disability paying a market price rent was 1.1 pp higher than the equivalent share for people with a disability.
- The share of people with a disability paying a reduced rent or no rent at all was 3.1 pp higher than the equivalent share for people without a disability.
With 1 exception, the EU countries generally reported that over half of all people with a disability lived in owner-occupied dwellings in 2023 – see Table 1.
In 15 EU countries, the share of people with a disability living in owner-occupied dwellings was lower in 2023 than it was among people without a disability. The largest difference was in the Netherlands (where 58.0% of people with a disability lived in owner-occupied dwellings, 14.9 pp lower than the equivalent share among people without a disability); shares more than 10.0 pp higher among people with a disability were also observed in Sweden and Belgium. Among the 12 EU countries where the share of people living in owner-occupied dwellings was higher among people with a disability, the largest difference was in Greece: the share among people with a disability was 81.0%, some 11.4 pp more than the share among people without a disability.
Accommodation quality
People with a disability more often living in sub-standard accommodation
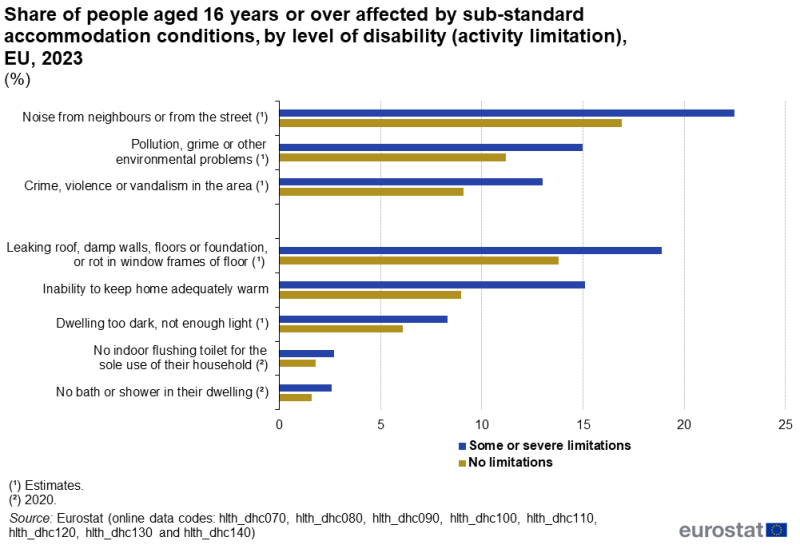
Across the EU, people with a disability were more likely to experience problems associated with housing deprivation – see Figure 1.
For 3 types of surveyed issues related to the area where people live, the issues were more common in 2023 among people with a disability.
- 22.5% of people with a disability reported noise from neighbours or from the street, compared with 16.9% of those without a disability.
- 15.0% of people with a disability reported pollution, grime or other environmental problems in the area they lived, compared with 11.2% among people without a disability.
- 13.0% of people with a disability were aware of crime, violence or vandalism in the area they lived, compared with 9.1% among people without a disability.
Equally, all 5 issues related to the accommodation itself were more common among people with a disability; note the latest data available for toilets and for baths/showers refer to 2020 whereas the data for the other indicators refer to 2023.
- 18.9% of people with a disability said they had a leaking roof, damp walls, floors or foundation, or rot in the window frames or floor in their home; among people without a disability the share was 13.8%.
- 15.1% of people with a disability reported that they were unable to keep their home adequately warm, compared with 9.0% among people without a disability.
- 8.3% of people with a disability complained of living in a dwelling considered too dark, compared with 6.1% among people without a disability.
- 2.7% of people with a disability had no indoor flushing toilet, compared with 1.8% among people without a disability.
- 2.6% of people with a disability had no bath or shower in their dwelling, compared with 1.6% among people without a disability.

(%)
Source: Eurostat (hlth_dhc070), (hlth_dhc080), (hlth_dhc090), (hlth_dhc100), (hlth_dhc110), (hlth_dhc120), (hlth_dhc130) and (hlth_dhc140)
Overcrowding
People aged 16 years or over with a disability were less likely to live in an overcrowded household
Another indicator of housing quality is the number of people living in the same dwelling. The overcrowding rate is defined as the share of people living in an overcrowded household. A household is overcrowded if it does not have at least 1 room for the household, 1 room per couple in the household, 1 room for each single person aged 18 years or over, 1 room per pair of single people of the same sex aged between 12 and 17 years, 1 room for each single person aged between 12 and 17 years and not included in the previous category, and 1 room per pair of children aged less than 12 years.

(%)
Source: Eurostat (hlth_dhc040)
In the EU in 2023, the overcrowding rate was lower for people with a disability than it was for people without a disability, the shares being 11.4% and 16.1%, respectively – see Figure 2. This situation was also observed in 24 of the EU countries. The largest difference was recorded in Romania, where 24.2% of people with a disability experienced overcrowding, 17.1 pp lower than the share among people without a disability (41.3%). There were 3 EU countries – Sweden, Finland and Cyprus – where the overcrowding rate was higher for people with a disability, the differences in the rates for people with or without a disability were small, at most 3.2 pp (Sweden).
Among the EU countries, the overcrowding rate in 2023 for people with a disability ranged from less than 3.0% in Malta, Cyprus, the Netherlands and Ireland to 30.5% in Poland and 34.4% in Latvia.
People aged 65 years or over with a disability more likely to experience overcrowding
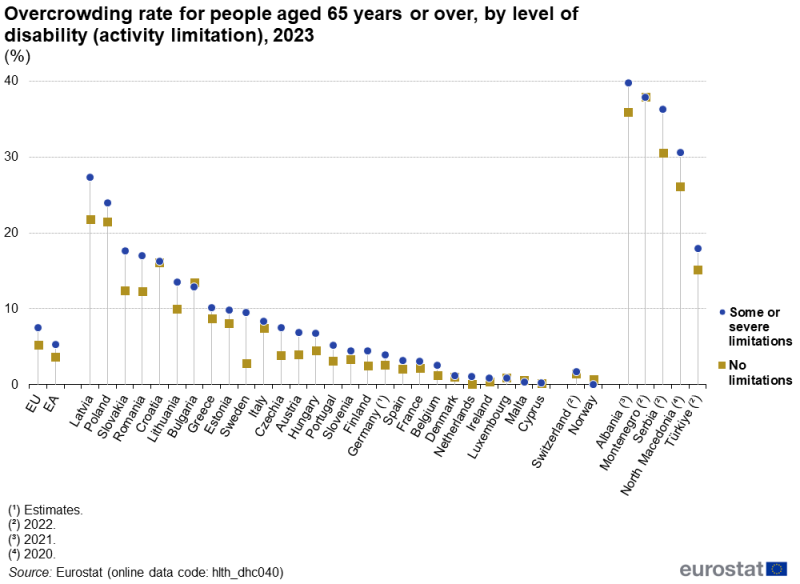
A different pattern was observed among people aged 65 years or over – see Figure 3. In 2023, the overcrowding rate in the EU was higher for people with a disability (7.5%) than for people without a disability (5.3%).
This situation was also observed in 24 of the EU countries. The largest difference was recorded in Sweden, where 9.5% of people aged 65 years or over with a disability experienced overcrowding, 6.7 pp higher than the share among people aged 65 years or over without a disability (2.8%). In Luxembourg, there was no difference in the overcrowding rate for people aged 65 years or more between those with or without a disability. In the 2 EU countries – Bulgaria and Malta – where the overcrowding rate was lower for people aged 65 years or over with a disability, the differences in the rates for people aged 65 years or over with or without a disability were small, at most 0.6 pp (Bulgaria).
In 2023, the overcrowding rate for people with a disability ranged in the EU countries from 0.3% in Cyprus to 24.0% in Poland and 27.3% in Latvia.

(%)
Source: Eurostat (hlth_dhc040)
Housing costs
People with a disability more likely to be overburdened by housing costs
Housing costs as a share of disposable income indicate people’s ability to afford the costs associated with their housing. Households with a higher income may find it easier to cope with a high share of housing costs in relation to their disposable income. Nevertheless, if housing costs are greater than or equal to 40% of disposable income, this is deemed an overburden: the share of people whose housing costs meet this criterion is referred to as the housing cost overburden rate.
In general, housing costs include
- mortgage interest and principal payments (for homeowners) and rental payments (for tenants)
- structural insurance, mandatory services and charges (for example, sewage or waste removal)
- the cost of utilities (such as water, electricity, gas and heating)
- regular maintenance and repairs to the dwelling
- taxes (if applicable).

(%)
Source: Eurostat (hlth_dhc060)
In the EU, the housing cost overburden rate was 11.1% in 2023 for people aged 16 years or over with a disability compared with 8.3% for people without a disability. In 22 EU countries, the housing cost overburden rate was higher among people with a disability than for people without a disability – see Figure 4. The widest gaps were recorded in Belgium and Sweden: the rates for people with a disability were 14.3% and 18.2%, respectively, which were 7.8 pp and 7.6 pp higher than the rates for people without a disability (6.5% and 10.6%, respectively). Ireland, Portugal, Spain, Slovakia and Luxembourg were the 5 EU countries which reported higher rates for people without a disability.
Among the EU countries, the housing cost overburden rate for people with a disability ranged in 2023 from 3.2% in Cyprus to 21.0% in Denmark and 31.5% in Greece.
Source data for tables and graphs
Data sources
EU-SILC is the source for comparative statistics on income distribution and social inclusion in the EU. It provides annual data for the EU countries as well as most EFTA and enlargement countries on income, poverty, social exclusion and other aspects of living conditions.
The reference population for EU-SILC is limited to private households and their current members residing in the territory of the surveying country at the time of data collection. People living in collective households and institutions are generally excluded from the reference population; this constitutes a limitation for disability statistics. All household members are surveyed, but only those aged 16 years or over are interviewed.
The source is documented in more detail in this background article, which provides information on the scope of the data, its legal basis, the methodology employed, as well as related concepts and definitions.
In EU-SILC, disability is approximated according to the concept of global activity limitation, which is defined as a limitation – because of health problems – in carrying out usual activities (for at least the previous 6 months). This is considered to be an adequate proxy for disability, both by the scientific community and organisations representing people with disabilities. This definition is also in line with the concept of disability as set out in the European disability strategy 2010–2020 and its successor, the Strategy for the rights of persons with disabilities 2021–2030.
Context
Disability statistics are used to measure the impact and effectiveness of EU policy aimed at ensuring equal rights for people with disabilities. The EU has adopted several strategies aimed at improving the lives of people with disabilities
- by reducing discrimination and inequalities
- by providing support to fully enjoy their human rights, fundamental freedoms and EU rights on an equal basis with others.
In light of this, the 2021-2030 EU Strategy for the rights of persons with disabilities sets EU objectives and priority actions in several areas, such as accessibility, citizens’ rights, the quality of life, equal access and non-discrimination, and the promotion of the rights of people with disabilities. To find out more, please visit the webpage on the monitoring framework for the objectives and actions of this strategy.
To ensure sound monitoring and reporting of this topic, the European Commission is reinforcing the collection of data on the situation of people with disabilities in areas where knowledge gaps have been identified, for example in relation to access to the labour market.
The EU is also a signatory of the United Nations (UN) Convention on the Rights of Persons with Disabilities (CRPD).
Housing policy in EU countries is a national policy, rather than an EU policy.
Direct access to
Other articles
Online publications
Related articles
- Disability (dsb), see
- Income and living conditions (dsb_ilc)
- Housing conditions (dsb_ilchc)
- Living environment (dsb_ilcle)
Health
- European Commission – Directorate-General for Health and Public Safety – Public health
- Regulation (EU) 2021/522 of the European Parliament and of the Council of 24 March 2021 establishing a Programme for the Union’s action in the field of health (‘EU4Health Programme’) for the period 2021–2027
Housing
Disability