Reference metadata describe statistical concepts and methodologies used for the collection and generation of data. They provide information on data quality and, since they are strongly content-oriented, assist users in interpreting the data. Reference metadata, unlike structural metadata, can be decoupled from the data.
Eurostat, the statistical office of the European Union
1.2. Contact organisation unit
Unit F4 - Income and living conditions; Quality of life
1.3. Contact name
Confidential because of GDPR
1.4. Contact person function
Confidential because of GDPR
1.5. Contact mail address
2920 Luxembourg LUXEMBOURG
1.6. Contact email address
Confidential because of GDPR
1.7. Contact phone number
Confidential because of GDPR
1.8. Contact fax number
Confidential because of GDPR
2.1. Metadata last certified
19 December 2025
2.2. Metadata last posted
19 December 2025
2.3. Metadata last update
19 December 2025
3.1. Data description
The European Union Statistics on Income and Living Conditions (EU-SILC) collects timely and comparable multidimensional microdata on income, poverty, social exclusion and living conditions.
The EU-SILC collection is a key instrument for providing the information required by the European Semester([1]) and the European Pillar of Social Rights. It is also the main source of data for microsimulation purposes and for producing flash estimates of income distribution and poverty rates.
The indicator of persons at risk of poverty or social exclusion (AROPE) remains crucial for monitoring European social policies, especially for monitoring the EU 2030 target on poverty and social exclusion. For more information, please consult EU social indicators.
The EU-SILC instrument provides two types of data:
cross-sectional data pertaining to a given time or a certain time period with variables on income, poverty, social exclusion and other living conditions;
longitudinal data pertaining to individual-level changes over time, observed periodically with a rotation scheme of four or more years (Annex III(2) to EU Regulation 2019/1700).
EU-SILC collects:
annual variables;
three-yearly modules;
six-yearly modules;
ad hoc modules addressing new policy needs;
optional variables.
The variables collected are grouped by topic and detailed topic, and transmitted to Eurostat in four main files (D-File, H-File, R-File and P-file).
The ‘Income and Living Conditions’ domain covers the following topics: persons at risk of poverty or social exclusion, income inequality, income distribution and monetary poverty, living conditions and material deprivation. It also covers EU-SILC ad hoc modules, which are organised into collections of indicators on specific topics.
The data refer to all private households in the national territory and the individuals living in those private households at the time of data collection.
3.4. Statistical concepts and definitions
Statistical concepts and definitions for EU-SILC are specified in EU regulation 2019/1700, EU regulation 2019/2181, and EU regulation 2019/2242. The basic Regulation and its implementing and delegated acts provided for multiple changes to the EU-SILC data collection starting from 2021.
Countries must follow Annex II to EU regulation 2019/2242, where the list of variables is set out, including their modalities, flags, unit and reference period. A more detailed description of the list of variables as well as information on their implementation are available in the methodological guidelines.
The information collected in EU-SILC pertains to the following types of statistical units: private households and persons living in those households. Annex II to EU regulation 2019/2242 defines the specific statistical units for each variable, while Annex IV to the same Regulation specifies the content of the quality reports on the organisation of a sample survey in the income and living conditions domain, pursuant to EU regulation 2019/1700 of the European Parliament and of the Council.
3.6. Statistical population
The target population is private households and all persons composing these households having their usual residence in the national territory. A private household means a person living alone or a group of persons who live together, providing for themselves the essentials of living.
3.6.1. Reference population
The reference population of EU-SILC is private households and all persons composing these households having their usual residence in the national territory. A private household means a person living alone or a group of persons who live together, providing themselves with the essentials of living. All household members are surveyed, but only those aged 16 and older are interviewed. Persons living in collective households and in institutions are generally excluded from the target population.
Most countries follow the standard definitions of reference population (except Estonia and Malta) and household membership (except Belgium). The definition of reference population applied in Denmark and Finland is slightly different due to the use of registers for sample selection (please consult national quality reports for more information).
3.6.2. Population not covered by the data collection
The subpopulations that are not covered by data collection include persons who moved out of the country, those with no usual residence and persons living in institutions or who have moved to an institution since the previous year. For more information, please see the national quality reports.
3.7. Reference area
The data refer to the Member States, Iceland, Norway, Switzerland, United Kingdom, Albania, Bosnia and Herzegovina, Montenegro, North Macedonia, Serbia, Türkiye and Kosovo([2]) – national territory and NUTS II level.
EU-SILC may exclude small parts of the national territory amounting to no more than 2% of the national population, and the national territories defined in Article 6 of EU regulation 2019/2242.
Specific cases of coverage areas apply to the following countries:
France: France excluding Mayotte. Four overseas departments (Guadeloupe, Martinique, French Guiana and Réunion) have been included since the 2022 data collection.
Ireland: Ireland including the following offshore islands: Achill, Bull, Cruit, Gorumna, Inishnee, Lettermore, Lettermullan and Valentia.
Malta: Malta and Gozo.
Netherlands: Kingdom of the Netherlands excluding overseas territories.
Cyprus: Government-controlled areas of the Republic of Cyprus.
Portugal: The whole national territory, including the mainland and the two autonomous regions (Região Autónoma dos Açores and Região Autónoma da Madeira).
Norway: Norway except Svalbard.
([2]) This designation is without prejudice to positions on status and is in line with UNSCR 1244/1999 and the ICJ Opinion on the Kosovo declaration of independence.
3.8. Coverage - Time
Annual data, data collection year 2024.
The EU-SILC project was launched in 2003 based on a ‘gentlemen’s agreement’ in six Member States (Belgium, Denmark, Greece, Ireland, Luxembourg and Austria) and Norway.
The EU-SILC instrument started in 2004 for the EU-15 (except Germany, the Netherlands and the United Kingdom), Estonia, Norway and Iceland.
A derogation was provided in the cases of Germany, the Netherlands and the United Kingdom, and nine of the ten new Member States (except Estonia). It permitted them to begin in 2005, on the condition that they supplied comparable data for 2004 for the common EU indicators that were adopted by the Council in the context of the open method of coordination.
Bulgaria and Türkiye started fully implementing the EU-SILC instrument in 2006, while Romania and Switzerland launched EU-SILC in 2007.
North Macedonia started in 2010, Croatia in 2011, Montenegro and Serbia in 2013, Albania in 2017, Kosovo ([3]) in 2018 and Bosnia and Herzegovina in 2022.
The United Kingdom left the EU on 31 January 2020. As there is no agreement on transmitting statistical information, the country has ceased to transmit data for EU-SILC. The latest data available for the United Kingdom is EU-SILC 2018.
Annex 1 – EU-SILC implementation and Figure 1 belowprovide an overview of EU-SILC implementation across countries until 2024.
Figure 1: EU-SILC implementation by country
EU-SILC implementation shows gaps in the data disseminated in Eurobase: Iceland until 2020; Montenegro and North Macedonia until 2022; Albania and Bosnia and Herzegovina until 2023; and Kosovo until 2018. More information is available in Eurobase: living conditions section, database.
([3]) This designation is without prejudice to positions on status and is in line with UNSCR 1244/1999 and the ICJ Opinion on the Kosovo declaration of independence.
3.9. Base period
Not applicable.
The data include several units of measure, depending on the variable. For more information, see the methodological guidelines and description of EU-SILC target variables available in CIRCABC. Most indicators are reported as shares. Some are reported in other units (e.g. per cent, thousands of persons, monetary units, etc.). More information is available in Eurobase, living conditions section, to the database.
The reference period is the survey year. The nucleus or annual variables are collected yearly using the reference period, as specified in Annex II to, and Article 7(1) of, Regulation (EU) 2019/2242 as well as in the methodological guidelines.
For all countries, the reference period for income variables in EU-SILC is the previous calendar year. Until 2019, Ireland collected income information for the 12-month period immediately preceding the sample household’s interview date. For most countries, the fieldwork was carried out from January to July 2024. The lag between the income reference period and data collection period varies across countries. However, for most countries, the data collection took place at the beginning of 2024 (Figure 2).
Figure 2: Lag between the income reference period and data collection, 2024
6.1. Institutional Mandate - legal acts and other agreements
EU regulation 2019/1700 establishing a common framework for European statistics relating to persons and households, based on data at individual level collected from samples (IESS), was published in the Official Journal of the European Union on 10 October 2019. The Annex to EU regulation 2019/2180 of 16 December 2019 specifies the detailed arrangements and content for the quality reports pursuant to EU regulation 2019/1700 of the European Parliament and of the Council. It is complemented by Annex IV to EU regulation 2019/2242 on detailed arrangements and content of quality reports.
More information on derogations from the IESS Regulation, Commission implementing regulations, Commission delegated regulations and past legislation can be found in the EU SILC Legal Framework.
6.2. Institutional Mandate - data sharing
Confidential microdata are not disclosed by Eurostat. Access to anonymised microdata for scientific purposes may be granted on the basis of EU regulation 557/2013 and EU regulation 223/2009 of the European Parliament and of the Council on European statistics.
Regulation (EC) 223/2009 on European statistics (recital 24 and Article 20(4)) of 11 March 2009 (OJ L 87, p. 164) sets out the need to establish common principles and guidelines. It ensures the confidentiality of the data used to produce European statistics and access to those confidential data, while also considering technical developments and the requirements of users in a democratic society.
More information on data confidentiality can be found on the Eurostat website.
7.2. Confidentiality - data treatment
EU-SILC microdata do not contain any administrative information, such as names or addresses, that would allow direct identification. For more details, see access to microdata. To ensure disclosure control and confidentiality of EU-SILC microdata when disseminating them to researchers via the User Database (UDB), some collected variables are removed or changed. To make the data easier to use, some derived variables are added. For more details, see User Database (UDB).
estimates should not be published if they are based on fewer than 20 sample observations or if the non-response rate for the item concerned exceeds 50%;
estimates should be published with a flag if they are based on 20 to 49 sample observations or if non-response rate for the item concerned exceeds 20% and is lower or equal to 50%;
estimates can be published normally when they are based on 50 or more sample observations and the item non-response rate for the variable(s) used does not exceed 20%.
The data are flagged when needed. The following flags are used:
(b) Break in series (i.e. change of source or change of methodology)
(c) Confidential
(d) Definition differs, see metadata
(e) Estimated
(f) Forecast
(n) Not significant
(p) Provisional
(r) Revised
(s) Eurostat estimate
(u) Low reliability (i.e. due to small sample size)
8.1. Release calendar
EU-SILC data are published annually. The main tables are available on the Eurostat website. In addition, statistical articles or working papers on specific topics using SILC data are published (Publications). Indicators based on national SILC data are published as soon as the data are validated for each country. For more information, see the datasets availability table and release calendar.
8.2. Release calendar access
Please refer to the release calendar publicly available on Eurostat’s website.
8.3. Release policy - user access
Eurostat disseminates European statistics on its website (see Section 10 – ‘Accessibility and clarity’) in line with the EU legal framework and the European Statistics Code of Practice. It respects professional independence and acts in an objective, professional and transparent manner, ensuring that all users are treated equally. The detailed arrangements are governed by the Eurostat protocol on impartial access to Eurostat data for users. Additional information about microdata access is available in EU statistics on income and living conditions – microdata.
Countries have provided links to their national sites in the release calendar, when available.
Annual
10.1. Dissemination format - News release
The main results are published and news releases are available on the Eurostat website (news).
10.2. Dissemination format - Publications
The following publications are disseminated in the dedicated EU-SILC section:
A detailed description of the indicators available online can be found in the following documents: ‘Working Paper on EU-SILC datasets’ and ‘European Union Statistics on Income and Living Conditions - Access to microdata’.
Please consult the database on Income and living conditions for more information.
10.3.1. Data tables - consultations
Eurostat monitors user behaviour by analysing database extractions for each domain, and page views for each dedicated section by month and year. In this way, Eurostat keeps track of users and their needs through website monitoring (The website of Eurostat was updated in 2022).
10.4. Dissemination format - microdata access
In accordance with EU regulation 557/2013, the Commission has released anonymised SILC microdata in CIRCABC via an encrypted zip file.
Access to the anonymised EU-SILC microdata is provided by means of research contracts. Access is, in principle, restricted to universities, research institutes, national statistical institutes, central banks inside the EU and the European Central Bank. Individuals cannot be granted direct access. For more details, see access to microdata and Publications Office of the European Union (contact email).
10.5. Dissemination format - other
The results of the EU-SILC survey are useful for policymakers and users. For this purpose, Eurostat produces several requests in table format. In addition, EU-SILC data are useful for drafting papers as part of different workshops or conferences.
For more information, please consult the Eurostat website.
10.5.1. Metadata - consultations
Eurostat consults Member States on metadata guidelines and the new metadata structures before implementation.
10.6. Documentation on methodology
The quality reports and the list of variables collected and transmitted to Eurostat (cross-sectional and longitudinal) refer to the main document for the relevant operational year in CIRCABC: Methodological guidelines and description of EU-SILC target variables. More information about EU-SILC is provided in EU-SILC methodology; EU statistics on income and living conditions (EU-SILC) methodology; and glossary: EU statistics on income and living conditions (EU-SILC).
A detailed description of the calculation of indicators can be found on the Eurostat website.
The implementation of EU-SILC 2024 follows the EU Regulation on:
titles of the variables, for the income and living conditions domain, EU regulation 2020/258;
arrangements and content of the quality reports for the income and living conditions domain, EU regulation 2019/2242;
2024 module: EU Regulation 2022/2498 on 6-yearly module on access to services and EU Regulation 2019/2242 on 3-yearly module on children health, access to healthcare (children) and children specific deprivation:.
Furthermore, the following rules are common to all the surveys:
technical characteristics of the statistical populations and observation units, descriptions of variables and statistical classifications, EU regulation 2019/2181;
the delegated Regulation on multiannual rolling planning, which sets the data collection periods for all domains from 2021 to 2028, EU regulation 2020/256.
structure of quality reports related to the datasets to be transmitted by EU Member States to Eurostat, EU regulation 2019/2180.
For more information, please see the Eurostat website on EU-SILC legislation.
Countries provide an annex containing metadata on benefits useful for EUROMOD (attached to national quality report), based on EU-SILC data. The annex with metadata on the income benefits is collected for EUROMOD purposes, and it is shared only with UDB users (not published with the quality report). More information about EUROMOD can be found on the website: EUROMOD – Tax-benefit microsimulation model for the European Union.
10.6.1. Metadata completeness - rate
All items required in the SIMS are provided. Therefore, the metadata completeness rate is 100%.
10.7. Quality management - documentation
Documents describing the variables to be implemented for the operational year, the quality report guidelines and other supportive materials are stored in CIRCABC.
The quality report guidelines, which describe the national quality reports and support countries in filling them in, are updated yearly.
Countries implement EU-SILC by applying the methodological guidelines and the description of the EU-SILC target variables. Using the same methodology and list of variables increases comparability across countries.
EU-SILC is based on EU regulation 2019/2242, which sets out the scope, definitions, time reference, characteristics of the data, data required, sampling, sample sizes, transmission of data, publication, access for scientific purposes, financing, reports and studies. In addition, Eurostat and the Member States have developed the technical aspects of the instrument, in particular the Regulation on Quality Reports (EU regulation 2019/2180).
11.2. Quality management - assessment
Countries are obliged to report any deviations from the legal provisions to Eurostat. These should be described in their national quality reports. The data are accompanied by quality reports, which analyse the accuracy, coherence and comparability of the data. Output harmonisation is achieved by establishing the format (list and content of target variables and data format) and timetable for data transmission. This is complemented by Eurostat consistency and integrity checks on the microdata, ensuring that a minimum output quality standard is reached.
12.1. Relevance - User Needs
The relevance of an instrument should be assessed by considering the needs of its users. The list of variables collected, as well as the indicators produced, should meet users’ needs. As for EU-SILC, the main users are the following:
policymakers (several Directorates-General of the Commission, the Social Protection Committee, in charge of monitoring social protection and social inclusion, and other Commission services);
statistical users in Eurostat or in Member States, who use it to feed sectorial or transversal publications;
researchers who have access to microdata;
media;
students, etc.
12.2. Relevance - User Satisfaction
Eurostat carried out a general user satisfaction survey (USS) in 2024 (User satisfaction surveys by year) to obtain a better understanding of users’ needs and satisfaction with the services provided by Eurostat. The survey showed that EU-SILC is highly relevant to users. Most of them reported that both aggregates and microdata are important or essential in their work, irrespective of the reason for using them. The use of the ad hoc modules was less widespread than the use of the annual variables. Users emphasised their strong need for more detailed microdata.
The results of the USS concerning the overall quality of statistics on living conditions and social protection are summarised in the figure below (% of respondents).
Figure 3: Overall quality of statistics on living conditions and social protection, 2024, 2019
Source: User satisfaction survey 2024, 2019
12.3. Completeness
The list of variables to be collected and transmitted to Eurostat is set out in EU regulations (Legislation – Income and living conditions) and described in the methodological guidelines for the operational year.
Countries list and describe any cases where some of the variables are not collected or where they deviate from the methodological guidelines for the operational year. For more information, please see ‘Annex 3 – Income variables – deviations from EU-SILC definitions’, or consult the national quality reports.
12.3.1. Data completeness - rate
Data should be transmitted according to the methodological guidelines for the operational year. When a variable is not collected or is missing, the respective flag must be used. For more information, please consult the national quality reports.
13.1. Accuracy - overall
The concept of accuracy refers to the precision of estimates computed from a sample rather than from the entire population. Accuracy depends on sample size, sampling design effects and the structure of the population being studied. In addition, sampling errors and non-sampling errors need to be considered. Sampling error means the variability that occurs at random due to using a sample rather than a census, and non-sampling errors are errors that occur in all phases of the data collection and production process.
From 2021
EU regulation 2019/1700 lays down the requirements relating to geographical coverage, detailed sample characteristics, including subsampling, in accordance with Annex III to that Regulation, sampling characteristics, common data gathering periods, common standards for editing and imputation, weighting, estimation and variance estimation.
Furthermore, Annex II to Regulation (EU) 2019/1700 – Precision requirements, lays down the following:
Precision requirements for all data sets are expressed in standard errors and are defined as continuous functions of the actual estimates and of the size of the statistical population in a country or in a NUTS 2 region.
The estimated standard error of a particular estimate must not be greater than the following amount:
The function shall have the form of
The following values for parameters shall be used:
N
a
b
Ratio at‐risk‐of‐poverty or social exclusion to population
Number of private households in the country in millions, rounded to 3 decimal digits
900
2600
Ratio of at‐persistent‐risk‐of‐poverty over four years to population
Number of private households in the country in millions, rounded to 3 decimal digits
350
1000
Ratio at‐risk‐of‐poverty or social exclusion to population in each NUTS 2 region (see *)
Number of private households in the NUTS 2 region in millions, rounded to 3 decimal digits
600
0
When countries obtain negative f(N) values with the parameters expressed above, they shall be exempt from the corresponding requirement.
(*) For the estimated ratio at‐risk‐of‐poverty or social exclusion to population in each NUTS 2 region, those requirements are not compulsory for NUTS 2 regions with less than 0.500 million inhabitants, provided that the corresponding NUTS 1 region complies with this requirement. NUTS 1 regions with fewer than 100 000 inhabitants are exempt from the requirement.
Before 2021
According to EU regulation 1982/2003 on sampling and tracing rules, the cross-sectional and longitudinal (initial sample) data for all components of EU-SILC (whether survey- or register-based) were to be based on a nationally representative probability sample of the population of the country residing in private households, irrespective of language, nationality or legal residence status. The sampling frame and methods of sample selection ensured that every individual and household in the target population was assigned a known and non-zero probability of being selected.
EU regulation 1177/2003 set the minimum effective sample sizes to be achieved. It laid down that the actual sample sizes had to be larger to the extent that the design effect exceeded 1.0 and had to compensate for all kinds of non-response. Furthermore, the sample size referred to the number of valid households, i.e. households for which (and for all members of which) all or nearly all the required information had been obtained. The effective sample size was determined according to the size of the country, and it ensured minimum precision criteria for the key indicator at national level (absolute precision of the at-risk-of-poverty rate of 1%).
13.2. Sampling error
EU-SILC is a complex survey involving different sampling designs in different countries. In order to harmonise and make sampling errors comparable among countries, a ‘linearisation’ technique is applied, coupled with the ‘ultimate cluster’ approach, for variance estimation.
Linearisation is a technique that uses linear approximation to reduce non-linear statistics to a linear form, justified by the asymptotic properties of the estimator. This technique can encompass a wide variety of indicators, including EU-SILC indicators. The ‘ultimate cluster’ approach is simplification consisting of calculating the variance by considering only variation among primary sampling unit totals. This method requires the first-stage sampling fractions to be small, which is nearly always the case. This method allows great flexibility and simplifies the calculation of variances. It can also be generalised to calculate the variance of differences from one year to another.
The main hypothesis on which the calculations are based is that the ‘at-risk-of-poverty’ threshold is fixed. According to the characteristics and availability of data for different countries, different variables are used to specify strata and cluster information.
Countries have been split into three groups:
1) Belgium, Bulgaria, Czechia, Ireland, Greece, Spain, France, Croatia, Italy, Latvia, Hungary, Poland, Portugal, Romania, Slovenia and Serbia, whose sampling design could be assimilated to a two-stage stratified type, used DB050 (primary strata) for strata specification and DB060 (primary sampling unit) for cluster specification.
2) Denmark, Germany, Estonia, Cyprus, Lithuania, Luxembourg, the Netherlands, Austria, Slovakia, Finland, and Switzerland, whose sampling design could be assimilated to a one-stage stratified type, used DB050 for strata specification and DB030 (household ID) for cluster specification.
3) Malta, Sweden, Iceland and Norway, whose sampling designs could be assimilated to simple random sampling, used DB030 for cluster specification and no strata.
Countries provide the sampling error for incomes and the standard error. Standard errors of key indicators are commonly used as a measure of the reliability of data collected through sample surveys. The EU-SILC survey was designed to estimate the at-risk-of-poverty rate with an absolute precision of approximately one percentage point. The sample sizes were defined taking this accuracy requirement into account. Member States estimate variances for the main indicators using programmed linearisation, jackknife, and bootstrap techniques. For further information, please consult the EU and national quality reports.
13.2.1. Sampling error - indicators
The concept of accuracy refers to the precision of estimates computed from a sample rather than from the entire population. Accuracy depends on sample size, sampling design effects and the structure of the population being studied. In addition, sampling errors and non-sampling errors need to be considered. Sampling error refers to the variability that occurs at random due to using a sample rather than a census, and non-sampling errors are errors that can occur at any stages of the data collection and production process.
This section describes the closeness of computations or estimates to the exact or true values that the statistics were intended to measure (accuracy) and the closeness of the initial estimated value to the subsequent value (reliability).
Annex 4 – Sampling errors shows the estimates for the leading indicator ‘People at risk of poverty or social exclusion (AROPE)’ and its components, namely: at-risk-of-poverty rate, persistent risk of poverty, people living in households with very low work intensity and severe material deprivation rate.
Some countries use additional national data to get more precise estimates for the main indicators (Belgium, Germany, France, Croatia, Italy, Latvia, Lithuania, Hungary, Malta, Netherlands, Austria, Poland, Portugal, Romania, Finland and Sweden).
13.3. Non-sampling error
Non-sampling errors are classified into four types:
Coverage errors: errors due to divergences between the target population and the sampling frame.
Measurement errors: errors that occur at the time of data are collected. There are several sources for these errors, such as the survey instrument, the information system, the interviewer and the mode of collection.
Processing errors: errors in post-data-collection processes such as data entry, coding, editing and weighting.
Non-response errors: errors due to an unsuccessful attempt to obtain the desired information from an eligible unit. Two main types of non-response errors are considered:
unit non-response refers to an absence of information for the entire unit (households and/or persons) selected for the sample;
item non-response refers to a situation where a response has been successfully obtained for a sample unit, but not all the required information has been obtained.
Normally, these errors are addressed at national level. Specific cases are described in thenational quality reports.
13.3.1. Coverage error
Coverage errors are caused by imperfections of the sampling frame with respect to the target population of the survey. Coverage errors include over-coverage (units wrongly included even thought out of scope or non-existent), under-coverage (units not included in the sampling) and misclassification (incorrect classification of units belonging to the target population).
In EU-SILC, two main groups can be identified in terms of the sampling source used. Some countries have relied on household information from population registers. Other countries have used census databases to select addresses. To ensure the best coverage, both sources need to be regularly updated.
A systematic source of coverage problems is the time lag between the reference date for selecting the sample and the fieldwork period, which should be as short as possible. In addition, some countries carried out EU-SILC as a subsample of the units (addresses) that successfully answered other existing surveys. Assuming that there is selective non-response in these surveys, this may entail selection bias (under-coverage).
13.3.1.1. Over-coverage - rate
Over-coverage: cases related to wrongly classified units that are in fact out of scope, or to units that do not actually exist.
Non-response errors are errors due to an unsuccessful attempt to obtain the desired information from an eligible unit.
Two main types of non-response errors are considered: unit non-response and item non-response.
13.3.3.1. Unit non-response - rate
Unit non-response occurs when a household refuses to cooperate or is away during the fieldwork period. Other reasons can explain unit non-response, such as the questionnaire being lost or the household being unable to respond because of incapacity or illness. It may also happen that a person in a household refuses to cooperate, although the household interview has been accepted (‘individual’ non-response). Countries increase the sample in cases of high non-response for the first wave or in cases where there was an increase in the number of rotations used.
Commission regulations define indicators for measuring unit non-response in EU-SILC: address contact rate (Ra), household response rate (Rh) and individual response rate (Rp). In addition, models must be used to correct non-responses. Most countries apply either a standard poststratification based on homogeneous response groups or a more sophisticated logistic regression model. Individual non-response rate appears to be marginal and most countries impute the missing individual questionnaires. More information about the contact rate and response rate is provided in ‘Annex 5 - Sampling size, rotation and non-response rate’.
13.3.3.2. Item non-response - rate
Item non-response refers to a situation where a sample unit has been successfully enumerated, but not all the required information has been obtained.
Item non-response typically occurs when the interviewee does not answer a question because they consider it too personal, too sensitive or difficult to understand.
Item non-response is high for some income components, and it has been addressed with imputation. This technique aims to ‘fill the holes’ in a distribution, and only unit non-response can be assumed. The computation of item non-response is essential to fulfilling the precision requirements. In national quality reports, the item non-response rate is provided for the main income variables both at household and personal level. In cases where a record is imputed for a specific variable, this will be reflected in the variable flags.
13.3.3.2.1. Item non-response rate by indicator
The national quality reports contain information on the imputation of households and personal incomes. The imputation process is done at national level and is described in the national quality reports.
13.3.4. Processing error
Processing error refers to errors generated during data collection. The household and individual follow-up rules and tracking rules should be applied in accordance with Article 8 of EU regulation 2019/2242. In the national quality reports, countries should describe the errors generated due to data editing, data entry and imputation (Article 9, EU regulation 2019/2242). Some errors are detected by the data-checking process applied by Eurostat. These checks include structural checks, logical checks, year to year comparisons and descriptive statistics. The process also detects simple errors related to wrong identifiers, modalities, flags, outliers, consistency, etc.
13.3.5. Model assumption error
In their national quality reports, countries describe the methods and models (when available) used to treat specific sources of errors and how they deal with the errors at the national level. Calibration is often used to treat such errors.
14.1. Timeliness
IESS (EU regulation 2019/1700) establishes the timeliness of data transmissions from the national statistical institutes. In the first years of implementing the IESS Regulation, some countries were granted a new deadline for data submission, as specified in the Annex to EU regulation 2020/2050.
Pursuant to Annex V to the IESS Regulation, for the income and living conditions domain, Member States must submit pre-checked microdata without direct identifiers according to the following deadlines:
(a) variables for the data collection of year N should be transmitted by the end of year N (cross-sectional and longitudinal variables, cross-sectional weights), but in exceptional cases, provisional microdata concerning income may be transmitted by the end of year N and revised data by 28 February of year N+1;
(b) variables related to the observation covering the years of the rotation scheme ending in year N (longitudinal weights) should be transmitted by 31 October of year N+1.
According to the Regulation, the aggregated data will be published on the Eurostat website as soon as possible, within six months of the transmission deadline for annual and infra‐annual data collection, and within 12 months of the transmission deadline for other data collection, except in duly justified cases.
14.1.1. Time lag - first result
Indicators based on national SILC data are published as soon as Member States’ data are validated. For the EU-SILC 2022 data collection, the following deadlines were applied:
mid-June of year N: complete set of data relating to year N-1 (excluding longitudinal weights);
end of September of year N: user database (scientific use files released to researchers);
mid-October of year N: complete set of data relating to year N-1 (including longitudinal weights).
For more information, please consult the release calendar on the Eurostat website.
14.1.2. Time lag - final result
The final data are published after they have been checked and validated by Eurostat, taking into account the deadlines described in Concept 14.1.
14.2. Punctuality
Punctuality refers to the time lag between the target date for data delivery and the actual delivery date. For 2024, most countries were able to meet the deadline. Please consult the national quality reports.
14.2.1. Punctuality - delivery and publication
Data were checked, validated and disseminated as soon as they were received from countries.
15.1. Comparability - geographical
To ensure comparability of data and/or indicators, i.e. to ensure quality of data as defined by Eurostat, EU-SILC has adopted an ex ante output harmonisation strategy. When using output harmonisation, the survey design and methods are flexible, as long as the output requirements are met. Countries have to define suitable national concepts and measurement procedures for implementing the international concept. There are two different strategies, depending on when the survey design is planned:
Ex ante harmonisation: the surveys are created by countries with the output to be produced in mind;
Ex post harmonisation: countries can adapt surveys already in place to produce comparable outcomes.
The EU-SILC common framework aims to ensure standardisation at different levels. Conceptual standardisation is achieved by defining and documenting the common concepts/definitions underlying each measure/variable, the scope and the time reference.
Implementation and process standardisation is achieved by editing data to ensure that recommendations are followed. These recommendations concern the collection unit, the sample size to be achieved for each country, the recommended design for implementing EU-SILC (rotational panel), common requirements for sampling, tracing rules for the longitudinal components, and common requirement for imputation and weighting procedures. International classifications aimed at maximising comparability of the information produced are also enforced.
Specific fieldwork aspects are also controlled by the framework in order to limit the use of proxy interviews; limit the use of controlled substitutions; limit the interval between the end of the income reference period and the time of the interview; limit the extent of total fieldwork for one-shot surveys; define precise follow-up rules for individuals and households in the event of refusals; and limit noncontact. Eurostat and Member States work together to develop common guidelines and procedures aimed at maximising comparability.
The EU-SILC survey design remains flexible. EU-SILC flexibility is a key aspect allowing it to be adapted to national specificities in terms of infrastructure and measurement. The most important aspect of the flexibility relates to the data sources to be used (administrative or interview). Eurostat encouraged the use of existing ones, whether they are surveys or registers. A second aspect of the flexibility relates to the survey and sampling design. The only constraint is that, for both the cross-sectional and longitudinal components, all household and personal data have to be linkable at micro level. Countries can use survey vehicles already in place or set up a new survey, possibly drawing on one recommended by Eurostat. Sampling design can draw on social survey expertise at national level. The third aspect of flexibility relates to measuring self-employment income, for which the diversity of sources and practices did not allow common harmonised solutions to be found.
15.1.1. Asymmetry for mirror flow statistics - coefficient
Not applicable.
15.2. Comparability - over time
Since 2005, comparability over time has been ensured by a common data source, EU-SILC. Due to the transition between the end of the European Community Household Panel (ECHP) and the start of the EU-SILC, there were disruptions in series between 2001 and 2005.
Starting from 2020, and in particular from 2021, many countries were impacted partly or fully by breaks in time series (Belgium, Germany, Denmark, Ireland, France, Croatia, Lithuania, Luxembourg, Hungary, Malta, Poland, Portugal, Slovenia, Finland, Sweden, Switzerland and Norway) (Please see Concept 19).
In 2021, new legislation on implementing EU-SILC came into force, revising and improving the survey (see Section 3.4). The new legislation provided for multiple changes to EU-SILC data collection, in particular:
it enforced the need for the following improvements: improved timeliness, with shorter deadlines for EU-SILC data submission;
it reformulated precision requirements at national and regional level (NUTS2) for the at-risk-of-poverty-or social-exclusion indicator and the persistent-risk-of-poverty rate;
additional/changed EU-SILC variables;
data collection with three frequencies: nucleus, three-year module and six-year module, and the recommendation to extend the longitudinal panel.
Specific variables, indicators or the national SILC were influenced by several factors, including the: implementation of the IESS Regulation, COVID-19, changes to the sample, the interview method, the number of rotations used, etc. For some countries, the impact was not related to COVID-19 or implementing IESS, meaning the break in series occurred before 2020.
For detailed information about significant changes and breaks in time series, as well as other changes considered relevant, please see the overview of breaks in series on the Eurostat website.
15.2.1. Length of comparable time series
EU-SILC provides comparable results across years. Countries implement EU-SILC according to the methodological guidelines, which provide modalities and model questions. Nevertheless, specific circumstances (i.e. the impact of COVID-19, moving to a larger rotation scheme, changing the mode of data collection, etc.) affect the time series.
These changes are highlighted by countries in their national quality reports as breaks in series.
15.2.2. Comparability and deviation from definition for each income variable
Comparability and deviations from definitions for each income variable are provided in the national quality reports and in Annex 2 – Income variables – deviations from EU-SILC definitions. Some of the income variables are not collected (please see the national quality reports).
15.3. Coherence - cross domain
A comparison with external sources for all income target variables, and the number of persons who receive income from each ‘income component’ are provided where the Member States concerned consider such external data to be sufficiently reliable.
These cross-domain comparisons are reported in the national quality reports, mainly with the Household Budget Survey (HBS), the Labour Force Survey (LFS), National Accounts and/ or Social Protection Accounts. In addition, some countries compared the data with administrative sources or with other sources.
The sets of weights available in EU-SILC datasets are obtained through calibration techniques, which ensure the basic coherence of the estimates obtained from EU-SILC micro datasets and demographic counts. Additional information can be found in the national quality reports.
15.3.1. Coherence - sub annual and annual statistics
Not applicable.
15.3.2. Coherence - National Accounts
Most countries provided comparisons of the main target variables with National Accounts. The methodological background for comparisons is provided in the Methodological comparison of household income in EU-SILC and National Accounts. More information is provided in the national quality reports.
15.4. Coherence - internal
Countries report instances of lack of coherence within the EU-SILC data when observed. In 2024, countries did not report any significant inconsistencies in their national quality reports.
EU-SILC was designed to limit the burden on respondents, to avoid a high non-response rate and to ensure the quality of the information collected. The method of interview has a significant impact on interview duration. In 2024, the average interview lasted more than 60 minutes for Bulgaria, Luxembourg, Romania, Poland and Germany, while for some countries the interview duration per household was less than 30 minutes (Netherlands, Italy, Latvia and Denmark).
Annex 2 – Mode of data collection and fieldwork provides more information about the length of interview by country.
All reported errors (once validated) result in the disseminated data being corrected.
Reported errors in the disseminated data are corrected as soon as the correct data have been validated.
Data may be published even if some countries’ data are missing or flagged as provisional or of low reliability. Such data are replaced with the final validated data once transmitted, and European aggregates are updated accordingly.
Whenever new data are provided and validated, the data already disseminated are updated. There is no specific update schedule for incorporating new data that have been provided ‘spontaneously’.
Previously released EU-SILC data may be revised if adjustments are implemented at national level (for example new census data becoming available) or in other exceptional cases (for example changes in the indicator definitions or in the EU-SILC methodology).
No substantial country-specific revisions are applied at national level (the main driver of data revisions are changes coordinated within the European Statistical System (ESS)).
The EU-SILC team promptly shares information on any data revision with the Income and Living conditions Working Group members and the Social Protection Committee – Indicators Sub-Group.
Countries applying revisions at national level should describe the methodology and analyse the impact. The information is provided in Annex 11 – EU-SILC data revisions to the national quality reports for the relevant operational year.
17.2.1. Data revision - average size
Not available.
Detailed information concerning sampling frame, sampling design, sampling units, sampling size, weightings and mode of data collection can be found in this section (please see below). Such information is mainly used for the computation of the accuracy measures.
18.1. Source data
EU-SILC combines survey and administrative data. Most countries use survey and administrative data combined; others use only survey data (e.g. Czechia, Germany, Greece, Luxembourg, Hungary, Poland, Romania and Slovakia) (for more information, please see Annex 6 – EU-SILC data sources used).
The EU regulation 2019/1700 requires nationally representative probability samples to be selected. The data are to be based on a nationally representative probability sample of the population residing in private households within the country, irrespective of language, nationality or legal residence status.
All private households and all persons aged 16 and over within the household are eligible. Persons living in collective households or institutions are generally excluded from the target population.
Figure 4: Data sources, 2024
Source: EU-SILC microdata 2024 (extraction March 2025).
Note: Figure 4 includes only the data source of individual questionnaires (P-file) (Please see ‘Annex 6 - EU-SILC data sources used’ for more information).
18.1.1. Sampling Design
Pursuant to the IESS regulation, starting from 2021 onwards, Eurostat has recommended using at least a four-year rotational design. Belgium, Bulgaria, Ireland, Italy, the Netherlands and Sweden are using a six-year rotation design (please see Table 5 in Annex 5). The sampling frame and the methods of sample selection should ensure that every individual and household in the target population is assigned a known probability of selection that is not zero.
18.1.2. Sampling unit
The sampling unit can be the address/dwelling, the household or the individual, according to the design chosen by the country. When a sample of dwellings/addresses is drawn, and more than one household shares the same dwelling, the dwelling is treated as a cluster of households. Households are clusters of individuals, and all members of a selected household aged 16 and over at the end of the income reference period are eligible to be included in the sample. Countries that sample individuals, on the other hand, select only persons aged 16 and over, and the household is defined as the household of which the selected person is a member at the beginning of the survey. Denmark, Iceland, Finland, the Netherlands, Slovenia, Sweden and Norway select a sample of individuals, while 13 countries (Czechia, Germany, Spain, France, Croatia, Ireland, Latvia, Luxembourg, Hungary, Austria, Poland, Portugal and Romania) select a sample of dwellings or addresses. The remaining countries selected a sample of households. More information is reported in the national quality reports.
18.1.3. Sampling frame
Concerning the SILC instrument, three different sample size definitions can be applied:
gross sample (or initial sample), which is the number of sampling units selected in the sample;
achieved sample size (or net sample), which is the number of sampling units observed (household or individual) with an accepted interview;
effective sample size, which is defined as the achieved sample size divided by the design effect of the indicator for the atrisk-of-poverty rate.
For additional information, see Annex 5 – Sampling size, rotation and non-response rate.
18.2. Frequency of data collection
EU-SILC data are collected annually in each country. In addition, a set of variables collected every three years, every six years or on an ad hoc basis are included in EU-SILC in line with the multiannual rolling planning, EU regulation 2020/256.
EU-SILC data collection is governed by EU regulation 2019/1700, as well as by EU regulation 2019/2242. Information can be collected either from registers or from interviews. In general, five different ways of collecting data from interviews are allowed: Paper-Assisted Personal Interview (PAPI), Computer-Assisted Personal Interview (CAPI), Computer-Assisted Telephone Interview (CATI), Computer-Assisted Web Interview (CAWI) and self-administrated questionnaires.
Figure 5: Interview mode, 2024
Source: EU-SILC data 2024 (extraction November 2025)
Most countries use several modes of data collection, mainly CATI and CAPI, while PAPI, CAWI and self-administered modes are used by fewer countries. In some countries, PAPI and CAPI remained the main data collection modes (e.g. Bulgaria, Czechia, Ireland, Greece, France, Romania, Portugal, Slovakia, Serbia and Türkiye). Starting from 2021, many countries decided to change their mode of data collection from personal interviews to telephone interviews or web-based interviews. In 2024, CATI was the main data collection mode for most countries (Belgium, Estonia, Cyprus, Latvia, Lithuania, Hungary, Malta, Slovenia, Finland, and Norway).
In Germany, Denmark, Luxembourg, the Netherlands and Sweden, the main method of data collection was CAWI. It was also widely used in Spain, Austria, Finland and Estonia. Germany partly used a new mode of data collection, namely a paper questionnaire with self-enumeration (PASI).
Annex 2 and Figure 2 summarise the fieldwork period by country, where the figures correspond to the month of the household interview. The fieldwork duration for the 2024 operation varied significantly between countries. It lasted from less than three months (Bulgaria, Denmark, France, Hungary, Romania and Serbia) to around eight months (Cyprus and Greece). All countries started data collection before June and most of them finished the fieldwork period by the end of August. Countries which finished later include Cyprus, Luxembourg and the Netherlands (September), and Greece (November).
18.4. Data validation
A comprehensive validation procedure is applied before finalising the EU-SILC database for each cross-sectional and longitudinal ‘wave’ (year of survey plus any reworking of data for previous years). Source data are initially reviewed at national level. It is subsequently submitted to Eurostat for multilateral validation together with a detailed quality report. Bilateral exchanges are carried out as necessary. At the end of national-level data processing, Eurostat performs the complete checking procedure using the SAS software, then the indicators are calculated. A summary report of the errors identified by the checking tool is submitted to Eurostat. The rules applied by Eurostat are the same as those used by countries when running the checking tool.
18.5. Data compilation
Estimates at aggregate level (e.g. EU-27) are calculated as the population-weighted arithmetic average of individual national figures. Aggregates covered include: EU-27 (from 2020), EU-28 (2013-2020), EU-27 (2007-2013), EU-25 (2004-2006), EU-15 (1995-2004), NMS10 (New Member States - 10 countries (2004-2006)) Euro area (EA11-1999, EA12-2001, EA13-2007, EA15-2008, EA16-2009, EA17-2011, EA18-2014, EA19-2015, EA20-2023), Euro area –20 countries (from 2023), Euro area –19 countries (2015-2022) and Euro area – 18 countries (2014). Estimates of the EU aggregated indicators are calculated if EU coverage in terms of the EU population is 70% or larger. Indicators are computed as the population-weighted average of national indicators. For 2024, EU-SILC data are available for EU-27, Norway, Switzerland, Serbia and Türkiye (Eurostat, EU-SILC 2024 data extraction November 2025).
Weights are provided by national statistical institutes as part of the data sets. All necessary imputations are done at national level and the respective flag for the variable imputed is provided.
18.5.1. Imputation - rate
Imputation is the process used to assign replacement values for missing, invalid or inconsistent data that fail quality checks. Imputation rates for income variables are provided in the national quality reports. Imputations are applied at national level and not at EU level. A proper flag is used in cases where the variable is imputed. Each country describes its imputation process in its national quality report.
This metadata concept complements the information provided in Sections 18.5 and 13.3.4.
18.5.2. Weighting methods
Weights are provided by each country in their data files. Eurostat does not calculate weights as calibration, and non-response adjustments are performed at the level of Member States. There are three types of weight:
cross-sectional personal weights;
cross-sectional household weights;
longitudinal personal weights.
Additional weights are used in some modules to adjust for non-response or the absence of proxy. The weighting procedure is described in the national quality reports for each country.
18.5.3. Estimation and imputation
Eurostat calculates all aggregates from the microdata. Population-weighted arithmetic averages are applied to the aggregates. The EU-SILC weights (i.e. the sum of the national population living in private households, broken down by the required dimensions of the indicators) are used for this process.
Eurostat does not receive or publish aggregates calculated by national statistical institutes (NSIs). More information on estimation and imputation procedures is available in the national quality reports for each country.
18.6. Adjustment
Missing survey data are imputed using procedures specified in EU regulation 1981/2003 on EU-SILC. This includes income data, household composition data and other items.
18.6.1. Seasonal adjustment
Not applicable.
The metadata are issued in the SIMS format for EU-SILC.
19.1 Specific descriptions from 2024 national quality reports
Reference population and household membership
Belgium: Tertiary students’ usual residence is their private address in their university town, although they return to their parental home during the weekend. They remain officially registered at their parents’ address. In BE-SILC, they belong to their parents’ household.
Estonia: Persons living in collective households are included in the reference population. The share of persons living in collective households and who are not members of another private household is likely to be very low. Moreover, there is no feasible way to estimate the share of these persons in the total population. Thus, excluding them is unlikely to affect the comparability and reliability of the estimates.
Methods of calculating the variance, standard error and confidence interval for the main indicators (AROPE, AROP, SMDS, LWI)
Some countries use their national method to estimate precision requirements for the main indicators.
Belgium: standard errors are estimated using the jackknife repeated replication (JRR) method. The clusters are the groups, with the strata made by two (or three) groups, using the sampling order.
The design effect for the median equivalised disposable income is 1.16.
Bulgaria: In the 2024 survey year, Bulgaria used the bootstrap variance estimation technique to obtain the standard error for the main indicator of interest, AROPE. In total, 100 replicate samples were drawn. The replicate weights were obtained using a calibration approach, which was identical to the calculation of RB050 weights. This additional procedure provides an unbiased estimator for the population totals and increases precision. The standard error was calculated using information from the 100 replicate samples, where the PSU sample size is a reflation of the sample size of the main survey for the corresponding year.
Germany: variance estimation for cross-sectional indicators is performed in Germany using Statistics Sweden’s SAS estimation software ETOS 2 - Estimation of Totals and Order Statistics.
France: for the variance at national level, estimates with a linearisation of the AROPE and persistence in poverty were tested with no significant gain. In a conservative approach, more traditional precision estimators (Horvitz-Thompson-Narain estimators or calibrated estimators) were used.
For variance at the level of NUTS 2 regions, the small area method used is equivalent to regressing interest variables on the auxiliary variables used to construct the small area weights. This equivalence between the synthetic estimator and a regression is exploited when calculating the variance by calculating the variance of the estimate using the linearisation approach on regression coefficients (this allows a variance to be calculated on the small area weights, which can be negative).
Croatia: the Sampling, Statistical Methods and Analyses Department calculates the indicators and the variance in the R programming language.
Italy: sampling errors of the main indicators are calculated using national methods in order to take into account the sampling design effects.
Latvia: the Central Statistical Bureau uses its own methodology for calculating sampling errors using R (package vardpoor).
Lithuania: variance for the main indicators (AROPE, etc.) is calculated using a different method from Eurostat (for reference see Annex A to Concept 13.2.1). Standard errors and calibrated weights are calculated using the SAS macro CLAN (CLAN97.sas) developed by Statistics Sweden. CLAN computes an estimate of a parameter q and an estimate – based on Taylor linearisation – of the standard error . The generalised regression (GREG) estimator is used with auxiliary information.
Hungary: the standard error calculation is based on the linearisation method, which takes into account the characteristics of the sampling plan and the effects of calibration.
Malta: the standard error of the main indicators is calculated in R using the vardomh() function, which estimates the variance of sample surveys within domains using the ultimate cluster method. This approach applies a jackknife-like technique where clusters (usually primary sampling units) are systematically omitted to create replications, approximating the sampling variance.
The persistent-risk-of-poverty ratio is calculated in SPSS. The dataset is filtered to include only the survey year, and weighted using the four-year longitudinal weight. The standard error is computed with the final value being adjusted by the Kish Effect. The value is then used to obtain the upper and lower confidence intervals.
Netherlands: the national method is used to calculate variance for the main indicators (AROPE, etc.). These variances have been estimated taking into account the sampling design, various stages of non-response attrition and the weighting to known population control totals. The weighting not only reduces bias due to selective non-response, but also reduces the variances of most SILC indicator estimates.
Austria: the calibrated bootstrap procedure is used with the R Package ‘surveysd’ developed by the Methods Department of Statistics Austria.
Poland: sampling errors of indicators for the quality report were estimated using the ultimate cluster method and linearisation. Calibration of the weights was also taken into account. The R package vardpoor was used in the calculations.
Portugal: the standard error estimates are obtained using the jackknife resampling method, which makes it possible to calculate variances for totals (linear estimators) and for the quotient of totals and differences of quotients (non-linear estimators). This method is recommended when a complex sampling design and calibrated estimators are involved, as is the case with implementing the Portuguese EU-SILC survey, called ICOR.
Romania: at national level, variance estimation is performed using the Taylor linearisation method implemented in the Regenesses package in R, considering the characteristics of the sample design.
Finland: Sampling errors for the main indicators of the Finnish data are calculated using an estimation technique based on the with rescaled bootstrap by taking both the sampling design and weighting into account, with 1,000 replications in total by panels. The calculations are performed using SAS programs.
Sweden: note that all the standard errors published by Statistics Sweden, as well as the standard errors of the main indicators used for the quality assessment and presented in Annex A of the EU-SILC quality report, were calculated in line with the national framework, with stratification, clustering as well as household size taken into account. Calculations were made using SAS macro ETOS - Estimation of Totals and Order Statistics, which was designed to compute point and standard error estimates of totals and order statistics (parameters) from sample surveys, as well as rational functions of those parameters. Based on the ETOS 2.0 user guide (2012), the estimating equations (EE) technique was used to estimate the variance of the order statistics, and the Taylor linearisation method was used for the variance estimation of non-linear functions like ratios and products.
Serbia: Standard errors were calculated by using the bootstrap replication method, which represents a type of repeated resampling method. The general characteristic of repeated resampling method and therefor also of the bootstrap is to draw (sub-) samples from the original sample and to calculate the population parameter of interest from each sample. The variance estimation is then based on the distribution of the several estimates.
Break in time series by year
Indicators: for Portugal, the methodology for calculating household type differs from that used by INE (available on the website of the Portugal Institute National of Statistics).
Coverage: France: since 2022, the survey has also covered four overseas departments: Guadeloupe, Martinique, French Guiana and Réunion.
Methodological changes
Denmark: in 2024, the questions relating to general health variables were changed to better align with Eurostat recommendations (PH010 and PH030).
Croatia: in 2024, several methodological changes were implemented. Imputation was significantly reduced, and the questionnaire was shortened. Moreover, the collection of some income sources from administrative data affected both income variables and the length of the questionnaire.
Italy: To ensure comparability with other countries and to comply with the methodological guidance provided, the question on severe limitations was revised. As a result, a break in the series was reported for variable PH030 in 2024.
Luxembourg: design adjustments affected by the COVID-19 crisis, as well as the introduction of a mixed mode of data collection, resulted in a break in the series for 2020 and the absence of four-year longitudinal data for 2020-2023.
Portugal: administrative data relating to the personal income tax on old-age pensions in the contributory system were used for the first time in 2024, in order to improve the consistency and quality of information before deducting taxes and social contributions. In addition, the variable PH030 (Limitation in activities because of health problems) was revised according to EU-SILC guidelines.
Sweden: in 2022, the data collection method in the Swedish SILC was changed from CATI to a mixed mode combining CAWI and CATI. This may have led to breaks in the time series for certain 2024 module variables (RC380, RC390, RCH010, HD120, HD140, HD160 and HD190).
Weighting
Belgium: BE SILC recalculated the weights for the years 2019–2024. This revision was carried out to improve the estimation of the representative population, after an overestimation of the 0–15 age group was identified.
Hungary: the annual datasets for the 2019-2024 collections were revised in the second quarter of 2025. One of the objectives of the revision was to reweight the datasets using benchmark figures derived from the 2022 census. Methodological procedures were further developed, in particular with regard to fine-tuning the grossing, imputation and correction methods for income data.
For detailed information about significant changes and breaks in time series, please see the overview of breaks in series.
The European Union Statistics on Income and Living Conditions (EU-SILC) collects timely and comparable multidimensional microdata on income, poverty, social exclusion and living conditions.
The EU-SILC collection is a key instrument for providing the information required by the European Semester([1]) and the European Pillar of Social Rights. It is also the main source of data for microsimulation purposes and for producing flash estimates of income distribution and poverty rates.
The indicator of persons at risk of poverty or social exclusion (AROPE) remains crucial for monitoring European social policies, especially for monitoring the EU 2030 target on poverty and social exclusion. For more information, please consult EU social indicators.
The EU-SILC instrument provides two types of data:
cross-sectional data pertaining to a given time or a certain time period with variables on income, poverty, social exclusion and other living conditions;
longitudinal data pertaining to individual-level changes over time, observed periodically with a rotation scheme of four or more years (Annex III(2) to EU Regulation 2019/1700).
EU-SILC collects:
annual variables;
three-yearly modules;
six-yearly modules;
ad hoc modules addressing new policy needs;
optional variables.
The variables collected are grouped by topic and detailed topic, and transmitted to Eurostat in four main files (D-File, H-File, R-File and P-file).
The ‘Income and Living Conditions’ domain covers the following topics: persons at risk of poverty or social exclusion, income inequality, income distribution and monetary poverty, living conditions and material deprivation. It also covers EU-SILC ad hoc modules, which are organised into collections of indicators on specific topics.
([1]); The European Semester is the European Union’s framework for coordinating and monitoring economic and social policies.
19 December 2025
Statistical concepts and definitions for EU-SILC are specified in EU regulation 2019/1700, EU regulation 2019/2181, and EU regulation 2019/2242. The basic Regulation and its implementing and delegated acts provided for multiple changes to the EU-SILC data collection starting from 2021.
Countries must follow Annex II to EU regulation 2019/2242, where the list of variables is set out, including their modalities, flags, unit and reference period. A more detailed description of the list of variables as well as information on their implementation are available in the methodological guidelines.
The information collected in EU-SILC pertains to the following types of statistical units: private households and persons living in those households. Annex II to EU regulation 2019/2242 defines the specific statistical units for each variable, while Annex IV to the same Regulation specifies the content of the quality reports on the organisation of a sample survey in the income and living conditions domain, pursuant to EU regulation 2019/1700 of the European Parliament and of the Council.
The target population is private households and all persons composing these households having their usual residence in the national territory. A private household means a person living alone or a group of persons who live together, providing for themselves the essentials of living.
The data refer to the Member States, Iceland, Norway, Switzerland, United Kingdom, Albania, Bosnia and Herzegovina, Montenegro, North Macedonia, Serbia, Türkiye and Kosovo([2]) – national territory and NUTS II level.
EU-SILC may exclude small parts of the national territory amounting to no more than 2% of the national population, and the national territories defined in Article 6 of EU regulation 2019/2242.
Specific cases of coverage areas apply to the following countries:
France: France excluding Mayotte. Four overseas departments (Guadeloupe, Martinique, French Guiana and Réunion) have been included since the 2022 data collection.
Ireland: Ireland including the following offshore islands: Achill, Bull, Cruit, Gorumna, Inishnee, Lettermore, Lettermullan and Valentia.
Malta: Malta and Gozo.
Netherlands: Kingdom of the Netherlands excluding overseas territories.
Cyprus: Government-controlled areas of the Republic of Cyprus.
Portugal: The whole national territory, including the mainland and the two autonomous regions (Região Autónoma dos Açores and Região Autónoma da Madeira).
Norway: Norway except Svalbard.
([2]) This designation is without prejudice to positions on status and is in line with UNSCR 1244/1999 and the ICJ Opinion on the Kosovo declaration of independence.
The reference period is the survey year. The nucleus or annual variables are collected yearly using the reference period, as specified in Annex II to, and Article 7(1) of, Regulation (EU) 2019/2242 as well as in the methodological guidelines.
For all countries, the reference period for income variables in EU-SILC is the previous calendar year. Until 2019, Ireland collected income information for the 12-month period immediately preceding the sample household’s interview date. For most countries, the fieldwork was carried out from January to July 2024. The lag between the income reference period and data collection period varies across countries. However, for most countries, the data collection took place at the beginning of 2024 (Figure 2).
Figure 2: Lag between the income reference period and data collection, 2024
The concept of accuracy refers to the precision of estimates computed from a sample rather than from the entire population. Accuracy depends on sample size, sampling design effects and the structure of the population being studied. In addition, sampling errors and non-sampling errors need to be considered. Sampling error means the variability that occurs at random due to using a sample rather than a census, and non-sampling errors are errors that occur in all phases of the data collection and production process.
From 2021
EU regulation 2019/1700 lays down the requirements relating to geographical coverage, detailed sample characteristics, including subsampling, in accordance with Annex III to that Regulation, sampling characteristics, common data gathering periods, common standards for editing and imputation, weighting, estimation and variance estimation.
Furthermore, Annex II to Regulation (EU) 2019/1700 – Precision requirements, lays down the following:
Precision requirements for all data sets are expressed in standard errors and are defined as continuous functions of the actual estimates and of the size of the statistical population in a country or in a NUTS 2 region.
The estimated standard error of a particular estimate must not be greater than the following amount:
The function shall have the form of
The following values for parameters shall be used:
N
a
b
Ratio at‐risk‐of‐poverty or social exclusion to population
Number of private households in the country in millions, rounded to 3 decimal digits
900
2600
Ratio of at‐persistent‐risk‐of‐poverty over four years to population
Number of private households in the country in millions, rounded to 3 decimal digits
350
1000
Ratio at‐risk‐of‐poverty or social exclusion to population in each NUTS 2 region (see *)
Number of private households in the NUTS 2 region in millions, rounded to 3 decimal digits
600
0
When countries obtain negative f(N) values with the parameters expressed above, they shall be exempt from the corresponding requirement.
(*) For the estimated ratio at‐risk‐of‐poverty or social exclusion to population in each NUTS 2 region, those requirements are not compulsory for NUTS 2 regions with less than 0.500 million inhabitants, provided that the corresponding NUTS 1 region complies with this requirement. NUTS 1 regions with fewer than 100 000 inhabitants are exempt from the requirement.
Before 2021
According to EU regulation 1982/2003 on sampling and tracing rules, the cross-sectional and longitudinal (initial sample) data for all components of EU-SILC (whether survey- or register-based) were to be based on a nationally representative probability sample of the population of the country residing in private households, irrespective of language, nationality or legal residence status. The sampling frame and methods of sample selection ensured that every individual and household in the target population was assigned a known and non-zero probability of being selected.
EU regulation 1177/2003 set the minimum effective sample sizes to be achieved. It laid down that the actual sample sizes had to be larger to the extent that the design effect exceeded 1.0 and had to compensate for all kinds of non-response. Furthermore, the sample size referred to the number of valid households, i.e. households for which (and for all members of which) all or nearly all the required information had been obtained. The effective sample size was determined according to the size of the country, and it ensured minimum precision criteria for the key indicator at national level (absolute precision of the at-risk-of-poverty rate of 1%).
The data include several units of measure, depending on the variable. For more information, see the methodological guidelines and description of EU-SILC target variables available in CIRCABC. Most indicators are reported as shares. Some are reported in other units (e.g. per cent, thousands of persons, monetary units, etc.). More information is available in Eurobase, living conditions section, to the database.
Estimates at aggregate level (e.g. EU-27) are calculated as the population-weighted arithmetic average of individual national figures. Aggregates covered include: EU-27 (from 2020), EU-28 (2013-2020), EU-27 (2007-2013), EU-25 (2004-2006), EU-15 (1995-2004), NMS10 (New Member States - 10 countries (2004-2006)) Euro area (EA11-1999, EA12-2001, EA13-2007, EA15-2008, EA16-2009, EA17-2011, EA18-2014, EA19-2015, EA20-2023), Euro area –20 countries (from 2023), Euro area –19 countries (2015-2022) and Euro area – 18 countries (2014). Estimates of the EU aggregated indicators are calculated if EU coverage in terms of the EU population is 70% or larger. Indicators are computed as the population-weighted average of national indicators. For 2024, EU-SILC data are available for EU-27, Norway, Switzerland, Serbia and Türkiye (Eurostat, EU-SILC 2024 data extraction November 2025).
Weights are provided by national statistical institutes as part of the data sets. All necessary imputations are done at national level and the respective flag for the variable imputed is provided.
EU-SILC combines survey and administrative data. Most countries use survey and administrative data combined; others use only survey data (e.g. Czechia, Germany, Greece, Luxembourg, Hungary, Poland, Romania and Slovakia) (for more information, please see Annex 6 – EU-SILC data sources used).
The EU regulation 2019/1700 requires nationally representative probability samples to be selected. The data are to be based on a nationally representative probability sample of the population residing in private households within the country, irrespective of language, nationality or legal residence status.
All private households and all persons aged 16 and over within the household are eligible. Persons living in collective households or institutions are generally excluded from the target population.
Figure 4: Data sources, 2024
Source: EU-SILC microdata 2024 (extraction March 2025).
Note: Figure 4 includes only the data source of individual questionnaires (P-file) (Please see ‘Annex 6 - EU-SILC data sources used’ for more information).
Annual
IESS (EU regulation 2019/1700) establishes the timeliness of data transmissions from the national statistical institutes. In the first years of implementing the IESS Regulation, some countries were granted a new deadline for data submission, as specified in the Annex to EU regulation 2020/2050.
Pursuant to Annex V to the IESS Regulation, for the income and living conditions domain, Member States must submit pre-checked microdata without direct identifiers according to the following deadlines:
(a) variables for the data collection of year N should be transmitted by the end of year N (cross-sectional and longitudinal variables, cross-sectional weights), but in exceptional cases, provisional microdata concerning income may be transmitted by the end of year N and revised data by 28 February of year N+1;
(b) variables related to the observation covering the years of the rotation scheme ending in year N (longitudinal weights) should be transmitted by 31 October of year N+1.
According to the Regulation, the aggregated data will be published on the Eurostat website as soon as possible, within six months of the transmission deadline for annual and infra‐annual data collection, and within 12 months of the transmission deadline for other data collection, except in duly justified cases.
To ensure comparability of data and/or indicators, i.e. to ensure quality of data as defined by Eurostat, EU-SILC has adopted an ex ante output harmonisation strategy. When using output harmonisation, the survey design and methods are flexible, as long as the output requirements are met. Countries have to define suitable national concepts and measurement procedures for implementing the international concept. There are two different strategies, depending on when the survey design is planned:
Ex ante harmonisation: the surveys are created by countries with the output to be produced in mind;
Ex post harmonisation: countries can adapt surveys already in place to produce comparable outcomes.
The EU-SILC common framework aims to ensure standardisation at different levels. Conceptual standardisation is achieved by defining and documenting the common concepts/definitions underlying each measure/variable, the scope and the time reference.
Implementation and process standardisation is achieved by editing data to ensure that recommendations are followed. These recommendations concern the collection unit, the sample size to be achieved for each country, the recommended design for implementing EU-SILC (rotational panel), common requirements for sampling, tracing rules for the longitudinal components, and common requirement for imputation and weighting procedures. International classifications aimed at maximising comparability of the information produced are also enforced.
Specific fieldwork aspects are also controlled by the framework in order to limit the use of proxy interviews; limit the use of controlled substitutions; limit the interval between the end of the income reference period and the time of the interview; limit the extent of total fieldwork for one-shot surveys; define precise follow-up rules for individuals and households in the event of refusals; and limit noncontact. Eurostat and Member States work together to develop common guidelines and procedures aimed at maximising comparability.
The EU-SILC survey design remains flexible. EU-SILC flexibility is a key aspect allowing it to be adapted to national specificities in terms of infrastructure and measurement. The most important aspect of the flexibility relates to the data sources to be used (administrative or interview). Eurostat encouraged the use of existing ones, whether they are surveys or registers. A second aspect of the flexibility relates to the survey and sampling design. The only constraint is that, for both the cross-sectional and longitudinal components, all household and personal data have to be linkable at micro level. Countries can use survey vehicles already in place or set up a new survey, possibly drawing on one recommended by Eurostat. Sampling design can draw on social survey expertise at national level. The third aspect of flexibility relates to measuring self-employment income, for which the diversity of sources and practices did not allow common harmonised solutions to be found.
Since 2005, comparability over time has been ensured by a common data source, EU-SILC. Due to the transition between the end of the European Community Household Panel (ECHP) and the start of the EU-SILC, there were disruptions in series between 2001 and 2005.
Starting from 2020, and in particular from 2021, many countries were impacted partly or fully by breaks in time series (Belgium, Germany, Denmark, Ireland, France, Croatia, Lithuania, Luxembourg, Hungary, Malta, Poland, Portugal, Slovenia, Finland, Sweden, Switzerland and Norway) (Please see Concept 19).
In 2021, new legislation on implementing EU-SILC came into force, revising and improving the survey (see Section 3.4). The new legislation provided for multiple changes to EU-SILC data collection, in particular:
it enforced the need for the following improvements: improved timeliness, with shorter deadlines for EU-SILC data submission;
it reformulated precision requirements at national and regional level (NUTS2) for the at-risk-of-poverty-or social-exclusion indicator and the persistent-risk-of-poverty rate;
additional/changed EU-SILC variables;
data collection with three frequencies: nucleus, three-year module and six-year module, and the recommendation to extend the longitudinal panel.
Specific variables, indicators or the national SILC were influenced by several factors, including the: implementation of the IESS Regulation, COVID-19, changes to the sample, the interview method, the number of rotations used, etc. For some countries, the impact was not related to COVID-19 or implementing IESS, meaning the break in series occurred before 2020.
For detailed information about significant changes and breaks in time series, as well as other changes considered relevant, please see the overview of breaks in series on the Eurostat website.


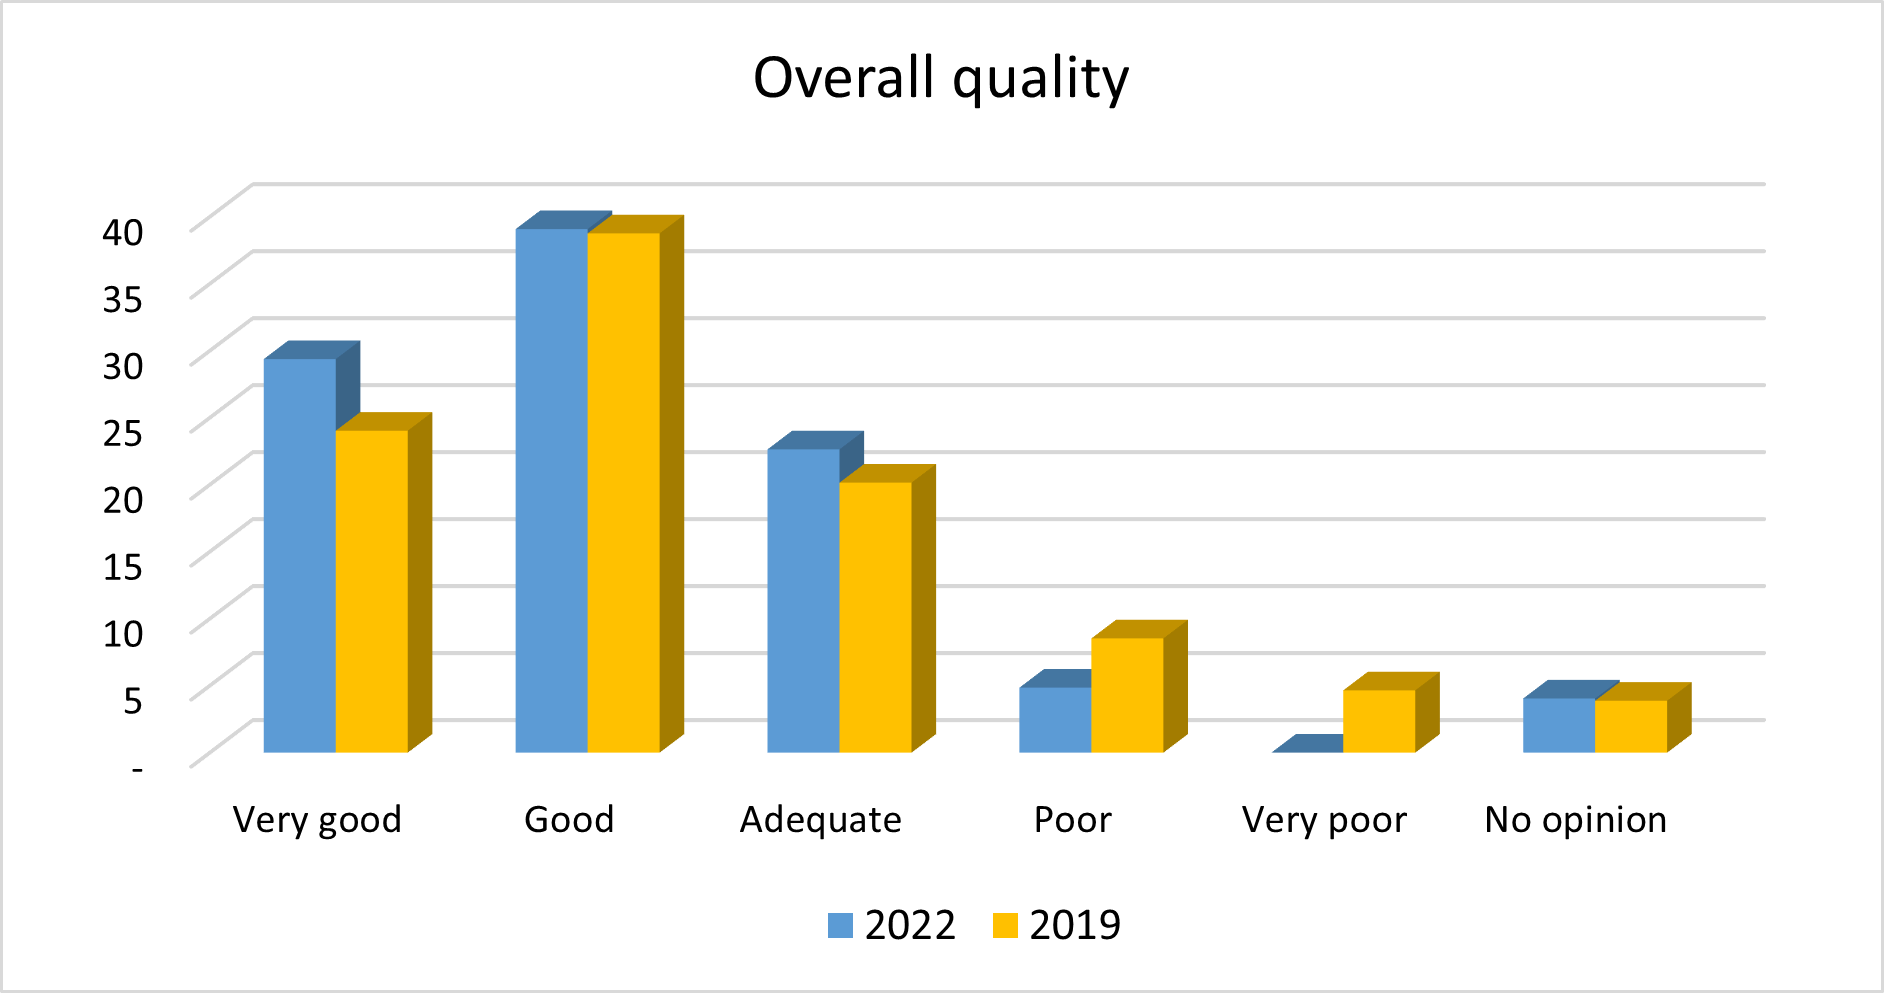


 must not be greater than the following amount:
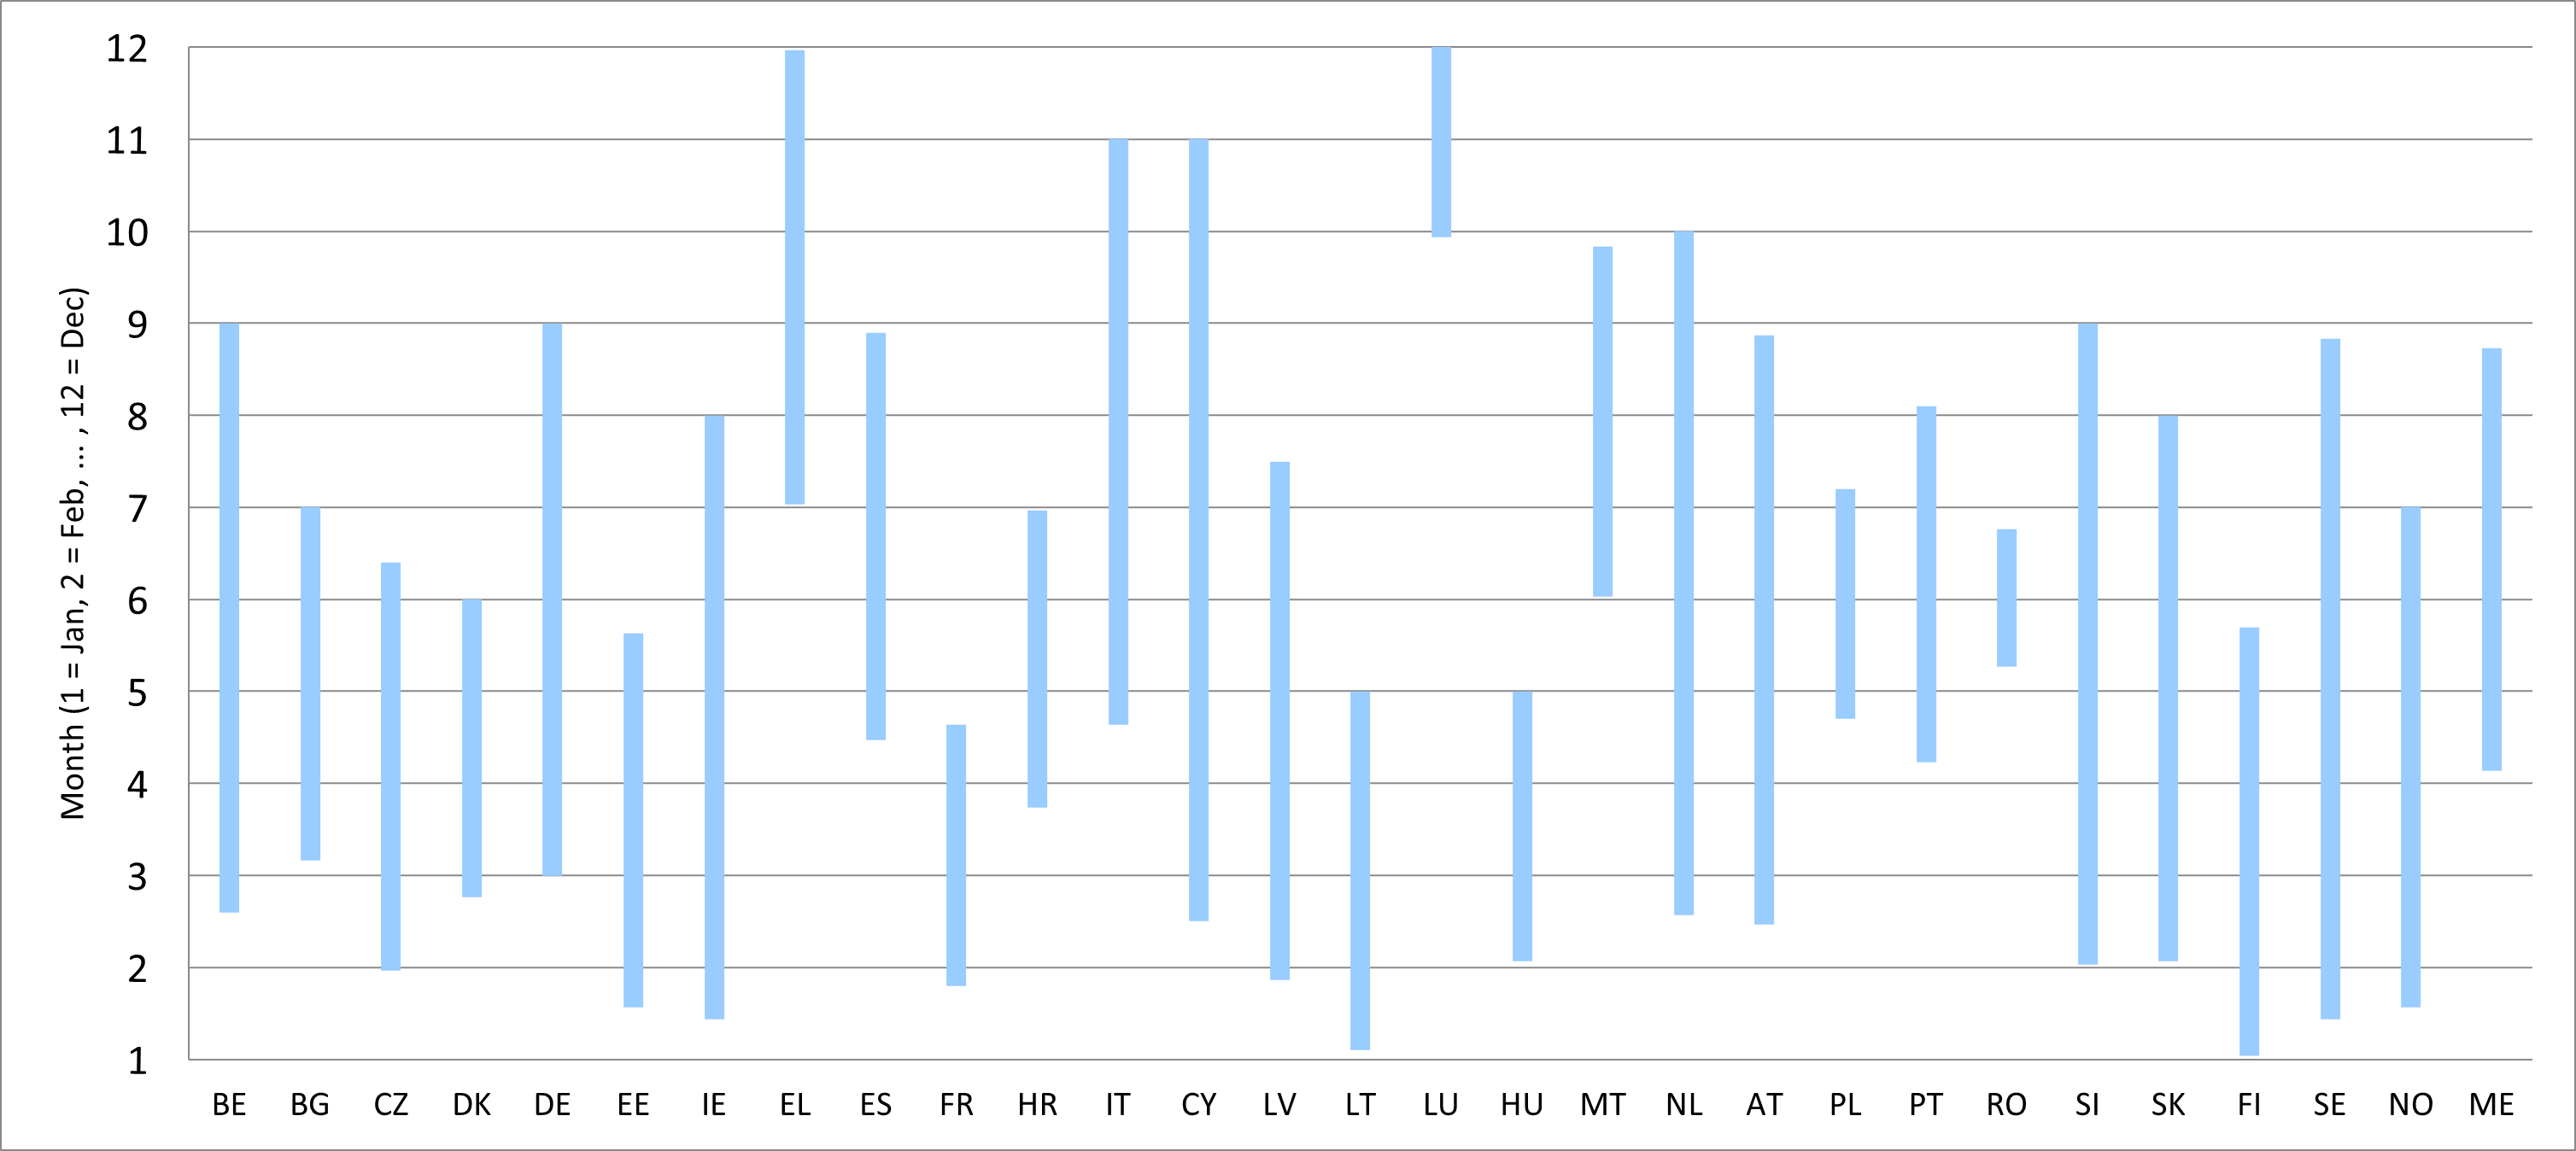 shall have the form of

