Living conditions in European Neighbourhood East countries
Data extracted in April 2024.
Planned article update: March 2025.
Highlights
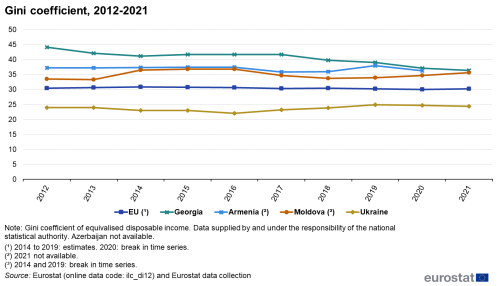
Ukraine had the smallest inequalities in household income among the European Neighbourhood Policy-East countries in 2021, with a Gini coefficient of 24.4, while Georgia had the largest at 36.4. In comparison, the EU had a Gini coefficient of 30.2.
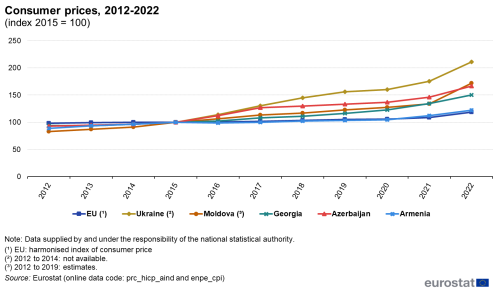
The consumer prices in Ukraine increased by 111% between 2015 and 2022, with a particular sharp increase following the beginning of Russia's war of aggression against Ukraine in 2022. In comparison, consumer prices increased by 19% in the EU over the same period.
In 2022, long-term unemployment was 6.7% in Armenia and 6.6% in Georgia, compared with 2.4% in the EU.
This article is part of an online publication; it presents information for five European Neighbourhood Policy-East (ENP-East) countries, namely, Armenia, Azerbaijan, Georgia, Moldova and Ukraine, compared with the European Union (EU). Georgia, Moldova and Ukraine are also candidate countries, with the European Council having granted Moldova and Ukraine the status of a candidate country on 23 June 2022 and Georgia on 14 December 2023. This article does not contain any data on Belarus, as statistical cooperation with Belarus has been suspended as of March 2022.
Data shown for Georgia exclude the regions of Abkhazia and South Ossetia over which the government of Georgia does not exercise control. The data managed by the National Bureau of Statistics of the Republic of Moldova does not include data from Transnistria over which the government of the Republic of Moldova does not exercise control. Since 2014, data for Ukraine generally exclude the illegally annexed Autonomous Republic of Crimea and the City of Sevastopol and the territories which are not under control of the Ukrainian government. Data on Ukraine for the year 2022 is limited due to exemption of reporting units under the martial law from mandatory data submission to the State Statistics Service of Ukraine, effective as of 3 March 2022, following Russia's war of aggression against Ukraine.
The article includes information on median income as well as the income distribution, measured through the income quintile share ratio (S80/S20) and the Gini coefficient, the risk of poverty (before and after social transfers), long-term unemployment, consumer and electricity prices, as well as access to potable water and waste collection services. These indicators are among the statistics used to observe living conditions and to formulate and monitor social policies and well-being.
Full article
GINI coefficient of equivalised disposable income
The Gini coefficient measures inequality in how income is distributed within a country. It measures how different the actual income distribution is from a distribution where every household has the same income. Higher values of the coefficient indicate greater income inequality: if the Gini coefficient is 0, everyone has the same income; a coefficient of 100 means that one household has all the income. The Gini coefficient is one of the most common indicators for measuring economic inequality. In Figure 1, the Gini coefficients for equivalised disposable income in the ENP-East countries are presented and compared with the coefficient for the EU.
The disposable income of a household is its total net income, including income from work and investments, as well as social benefits, after any taxes are deducted and social contributions paid. To compare the disposable income of households of different sizes and compositions, the size of the households are 'equivalised' by giving a weight to each member of the household, with the first adult counting as 1.0, all other persons in the household aged 14 and over counting as 0.5, and children aged under 14 counting as 0.3.
Among ENP-East countries, the difference in equivalised disposable income, measured by the Gini coefficient, was highest in Georgia throughout the period 2012-2021. However, there was a noticeable reduction in income inequality in Georgia over this period, with the Gini coefficient falling from 44.1 in 2012 to 36.4 in 2021.
Armenia experienced fluctuations in income inequality over the period 2012-2020 (2021 data not available), with the Gini coefficient ranging from 35.9 (2017) to 38.0 (2019). In 2020, the most recent year available, the Gini coefficient stood at 36.3.
In Moldova, the Gini coefficient also fluctuated between 2012 and 2021, ranging from 33.3 (2013) to 36.8 (2015 and 2016), ending at 35.6 in 2021.
Ukraine maintained the lowest income inequalities within the ENP-East region throughout the period, with the Gini coefficient consistently below 25.0. The coefficient varied between 22.0 in 2016 and 24.9 in 2019, with 24.4 in 2021.
Data on the Gini coefficient are not available for Azerbaijan.
The Gini coefficient remained relatively stable in the EU between 2012 and 2021, fluctuating between 30.0 (2020) and 30.9 (2014). In 2021, the Gini coefficient was 30.2 in the EU.
Consumer prices for all items
A consumer price index (CPI), is an indicator that measures changes in the price level of a basket of goods and services purchased by households. The index is used to assess inflation in an economy. In the EU, the Harmonised index of consumer prices (HICP), is used to provide a consistent CPI for the EU as a chole and a CPI that is directly comparable between countries.
(index 2015 = 100)
Source: Eurostat (prc_hicp_aind) and (enpe_cpi).
During the period 2012-2021, all of the ENP-East countries experienced years with high inflation. Most of them noted an accelerated inflation in 2021, during the first phase of economic recovery from the COVID-19 pandemic. In 2022, inflation increased further, in all of the ENP-East countries except Armenia reaching two digits, following the beginning of Russia's war of aggression against Ukraine.
Ukraine experienced the strongest increase in inflation of all the ENP-East countries in each year from 2016 to 2019 and second strongest in each year from 2020 to 2022. (Data for Ukraine are not available for 2012-2014). Compared with the year before, consumer prices increased by 13.9 % in 2016 and 14.5 % in 2017. In 2018 and 2019, prices grew more slowly, with year-on-year increases of 10.9 % in 2018 and 7.9 % in 2019 respectively. In the midst of the COVID-19 pandemic in 2020, consumer prices fell sharply to 2.8 %, in line with the overall slow increase in consumer prices across the region during the pandemic. From 2021, inflation accelerated again as the consumer prices increased strongly by 9.4 % in 2021, and accelerated further in 2022 with an increase of 20.2 % from the previous year.
In the period 2013-2020, Moldova recorded year-on-year increases in consumer prices in the range of 3.1 % (2018) to 9.6 % (2015), averaging 5.5 % over these years. The increase of 5.0 % in 2021 was more in line with this long-term trend than the development seen in the other ENP-East countries this year. However, in 2022 Moldova experienced the sharpest rise in consumer prices among the ENP-East countries, with prices up 28.8 % compared with the previous year.
Over the period 2013-2020, Azerbaijan's consumer prices growth ranged between 1.4 % (2014) and 4.1 % (2015). The exceptions were 2016 and 2017 when prices grew by 12.4 % and 13.0 %, respectively. In 2021, consumer prices increased by 6.6 %, compared with 2.7 % the previous year. In 2022, the inflation rate accelerated to 13.9 %.
In Georgia, consumer prices fell slightly from 2012 to 2013, with prices down -0.5 %. In the subsequent period 2014-2020, consumer price inflation lay between 2.1 % (2016) and 6.1 % (2017). Consumer prices were on average 9.5 % higher in 2021 than the year before and were the highest among the ENP-East countries that year. This inflation level increased further in 2022, with price increases of 11.9 %.
Consumer prices in Armenia grew by 5.8 % in 2013. This price growth slowed down during the following years, to 3.0 % in 2014 and 3.7 % in 2015. However, in 2016, consumer prices fell, resulting in a deflation of -1.4 %. From 2017 to 2020, the consumer price increases stabilised at between 1.0 % (2017) and 2.5 % (2018), before accelerating to 7.2 % in 2021. Inflation rose to a new peak at 8.6 % in 2022.
In the EU, consumer prices grew steadily and slowly in the period 2013-2020, with year-on-year increases of 0.1 % (2015) to 1.8 % (2018). In 2021, the increases became slightly stronger, rising to 2.9 %, before accelerating to a 9.2 % inflation rate in 2022.
Persons served by municipal waste collection
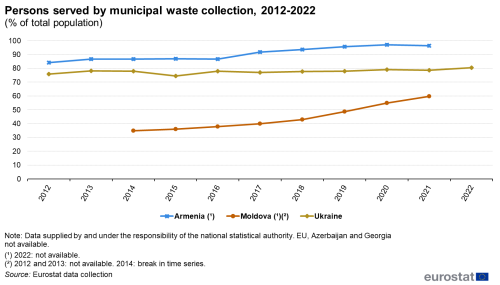
Municipal waste consists of waste generated by households, as well as similar waste from shops, offices and public institutions, etc. It is collected by local municipalities or on their behalf and treated in waste management systems. The share of persons served by such services provides a measure of the extent to which households can live in neighbourhoods that are kept clean and waste is taken away and treated.
In Armenia, the share of the population served by municipal waste collection increased overall across the period 2012-2021 (2022 data not available). The share rose from 84.2 % in 2012 to a level of around 87 % 2013-2016, before growing steadily from 91.7 % in 2017 to 97.0 % in 2020, reaching almost full coverage of the population with waste collection services. However, a slight fall to 96.3 % was noted in 2021.
Ukraine saw fluctuations in the percentage of the population served by municipal waste collection services 2012-2022. In 2012, 75.8 % of the Ukrainian population was covered by municipal waste collection, before rising to between 77.0 % (2017) and 79.0 % (2020) in the years 2013-2021, except in 2015 (74.5 %). After this relative stable period, the coverage rose to 80.4 % of the population in 2022.
Throughout the period for which data are available, 2014-2021, Moldova experienced a significant improvement in the share of the population served by waste collection services. Each year in this period, the share increased compared with the previous year, with particularly strong increases from 2018 onwards. The percentage of the population served by waste collection services rose from 34.8 % in 2014 to 59.7 % in 2021.
Overall, the data indicates improvements in the coverage of municipal waste collection services in Armenia, Ukraine and Moldova, which may reflect increased availability of waste collection services as well as people preferring to live in areas that are well served by them.
Data for the EU, Georgia and Azerbaijan are not available.
Persons connected to public water supply
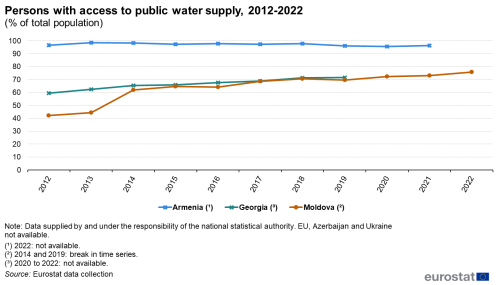
Safe and affordable access to drinking water is a necessity for a good living quality. The share of the population that have access to public water supply is an important indicator of living quality.
Almost all of the population in Armenia had access to public water supply in the period 2012 to 2021 (2022 data not available). Throughout this period, between 95.5 % (2020) and 98.7 % (2013) of the population had such access. Despite some year-on-year fluctuations, there was little change from the start to the end of the period, with 96.6 % having access to public water supply in 2012 and 96.3 % in 2021.
Georgia experienced steady progress in access to public water supply, with the percentage of the population served rising from 59.5 % in 2012 to 71.5 % in 2019, each year seeing a somewhat higher share of the population covered than the previous year. Data for 2020 to 2022 are not available.
In Moldova, the source for data on access to public water supply changed in 2014, the national Household Budget Survey with the 'population with usual residence' as denominator becoming the reference. This resulted in a significant shift in the value of the indicator, from 44.4 % in 2013 to 62.0 % in 2014 (+17.6 percentage points (pp)). Looking only at the period 2014-2022, there was nevertheless a significant improvement in the access to public water supply, with the share of the population served increasing from 62.0 % in 2014 to 75.8 % in 2022, despite some variation around this upward trend.
Data for the EU, Ukraine and Azerbaijan are not available.
Electricity prices for households
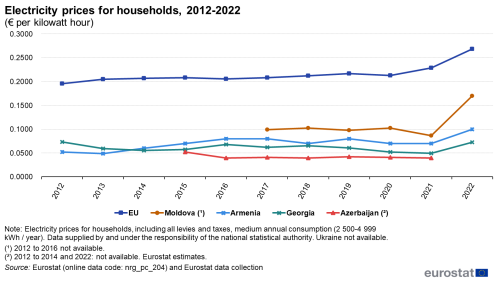
Electricity prices vary depending on how much energy households are consuming. For the EU and EU countries, Eurostat compiles and publishes electricity prices for households for five different levels of annual electricity consumption. The presented electricity prices for households are based on prices for housholds in the middle consumption category, with annual electricity consumption between 2 500 and 5 000 kilowatt-hour (KWh) per year. The electricity prices in € per KWh are consumer retail prices and include all levies and taxes, also VAT.
(€ per kilowatt hour)
Source: (nrg_pc_204) and Eurostat data collection.
The electricity prices for households in Moldova remained relatively stable in the period 2017-2020 (data 2012-2016 not available), ranging from €0.0976 per KWh in 2019 to €0.1028 per KWh in 2020. A slight dip to €0.0869 per KWh followed in 2021, before a sharp rise to €0.1699 per KWh in 2022, following the beginning of Russia's war of aggression against Ukraine.
Armenia's electricity prices for households remained relatively stable in 2012 and 2013, at €0.0520 and €0.0490 per KWh, respectively. Annual increases followed, from €0.0600 per KWh in 2014 to €0.0800 per KWh in 2016. In the subsequent period 2017-2021, the prices fluctuated between €0.0700 and €0.0800 per KWh (only prices rounded to two decimals were available). In line with the overall trend in European electricity markets, the price rose sharply to €0.1000 per KWh in 2022.
From a price of €0.0734 per KWh in 2012, the electricity price for households in Georgia remained below this level throughout the period 2013-2021, with prices fluctuating between €0.0678 per KWh (2016) and €0.0496 per KWh (2021). A continuous reduction in prices 2018-2021 was undone by a sharp increase to €0.0728 per KWh in 2022.
Azerbaijan's electricity prices were relatively low and stable in the period 2015-2021 (data 2012-2014 not available). After a fall from €0.0522 per KWh in 2015 to €0.0396 per KWh in 2016, electricity prices for households remained stable in the range from €0.0398 (2021) to €0.0420 per kWh (2019). Data for 2022 are not available for Azerbaijan.
Over the period 2012-2022, the electricity prices for households in the EU generally showed an upward trend, with slight decreases only in 2016 and 2020. From €0.1956 per KWh in 2012, the prices grew to €0.2168 per KWh in 2019, before falling slightly to €0.2132 per KWh in 2020. In the subsequent years, the electricity prices accelerated, rising to €0.2286 in 2021 before peaking at €0.2683 per KWh in 2022. The electricity prices presented for the EU are calculated as annual averages of the prices per semester.
Data for Ukraine are not available.
Gas prices for households
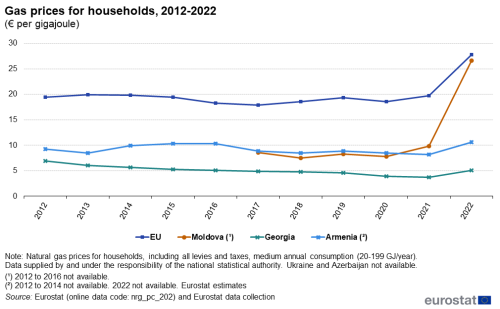
The prices of natural gas for households refer to prices for households with medium annual consumption of natural gas, i.e. between 20 and 200 GJ per year. The gas prices in € per GJ include levies, VAT and all other taxes.
(€ per gigajoule)
Source: (nrg_pc_202) and Eurostat data collection.
In Moldova, the natural gas price paid by households with a medium annual consumption (20-200 GJ per year) was €8.5932 per GJ in 2017, remaining relatively stable within the range €7.5297 per GJ (2018) to €8.3135 per GJ (2019) until 2020. In 2021, there was a considerable increase to €9.8468 per GJ. Until 2022, natural gas imports to Moldova came largely from Russia. However, following the beginning of Russia's war of aggression against Ukraine, Moldova needed to acquire natural gas from other sources, leading to a sharp spike in the household price of natural gas to €26.6687 per GJ in 2022 (+170.8 % compared to 2021). Data for Moldova are not available for the years 2012 to 2016.
Armenia's natural gas price for households remained relatively stable over the period 2012-2022. In 2012, the price stood at €9.2404 per GJ. Over the subsequent decade, it varied between €8.5296 per GJ (2013 and 2018) to €10.3066 per GJ (2015 and 2016). From 2021 to 2022, the price rose from €8.1742 per GJ to €10.6620 per GJ, an increase of 30.4 %.
Georgia experienced a gradual decrease in gas prices for households, with the price decreasing continuously from €6.9050 per GJ in 2012 to €3.7095 per GJ in 2021. However, in 2022 the price shot up by more than a third, by 36.9 % to €5.0789 per GJ.
From €19.4017 per GJ in 2012, the natural gas price for households with medium annual consumption in the EU moved within the band from €17.9310 per GJ (2017) to €19.9614 per GJ (2013) in the period 2012-2021. However, in 2022 it shot up to €27.7569 per GJ, and increase of 40.8 % compared to 2021.
Data for Ukraine and Azerbaijan are not available.
Long-term unemployment rate
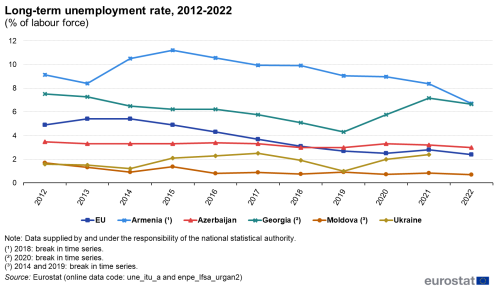
The long-term unemployment rate represents the percentage of the labour force that is unemployed and has been actively seeking employment for at least a year. Unemployment results in a loss of income, and if it persists long-term it increases the risk of falling into poverty.
(% of labour force)
Source: (une_itu_a) and (enpe_lfsa_urgan2).
Armenia experienced fluctuations in the long-term unemployment rate over the period 2012-2022, with an overall decrease from 9.1 % in 2012 to 6.7 % in 2022 (-2.4 (pp)). However, within this period, the rate varied between 8.4 % (2013 and 2021) and 11.2 % (2015), with a notable increase by 2.1 pp from 2013 to 2014, and a decrease by -1.6 pp from 2021 to 2022. There was a methodological break in the time series in 2018, with definitions brought into line with the ILO's standards adopted at the 19th International Conference of Labour Statisticians (ICLS).
In Georgia, the long-term unemployment rate fell consistently from 7.5 % in 2012 to 4.3 % in 2019. There was a break in the time series in 2020, in connection with the implementation of the concepts of the 19th ICLS, with the long-term unemployment rate shifting to 5.8 % (+1.5 pp), increasing further to 7.2 % in 2021, before falling to 6.6 % in 2022.
Azerbaijan maintained a relatively stable long-term unemployment rate over the period, varying only by 0.5 pp from 3.0 % (2018, 2019 and 2022) to 3.5 % (2012). Overall, the rate declined by -0.5 pp over the period, from 3.5 % in 2012 to 3.0 % in 2022.
Ukraine also witnessed moderate fluctuations in the long-term unemployment rate over the period 2012-2021, within the band from 1.0 % (2019) to 2.5 % (2017), but not changing more than 1.0 pp in any year. However, from a low at 1.0 % in 2019, the rate increased to 2.0 % in 2020 and further to 2.4 % in 2021. Data are not available for Ukraine for 2022.
Moldova experienced a relatively low and stable long-term unemployment rate throughout the period 2012-2022, ranging between 1.7 % (2012) and 0.7 % (2020 and 2022), overall falling by 1.0 pp. However, there were breaks in the time series in 2014, when the population definition was changed to the usual resident population, and in 2019, when a new sampling plan for the labour force survey (LFS) was introduced and the concepts of employment of the 19th ICLS implemented.
From an initial increase in the long-term unemployment rate from 4.9 % in 2012 to 5.4 % in 2013 and 2014, the EU witnessed a steady decrease in the rate to 2.4 % in 2022, except a slight increase from 2.5 % in 2020 to 2.8 % in 2021.Median annual net income
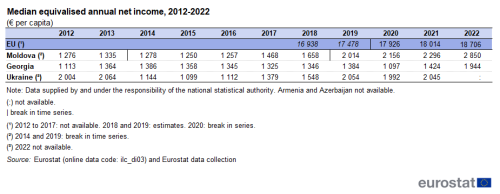
The median annual net income is defined as the 'median equivalised annual net income'. This represents the middle value of annual net income per person, after adjusting for household size and composition. The annual net income is defined as total net income, including income from work and investments as well as social benefits, after any taxes are deducted and social contributions paid.
(€ per capita)
Source: (ilc_di03) and Eurostat data collection.
The median net income in Moldova remained relatively stable at around €1 300 per capita from 2012 to 2016, ranging between €1 250 (2015) and €1 335 (2013). It rose from €1 468 per capita in 2017 to €1 658 per capita in 2018. Data from 2019 onwards are not directly comparable with those from previous years, due to a methodological change in the Household Budget Survey of Moldova. The median equivalised annual net income increased from €2 014 per capita in 2019 to €2 850 per capita in 2022, with a notable increase of 24.1 % from 2021 to 2022.
In Georgia, fluctuations in median equivalised annual net income over the period 2012-2022 were generally between €1 325 (2017) and €1 424 per capita (2021), except in 2012 (€1 113 per capita), 2020 (€1 097) and 2022 (€1 944). The drop in 2020 was more than recovered in the following year. However, the increase of 36.5 % from 2021 to 2022 is notable.
In 2012, the median equivalised income in Ukraine was €2 004 per capita. It increased by 3.0 % to €2 064 in 2013, but was almost halved (-44.6 %) to €1 144 in 2014 following Russia's illegal annexation of Crimea and the effects this had on the economy. However, after a period of consolidation in 2015 and 2016, the recovery in the Ukrainian economy enabled median income to rise rapidly from 2017 to 2019, with annual growth of 23.9 % (2017), 12.3 % (2018) and 32.7 % (2019). As a result, median income in 2019 reached €2 054, only marginally lower than before Russia's illegal annexation of Crimea. Median income stabilised at close to this level in 2020 and 2021, with a minor drop (-3.0 %) in 2020 during the COVID-19 pandemic almost completely recovered in 2021 (+2.7 %). However, data for 2022, following the beginning of Russia's war of aggression against Ukraine, are not available.
In the EU, data are available from 2018 to 2022. In this period, the median equivalised annual net income increased consistently, from an estimated €16 938 per capita in 2018 to a high at €18 706 in 2022.
Data for Armenia and Azerbaijan are not available.
Inequality of income distribution
The income quintile share ratio, also known as the S80/S20 ratio, is a measure of inequality of the income distribution. It is calculated as the ratio of the total income received by the 20 % of the population with the highest income (the top quintile) to that received by the 20 % of the population with the lowest income (the bottom quintile). The income is defined as the equivalised annual net income. A higher value of the ratio indicates greater income inequality.
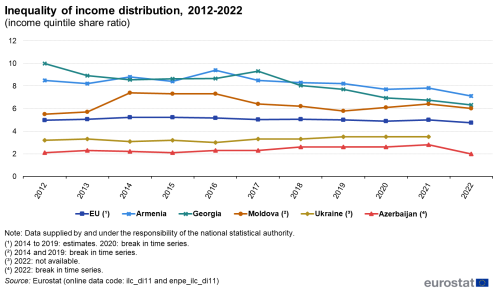
(income quintile share ratio)
Source: Eurostat (ilc_di11) and (enpe_ilc_di11).
The income quintile share ratio in Armenia stood at 7.8 in 2021, down from 8.5 in 2012, suggesting a slight trend towards less income inequality in the country. During this period, the ratio fluctuated between 9.4 (2016) and 7.7 (2020). In 2022, the rate fell by -0.7 to a new low at 7.1.
Georgia had the highest reported income quintile share ratio among the ENP-East countries in 2012, at 10.0. Following decreases to 8.9 and 8.5 in 2013 and 2014, respectively, the ratio increased continuously to 9.3 in 2017, before falling rapidly to 6.3 in 2022.
In Moldova, the ratio was 5.5 in 2012, rising slightly to 5.7 in 2013. Due to a methodological change, data from 2014 on are not directly comparable with those for previous years. In 2014, after this break in series, the ratio stood at 7.4. It decreased only slightly to 7.3 in the following two years, before falling to 6.4 in 2017 and remaining in the band 6.4 (2017 and 2021) to 5.8 (2019) in the subsequent years. At the end of the period in 2022, the income quintile share ratio stood at 6.0.
Ukraine and Azerbaijan maintained relatively low levels of income inequality over the period 2012-2022. In Ukraine, the income quintile share ratio was 3.2 in 2012 and 3.5 in 2021 (data for 2022 are not available), with the ratio changing very little from year to year. The lowest ratio within the period was 3.0 in 2016, the highest 3.5 throughout 2019-2021. In Azerbaijan, overall, the ratio changed only marginally from 2.1 in 2012 to 2.0 in 2022, the lowest point of this period. In between, a peak was reached at 2.8 in 2021.
In the EU, there were only minor variations in the income quintile ratio, with the ratio at 5.0 in both 2012 and 2021, with variations within the range 4.9 (2020) to 5.2 (2014-2016). A slight decline of -0.3 was noted in 2022, to 4.7.
People at risk of poverty
An important indicator in the analysis of living conditions is the at-risk-of-poverty rate. It measures the share of people that have equivalised disposable income, including social transfers, which is less than the national at-risk-of-poverty threshold. Social transfers include items such as pensions, unemployment benefits, family benefits, sickness benefits, housing allowances, as well as other social assistance and benefits. The at-risk-of-poverty threshold is set at 60 % of the national median equivalised disposable income; it is thus defined separately for each country. It is important to keep in mind that the at-risk-of-poverty rate does not measure poverty, but low income in comparison to other residents in that country; this does not necessarily imply a low standard of living.
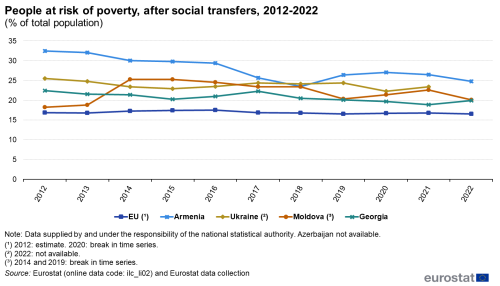
(% of total population)
Source: Eurostat (ilc_li02) and Eurostat data collection.
Armenia experienced a continuous decrease in the share of people at risk of poverty between 2012 and 2018, with the at-risk-of-poverty rate falling from 32.4 % in 2012 to 23.5 % in 2018, an improvement of 8.9 pp. However, the rate increased in the following two years, reaching 27.0 % in 2020, before falling to reach 24.8 % in 2022.
In Ukraine, the at-risk-of-poverty rate remained relatively stable with a slightly falling trend over the period 2012-2021 (data for 2022 are not available). Overall, the concerned share of the population decreased from 25.5 % in 2012, the highest of the period, to 23.4 % in 2021 (-2.1 pp). In the years between, the rate fluctuated between 24.8 % (2013) to 22.3 % (2020).
In Moldova, the share of the population at risk of poverty was 18.2 % in 2012, rising to 18.8 % in 2013. However, a change in methodology from 2014 makes data for subsequent years not directly comparable. From 2014 to 2018, the at-risk-of-poverty rate in Moldova decreased from 25.3 % to 23.4 %. A further change in methodology in 2019 again limits comparability with previous years, with the rate increasing slightly from 20.3 % in 2019 to 22.6 % in 2021, before falling to 20.1 % in 2022.
Despite some fluctuations, Georgia experienced a slight downward trend in the share of the population at risk of poverty, overall decreasing from 22.4 % in 2012, the highest of the period 2012-2022 to 19.9 % in 2022 (-2.5 pp). The rate moved between 22.3 % (2017) and 18.9 % (2021) in the years between, generally falling year-on-year but with increases in 2016, 2017 and 2022.
Data for Azerbaijan are not available. The EU witnessed relatively stable levels of people at risk of poverty, with the rate overall falling from 16.9 % in 2012 to 16.5 % in 2022 (-0.4 pp). Over the period 2012-2022, the rate moved only slightly within the range 16.5 % (2019, 2022) to 17.5 % (2016). This was lower than in any of the available ENP-East countries.
Source data for tables and graphs
Data sources
The data for ENP-East countries are supplied by and under the responsibility of the national statistical authorities of each country on a voluntary basis. The data result from an annual data collection cycle that has been established by Eurostat. These statistics are available free of charge on Eurostat’s website, together with a range of additional indicators for ENP-East countries covering most socio-economic topics.
For the EU, the EU statistics on income and living conditions (EU-SILC) is a key source for data on living conditions of the European population. It aims to collect timely and comparable data on income, poverty, social inclusion and living conditions, in both monetary and non-monetary terms. The data are generally collected for private households and household members. EU-SILC provides both cross-sectional data and longitudinal data, typically over a four-year period. The legal basis for this data collection exercise is Regulation (EU) 2019/1700 establishing a common framework for European statistics relating to persons and households, based on data at individual level collected from samples. It is supported by a series of implementing regulations and special data collection modules that relate to the collection of secondary variables on a less regular basis. Eurostat’s website provides an overview of legislation related to EU-SILC, as well as an online publication on EU statistics on income and living conditions (EU-SILC) methodology and an overview article over main results on Living conditions in Europe - poverty and social exclusion.
Context
The COVID-19 crisis and the subsequent cost-of-living crisis have had a direct and indirect impact on the general population but in particular on vulnerable groups such as the elderly, people with disabilities, young people, low-wage earners, part-time workers and people with precarious work contracts. Pressure on living conditions of households have increased through rising consumer prices and energy prices in particular, together with a generally uncertain economic environment.
The EU and the EU countries operate an open method of coordination for social protection and social inclusion. This aims to promote social cohesion and equality through adequate, accessible and financially sustainable social protection systems and social inclusion policies. As such, the EU provides a framework for national strategy development, as well as the opportunity to discuss and learn from best practices and to coordinate policies between EU countries in areas such as: building a fairer and more inclusive EU, social protection and social inclusion, and pensions.
At the start of March 2021, the European Commission outlined its ambition for an EU that focuses on education, skills and jobs for the future and targets a fair, inclusive and resilient socioeconomic recovery. The European Pillar of Social Rights Action Plan outlines a range of actions designed to promote social rights through the active involvement of social partners and civil society. It also proposes employment, skills and social protection headline targets for the EU. One of the headline targets relates specifically to living conditions, namely that the number of people at risk of poverty or social exclusion should decrease by at least 15 million persons (of which, at least five million should be children) between 2019 and 2030. The Action Plan highlights how the principles of the social pillar might be implemented, with the aim of building a stronger social Europe by 2030.
On 2 July 2021, the European Commission and the EU High Representative for Foreign Affairs and Security Policy presented the Eastern Partnership: a Renewed Agenda for cooperation with the EU's Eastern partners. This agenda is based on the five long-term objectives, with resilience at its core, as defined for the future of the Eastern Partnership (EaP) in the Joint Communication Eastern Partnership policy beyond 2020: Reinforcing Resilience – an Eastern Partnership that delivers for all in March 2020. It is further elaborated in the Joint Staff Working Document Recovery, resilience and reform: post 2020 Eastern Partnership priorities, amongst others, defining the 'Top Ten Targets for 2025'. The Eastern Partnership’s agenda for recovery, resilience and reform is underpinned by an 'Economic and Investment Plan for the Eastern Partnership (EaP): Investing in resilient and competitive economies and societies' (Annex I of the Joint Staff Working Document). More detailed overviews are given in a Factsheet on the Eastern Partnership Joint Communication, presenting the policy objectives and the specific priorities, as well as in a Factsheet on EU-Eastern Neighbourhood flagship projects 2023-2024.
The Joint Declaration of the Eastern Partnership Summit 'Recovery, Resilience and Reform' of 15 December 2021 reaffirmed the strong commitment to a strategic, ambitious and forward-looking Eastern Partnership.
At the Eastern Partnership Foreign Affairs Ministerial meeting of 11 December 2023, the EU, countries and partners declared that they will step up their efforts to implement the Eastern Partnership’s agenda for recovery, resilience and reform, as well as tackling challenges related to the ongoing consequences of the Russian war of aggression against Ukraine for the entire region.
In cooperation with its ENP partners, Eurostat has the responsibility to promote and implement the use of European and internationally recognised standards and methodology for the production of statistics, necessary for designing and monitoring policies in various areas. Eurostat manages and coordinates EU efforts to increase the capacity of the ENP countries to develop, produce and disseminate good quality data according to European and international standards. Additional information on the policy context of the ENP is provided on the website of Directorate-General European Neighbourhood Policy and Enlargement Negotiations (DG NEAR).
Direct access to
- All articles on non-EU countries
- European Neighbourhood Policy countries — statistical overview — online publication
- Statistical cooperation — online publication
- Living conditions – overview over all articles on living conditions
- EU statistics on income and living conditions (EU-SILC) methodology - online publication
Books
Factsheets
- Basic figures on the European Neighbourhood Policy-East countries — 2023 edition
- Basic figures on the European Neighbourhood Policy-East countries — 2022 edition
- Basic figures on the European Neighbourhood Policy-East countries — 2021 edition
Leaflets
- Basic figures on the European Neighbourhood Policy — East countries — 2020 edition
- Basic figures on the European Neighbourhood Policy — East countries — 2019 edition
- Basic figures on the European Neighbourhood Policy — East countries — 2018 edition
- Basic figures on the European Neighbourhood Policy — East countries — 2016 edition
- Basic figures on the European Neighbourhood Policy — East countries — 2015 edition
- Basic figures on the European Neighbourhood Policy — East countries — 2014 edition
- International trade for the European Neighbourhood Policy — East countries — 2016 edition
- European Neighbourhood Policy-East countries — Statistics on living conditions — 2015 edition
- European Neighbourhood Policy — East countries — Key economic statistics — 2014 edition
- European Neighbourhood Policy — East countries — Labour market statistics — 2014 edition
- European Neighbourhood Policy — East countries — Youth statistics — 2014 edition
- Eastern European Neighbourhood Policy countries (ENP-East) (ESMS metadata file — enpe_esms)
- Income and living conditions (ESMS metadata file — ilc)
- European External Action Service — European Neighbourhood Policy
- Joint Communication JOIN(2020) 7 final: Eastern Partnership policy beyond 2020: Reinforcing Resilience - an Eastern Partnership that delivers for all (18 March 2020)
- Joint Staff Working Document SWD(2021) 186 final: Recovery, resilience and reform: post 2020 Eastern Partnership priorities (2 July 2021)
- Joint Declaration of the Eastern Partnership Summit: ‘Recovery, Resilience and Reform’ (15 December 2021)
- Directorate-General for Employment, Social Affairs and Inclusion
- The European Pillar of Social Rights Action Plan
