Weekly death statistics
Data extracted on 15 February 2024
Highlights
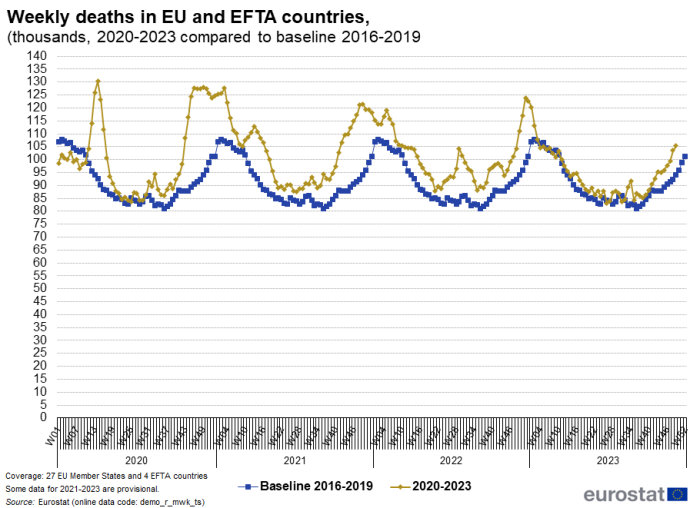
In December 2023 (weeks 49 to 52), the number of weekly deaths in EU and EFTA countries was above the 2016-2019 average and represented 39 166 additional deaths above the baseline. Most deaths were recorded in the first week of December.
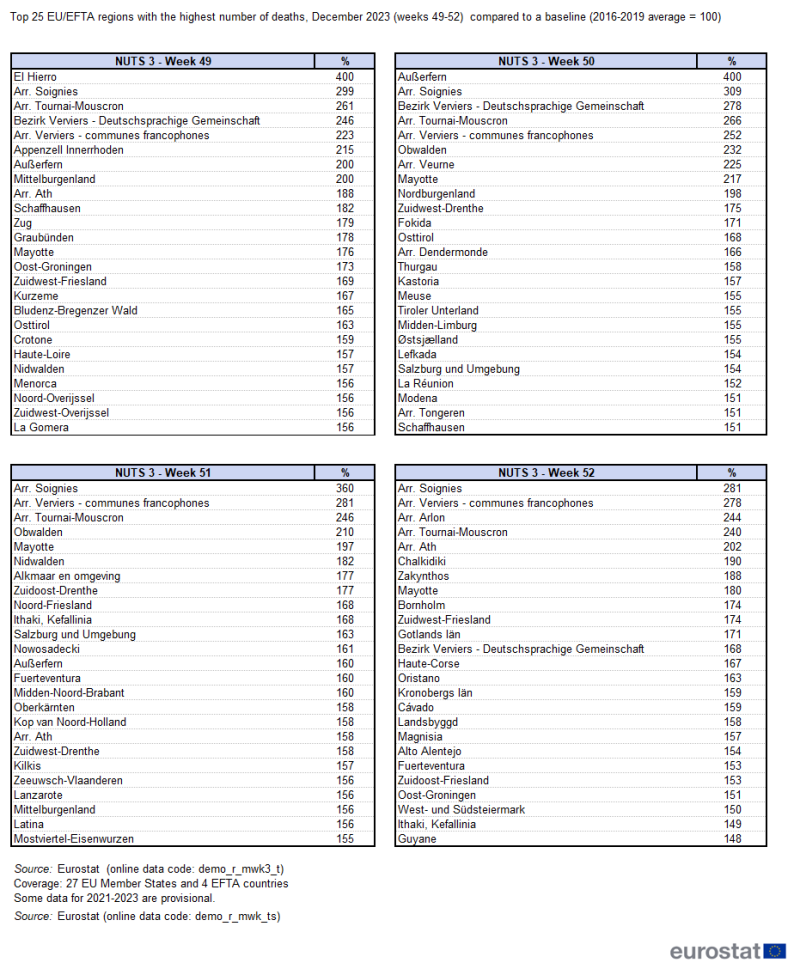
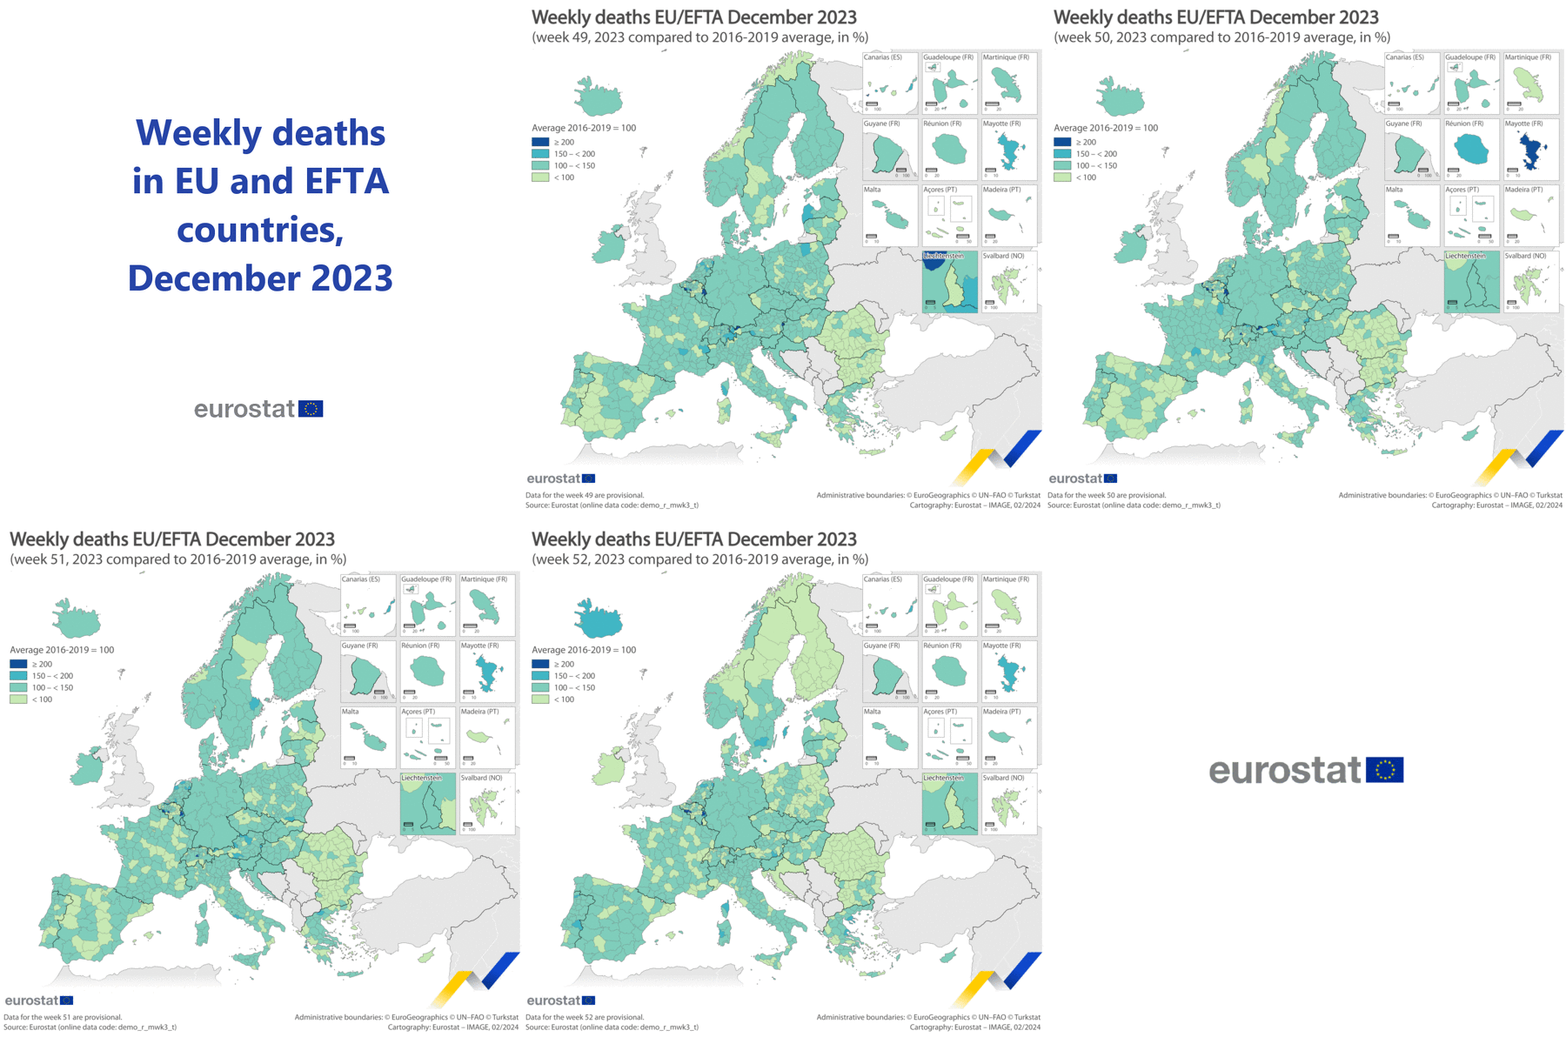
In December 2023 (weeks 49 to 52), the five regions most affected in terms of additional deaths were El Hierro, Spain (400%, week 49), Außerfern, Austria (400%, week 50), Arr. Soignies, Belgium (360 %, week 51), Arr. Verviers - communes francophones, Belgium (281 %, week 51) and Bezirk Verviers - Deutschsprachige Gemeinschaft (278 %, week 50).
This article provides information on the number of weekly deaths in all Member States of the European Union and EFTA. The article shows the number of deaths in the EU and EFTA from January 2020 to December 2023 and focuses on developments in December 2023.

Source: Eurostat (demo_r_mwk_ts)
Full article
Recent data on weekly deaths in EU and EFTA countries
In December 2023 (weeks 49-52), there were around 39 166 additional deaths in the EU and EFTA, compared with the 2016-2019 baseline. The death rate was 110 % and slightly increased by 1 % compared with November 2023.
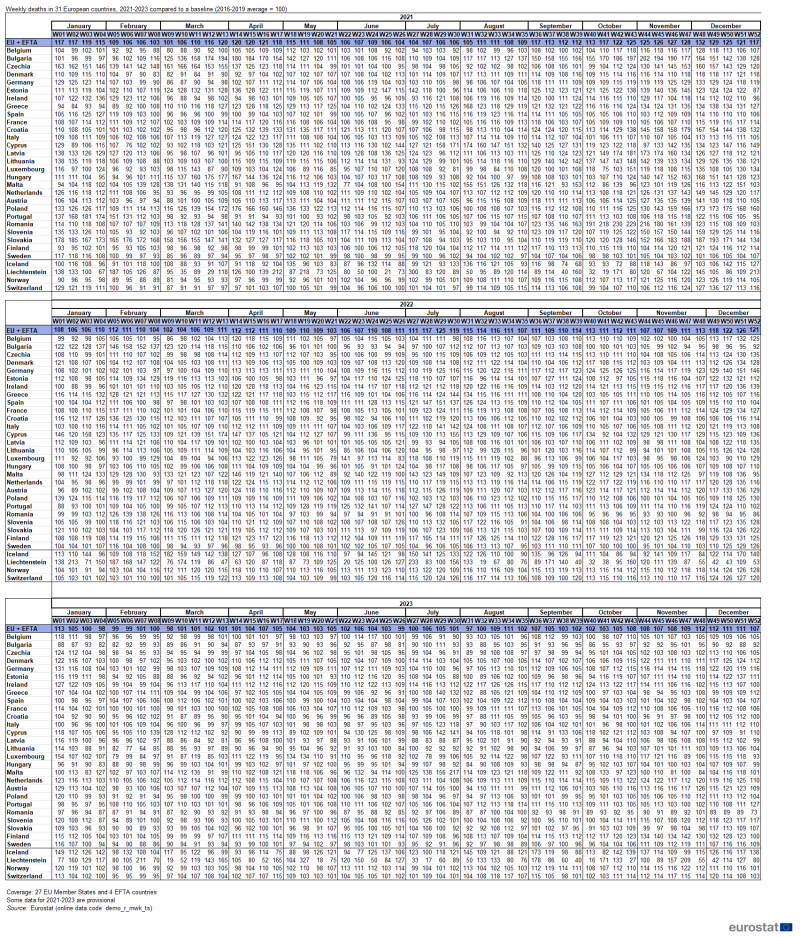
Among the EU and EFTA countries, the highest death rates were observed in Iceland (138 % during week 52 and 126 % during week 49, with a period average of 124 %), Estonia (137 % during week 51, with a period average of 121 %), and Finland (132 % during week 49, with a period average of 121 %).
According to the available data, most deaths were recorded in the first week of December 2023 (week 49), with 11 112 additional. The death rate for the EU and EFTA countries combined (EU/EFTA) for this week was 112 %.
As shown in Table 1, the hardest hit NUTS 3 regions in terms of additional deaths in December 2023 were El Hierro in Spain, with a death rate of 400 % during week 49 and Außerfern in Austria with a death rate of 400 % during week 50. These were followed by Arr. Soignies with a death rate of 360 % during week 51, Arr. Verviers - communes francophones with a death rate of 281 % during week 51 and Bezirk Verviers - Deutschsprachige Gemeinschaft in Belgium with a death rate of 278 % during week 50.
During week 49, the most heavily impacted regions were El Hierro in Spain (400 %), Arr. Soignies (299 %), Arr. Tournai-Mouscron (261 %), Bezirk Verviers - Deutschsprachige Gemeinschaft (246 %) and Arr. Verviers - communes francophones (223 %) in Belgium.
In week 50, the NUTS 3 regions most affected were Außerfern (400 %) in Austria, Arr. Soignies (309 %), Bezirk Verviers - Deutschsprachige Gemeinschaft (278 %), Arr. Tournai-Mouscron (266 %) and Arr. Verviers - communes francophones (252 %) in Belgium.
During week 51, the NUTS 3 regions with the highest death rates were Arr. Soignies (360 %), Arr. Verviers - communes francophones (281 %) and Arr. Tournai-Mouscron (246 %) in Belgium, followed by Obwalden (210 %) in Switzerland and Mayotte (197 %) in France.
In the last week of December (week 52), the NUTS 3 regions most affected were Arr. Soignies (281 %), Arr. Verviers - communes francophones (278 %), Arr. Arlon (244 %), Arr. Tournai-Mouscron (240 %) and Arr. Ath (202 %) in Belgium.

Source: Eurostat (demo_r_mwk_ts)
Weekly deaths in EU and EFTA countries during COVID-19 pandemic
In March 2020, the number of deaths compared with previous years was exceptionally high in some parts of Europe (Italy and Spain in particular) while other areas were less severely affected. In April 2020, this high increase affected an increasing number of areas. At the peak of the first wave of COVID-19 (from mid-March to end of May 2020, i.e. from weeks 11 to 22), there were around 179 000 additional deaths compared with the average for 2016-2019.
During the second larger wave of excess deaths (from October to the end of December 2020, weeks 41 to 53), there were around 347 000 additional deaths. In the first wave, certain countries and regions in western Europe were more severely hit than others, whereas the second wave (still active in January-February 2021) affected a larger territory and most of the deaths occurred in the eastern part of Europe. In 2020, in the 27 EU and four EFTA countries, there were around 548 000 more deaths than the annual average for the years 2016-2019, and the excess mortality rate reached its highest level in early April (141 % compared with the baseline).
In February 2021, the second wave started to weaken, with some notable exceptions in the eastern parts of the EU (Czechia, Slovakia, Bulgaria, Poland and Estonia). In March and at the beginning of April 2021, there was a slight increase in the European average number of deaths, with the aforementioned countries still above the average level, while others (Belgium, Germany, Portugal, Denmark, Ireland, Spain, Sweden and Finland) had no excess deaths.
At the end of April and in May 2021, the overall trend pointed generally to a decline, with the number of deaths falling towards the baseline recorded between 2016 and 2019. In June and July 2021, the overall number of deaths fell further, closer to but still a few percentage points (pp) above the baseline level recorded in 2016-2019. In the last quarter of 2021 (October-December 2021, weeks 40-52) there was a significant rise, with the maximum death rate for the EU and EFTA reaching 132 % of the baseline in early December, which was the highest level of the whole year. There were around 279 000 excess deaths during this third wave from late-2021. When looking at national rates recorded during this period, the range of values continued to vary considerably - as can be seen in Table 2 below - with the lowest ceilings for Italy (all values below 116 %), Spain (all values below 115 %), and Sweden (all values below 108 %), and the highest in Romania (230 %) and Bulgaria (202 %).

Source: Eurostat (demo_r_mwk_ts)
In December 2021, after reaching the highest value for the year, the number of deaths fell to 117 % in week 52. In the first quarter of 2022 (January-March, weeks 1-13), the overall rate continued to fall: the period average was around 108 %, with a minimum of 102 % in early March (week 9), and a maximum of 112 % in early February, week 5.
In the second quarter of 2022 (April-June, weeks 14-26), the death rate in the EU was slightly higher than in the previous quarter, at around 109 % of the average number for the same period in 2016-2019. The highest value was 112 % in early April (weeks 14-15), and the lowest was 103 % in late May (week 21).
The death rate in the EU in the third quarter (July-September, weeks 27-39) of 2022 increased to 114 % of the average number in the same period in 2016-2019. This rise was particularly marked in July, when the death rate in the EU rose to 118 % of the average number for the same period in 2016-2019 (it was 109 % in June). There were around 59 683 additional deaths in July 2022. This was an unusually high value for this month: the death rate was 103 % in July 2020 (11 503 additional deaths) and 106 % in July 2021 (19 855 additional deaths). Based on the available information, some of the mortality increase in July 2022 compared with the same month of the past 2 years may have been due to the heatwaves that affected parts of Europe during the reference period.
In the last quarter of 2022 (October-December, weeks 40-52) the death rate in the EU remained constant at 114 % compared with the previous quarter with the lowest value of 107 % at the beginning of November (weeks 44-45). However, in December 2022, the death rate in the EU increased compared with the previous month, to 122 % of the average number for the same period in 2016-2019 (it was 109 % in November). There were around 84 772 additional deaths in December 2022. In comparison, the death rate was 128 % in December 2020 (138 166additional deaths) and 124 % in December 2021 (117 323 additional deaths). In 2022 overall, the death rate was above the 2016-2019 baseline with fluctuations ranging from the lowest recorded value of 102 % in March to the highest of 125 % in July and 126 % in December.
In the first quarter of 2023 (January-March, weeks 1-13), the death rate declined significantly compared with the previous periods to 101 %, with the highest value of 113 % in the first week of January and the lowest (97 %) at the beginning of March (week 9). There were around 18 614 additional deaths in this period, compared with the 2016-2019 baseline. It is important to note that in January (week 4), February (weeks 5 and 6) and March (week 9) there were no additional deaths in EU and EFTA countries as a whole and the rate was below 100 % compared with the 2016-2019 baseline.
The highest mortality rates, in the first quarter of 2023, were recorded in Iceland (115 % period average and 149 % period maximum in week 1), the Netherlands (111 % period average and 123 % period maximum in week 1), Liechtenstein 111 % period average, and 211 % period maximum in week 7).
In April 2023 (weeks 14-17), the death rate in EU and EFTA countries rose to 104 % compared with the previous periods. There were around 15 008 additional deaths in EU and EFTA countries in April 2023. The highest rates were recorded in Finland (113 % period average and 115 % period maximum, week 16), Ireland (113 % period average and 116 % period maximum, week 17) and Luxembourg (112 % period average and 122 % period maximum, week 15).
In May 2023 (weeks 18-21), the month when the World Health Organization (WHO) declared the end of the COVID-19 health emergency, there were around 12 169 additional deaths and the death rate stood at 104 %. The highest rates were observed in Liechtenstein (131 % period average and 327 % period maximum, week 19), Luxembourg (117 % period average and 134 % period maximum, weeks 18-19), and Ireland (114 % period average and 120 % period maximum, week 19).
Hardest hit regions during the COVID-19 pandemic
Major differences were noted not only between countries, but also between regions within a country.
In spring 2020, the NUTS 3 regions hardest hit by excess mortality were mostly located in Italy and Spain. From weeks 10-18, Bergamo, Cremona, Segovia, Lodi, Brescia and Piacenza had more than three times the number of deaths than the average for the same period in the previous 4 years. As many as 18 of the 25 most affected regions in the EU were in Italy or Spain. During the autumn-winter surge, deaths rose across a much larger proportion of Europe's territory. This time, peaks of additional deaths were registered in central and eastern parts of Europe, namely in Czechia, Slovakia, Bulgaria and Poland. While extraordinary peaks in mortality were less focused on a specific number of regions, the 'second wave' saw a higher increase in the number of deaths overall.
In the last week of February 2020 (week 9), the NUTS 3 region of Lodi in Italy had nearly double the number of deaths than in the same week in the previous 4 years. In week 10 the Italian regions of Bergamo and Cremona joined Lodi (all in Lombardy) in recording an extremely high number of deaths. In week 11 2020) the group of heavily affected Italian northern regions increased to include Piacenza, Parma and Brescia. All these Italian regions (plus Lecco and Pesaro-Urbino) still had a high number of deaths in week 12, while in that same week the Spanish regions of Soria, Segovia and Madrid, and Haut-Rhin in France, saw the number of deaths more than triple compared with the same week in 2016-2019.
In weeks 13-14, 2020, the hardest hit areas also included the Spanish regions of Guadalajara, Ciudad Real, Albacete, followed by Salamanca, Cuenca and Barcelona. In week 14, the regions Seine-Saint-Denis, Hauts-de-Seine, Val-d'Oise and Val-de-Marne in France, the Noordoost region in the Netherlands and Brussels, Belgium were also among the most affected areas. In week 15 2020, overall deaths decreased in Italy and Spain's affected regions, but in central Spain, the Paris region, north Italian regions, and regions in Belgium and the Netherlands, deaths were more than three times higher than normal. In May 2020, the number of deaths gradually returned to pre-pandemic figures, with some local exceptions. In week 31 2020, when numbers started to increase again, the most affected regions were in Belgium, Spain and Romania. In week 33 2020, deaths in the Belgian regions Kortrijk, Ath and Ieper were more than double than in the same week in 2016-2019, followed by other regions in Belgium, Bulgaria, France, Spain, Italy, the Netherlands, Poland, Romania and Switzerland. In weeks 36-40 2020, parts of Greece, Finland, Spain and France were among the most affected regions.
In 2021, in particular between February and May, the most affected regions were in Czechia (Karlovarský, Plzenský, Královéhradecký and Pardubický), Slovakia (Trnavský, Trenciansky and Banskobystrický), Bulgaria (Kyustendil and Pazardzhik) and Poland (Bielski and Gorzowski), all with more than 45 % excess deaths. During the late-2021 wave (weeks 39-52), the average mortality rate in the EU and EFTA for this period was 123 %, reaching a maximum of 132 % of the average for the same period in 2016-2019. The highest mortality rates were recorded in Bulgaria (period average 168 % and period maximum 202 %), Romania (period average 163 % and period maximum 230 %), and Slovakia (period average 153 % and period maximum 193 %). Within those countries, the impact was rather uneven. The most affected region in Bulgaria was Blagoevgrad (period average 190 % and period maximum 254 %); in Romania these were Harghita (period average 189 % and period maximum 319% %) and Mehedinţi (period average 186 % and period maximum 319 %); in Slovakia this was Prešovský (period average 180 % and period maximum 227 %).
In July 2022 (weeks 27-30) the average mortality rate in the EU and EFTA for this period was 118 %, reaching a maximum of 125 % of the average for the same period in 2016-2019. The country that recorded the highest mortality rates was Spain (period average 139 % and period maximum 151 %); its most affected regions were Guadalajara (period average 171 % and period maximum 199 %), Fuerteventura (period average 181 % and period maximum 250 %), Menorca (period average 174 % and period maximum 220 %) and Eivissa y Formentera (period average 170 % and period maximum 277 %).
In December 2022 (weeks 49-52) the average mortality rate in the EU and EFTA for this period was 122 %, reaching a maximum of 126 % of the average for the same period in 2016-2019. The highest mortality rate was recorded in Germany (period average 142 % and period maximum 151 %); its most affected region was Mecklenburg-Vorpommern (period average 159 % and period maximum 169 %).
During the first quarter of 2023 (weeks 1-13), the regions with the highest mortality rates in this period were in Greek Evrytania (139 % period average and 293 % period maximum in week 6), in Spanish Fuerteventura (139 % period average and 247 % period maximum in week 3), and French Guyane (134 % period average and 207 % period maximum in week 8).
In April 2023 (weeks 14-17), the hardest hit regions were Austrian Lungau (149 % period average and 255 % period maximum in week 14) and Mittelburgenland (143 % period average and 200 % period maximum in week 16) and Spanish Fuerteventura (143 % period average and 183 % period maximum in week 14).
When the WHO declared the end of the COVID-19 health emergency in May 2023, among the NUTS 3 regions for which data were available, the highest rates were observed in Spanish El Hierro (166 % period average and 300 % period maximum in week 21), Greek Xanthi (154 % period average and 173 % period maximum in week 19) and Finnish Keski-Pohjanmaa (148 % period average and 186 % period maximum in week 19).
You can select the country you would like to analyse in the tool below.
- Tool 1: Number of deaths by week
Source data for tables and graphs
![]() Weekly deaths - tables and graphs
Weekly deaths - tables and graphs
Data sources
In April 2020, Eurostat launched a new data collection exercise on weekly deaths and invited all EU and EFTA countries, as well as candidate or neighbouring countries to provide data. Eurostat publishes data on the number of deaths in different European countries by week, age, sex and NUTS 3 regions, but not all breakdowns are available. Data, extracted from Eurostat's online database, are preliminary and continuously updated with those from more recent weeks. See metadata online
How the aggregate is constructed
Thirty-one countries provide weekly mortality data, for all weeks of the years with 2016-2019 as a basis for comparison: Belgium, Bulgaria, Czechia, Denmark, Germany, Estonia, Ireland, Greece, Spain, France, Croatia, Italy, Cyprus, Latvia, Lithuania, Luxembourg, Hungary, Malta, the Netherlands, Austria, Poland, Portugal, Romania, Slovenia, Slovakia, Finland, Sweden, Iceland, Liechtenstein, Norway and Switzerland. Data received from candidate and neighbouring countries are not included in this article. Due to missing or incomplete data for some countries, Eurostat has estimated the European aggregate (EU + EFTA) for December 2023 (weeks 49 to 52) based on the latest available information.
Data from Sweden include deaths for which a precise week has not been specified (unknown week). These data have been redistributed among the existing weeks up until the most recent weeks.
Data from Ireland were not included in the first phase of the weekly deaths data collection: official timely data were not available because deaths can be registered up to three months after the date of death. Due to the COVID-19 pandemic, the Central Statistics Office of Ireland began to explore experimental ways of obtaining up-to-date mortality data, finding a strong correlation between death notices published on RIP.ie and official mortality statistics. Recently, CSO Ireland started publishing a time series covering the period from October 2019 until the most recent weeks, using death notices (see CSO website). For the purpose of this release, Eurostat compared the new 2020-2021 web-scraped series with a 2016-2019 baseline established using official data. CSO is periodically assessing the quality of these data.
A data aggregation for all available countries (comparing total deaths in recent weeks with the 2016-2019 baseline of the respective week) has been made for this article in order to help with the analysis. The EU-27 aggregate is included in Eurostat's online database for weeks with complete data.
Context
In addition to its major impact on people's lives, on economies and on healthcare systems, the COVID-19 pandemic has triggered tremendous interest in related statistics. Therefore, in April 2020, in cooperation with the National Statistical Institutes of the European Statistical System, Eurostat set up a new special European data collection exercise on weekly deaths, in order to support COVID-19 policy and research efforts.
National Statistical Institutes regularly submit data on weekly deaths to Eurostat, on a voluntary basis, up to the latest available week. These data are cross-classified by sex, 5-year age group and NUTS 3 region. Data going back as far as 2000 are submitted in order to enable seasonal comparisons. If such detailed cross-classifications or back data are not available, participating countries may submit less detailed data or data for shorter time periods to Eurostat. Considering the urgent need for statistical information to monitor mortality, timeliness is the main goal of this data collection exercise.
Direct access to
See also
Dedicated section
Methodology
- Weekly deaths (demomwk_esms)
