Archive:Agri-environmental statistics
- Data from June 2010, most recent data: Further Eurostat information, Main tables and Database.
This article presents an overview of statistical data on agriculture and the environment in the European Union (EU). Farming can have beneficial influences on the environment, for instance in creating valuable landscapes and habitats. But inappropriate agricultural practices and land use can also have an adverse impact on natural resources, like the pollution of soil, water and air, fragmentation of habitats and loss of wildlife.
The links between the richness of the natural environment and farming practices are complex. Agri-environmental indicators are used to quantify and describe these complex relations between agricultural and agri-environmental policies, agricultural practices and the environment. AEI assess trends over time of
- the effects of agriculture on the environment;
- the effectiveness and efficiency of agricultural and environmental policy measures.
There are 28 indicators relating to farming practices, agricultural production systems, pressures and risk to the environment and the state of natural resources. In this article data will be presented on a selection of these indicators:
- cropping patterns;
- livestock patterns;
- specialisation;
- irrigation
Main statistical findings
Cropping patterns
Cropping patterns provide insight into environmentally important trends in farming in the European Union. Permanent grasslands are generally considered as the most important from a landscape and nature conservation perspective. This is however most of the time only true for extensively managed permanent grassland that provides habitats for many wild plants and animal species. The quality of these grasslands from a landscape and nature conservation point of view can be roughly assessed by looking at grazing livestock densities in these countries.
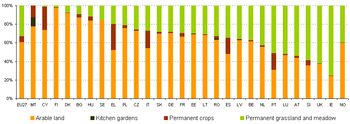
In 2007 the total utilised agricultural area (UAA) covered 172 millions of hectares in the EU, with 30% located in France (16%) and Spain (14%). The cropping pattern in the EU has been rather stable between 2003 and 2007 as shown in Table 1. In the EU in 2007, arable land represented 104 millions of hectares (60% of UAA), whereas permanent grassland represented 57 millions (33%) and permanent crops only 11 millions (6%). Kitchen gardens cover a significant area only in Malta.
Both the distribution of the main land use types and the trends vary widely among Member States. Graph 1 shows the repartition of the four components of the utilised agricultural area in each Member State in 2007. It clearly suggests that Mediterranean countries (e.g. Greece, Italy, Spain, Cyprus) have a much more important share of permanent crops than other countries. This can be explained by favourable climatic conditions of these countries and the commercial importance of permanent crops such as olive trees, vineyards or other fruit trees. Some countries have important areas of permanent grasslands (e.g. Ireland and the United Kingdom, known for their important sheep flocks), whereas others are characterised by a strong domination of arable land in their UAA (e.g. Finland or Denmark).
In 2007, the fodder area (i.e. grasslands and fodder crops) made up 43% of the UAA on average in EU; in Ireland it covered 92% of the UAA.
The change in cropping patterns between 2003 and 2007 within Member States however has been significant for some countries. Graph 2 shows the difference in percentage points between the share of grassland in UAA in 2007 and in 2003. Slovakia and Lithuania experienced a significant decrease in the share of grassland (-8 points of percentage in both countries), while the share of grassland increased by 11 points of percentage, rising from 40% to 51%, in Portugal.
Livestock patterns
Livestock patterns are an indicator of the pressure of livestock farming on the environment. Livestock, through manure production, contributes to climate change (greenhouse gas emissions) and nutrient leaching into water and air. A higher livestock density means that a higher amount of manure is available per hectare of UAA, which increases the risk of nutrient leaching. On the contrary, an excessively low livestock density increases the need for industrial fertilisers as well as the risk of land abandonment. The actual impact on the environment of livestock farming does not only depend on the amount of livestock, but also depends on farming practices.
Regarding grassland management, grazing, if not too heavy, can contribute to nature conservation in semi-natural habitats. Plants and animals benefit from the variety of structural features present in lightly or moderately grazed pastures, but heavy grazing eliminates structural diversity.
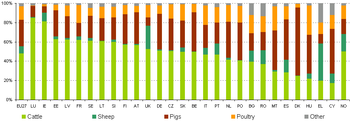
The total livestock population in the EU amounted to 136 millions of livestock units (LSU) in 2007, a slight decrease of -3.6% since 2003. In 2007 cattle alone represented 65 millions of LU (i.e 89 millions of heads of bovine animals) and made up 48% of the total livestock units in EU, followed by pigs (27%), poultry (14%) and sheep (8%). Most of the cattle population was found in France (21.6%), Germany (14.2%) and the United Kingdom (11.5%).
Graph 3 shows the share of different livestock categories in each country in 2007. Cattle were particularly dominant in Luxembourg (85%) and Ireland (81%). In Denmark, pigs represented 71% of the total livestock population (in LU).
In 2007, the total livestock density (total LD) in the EU was 0.8 LU per hectare of UAA. Grazing livestock density (grazing LD) in the EU was 1.1 LU per hectare of fodder area. Graph 4 shows the total LD and grazing LD in each country in 2007. The highest total LD were found in Malta, The Netherlands and Belgium, where moreover the grazing LD was much lower than the total LD. Such a difference usually reflects important pig and poultry production relative to cattle population and/or relatively important share of grasslands and other fodder crops within the UAA. On the contrary in Bulgaria, Greece and some other countries, the grazing LD was generally higher than the total LD.
On average in EU the total LD decreased by -0.03 LU/ha between 2003 and 2007, and the grazing LD by -0.04 LU/ha (see Graph 5). The major drop in livestock densities in Bulgaria is mainly caused by the continuously sharp decline in livestock populations since the change to a market economy. The changes in farm structure, the drop in purchasing power of the population and a loss of traditional export markets have all led to the marked reduction in ruminant livestock output (Agricultural Situation and Prospects in the Central and Eastern European Countries, 1998 reports, Bulgaria). The total livestock and grazing livestock populations declined by more than 20% between 2003 and 2007 in Bulgaria. At the same time the fodder area increased by almost 40% and the UAA by almost 5%. The major decrease in grazing livestock density in Cyprus is caused by a drop in grazing livestock populations (-12%) and an increase in the fodder area (44%).
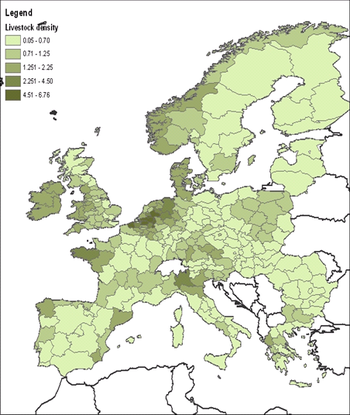
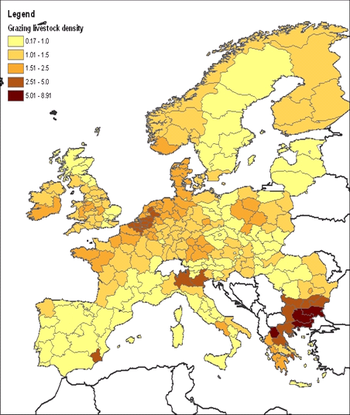
Map 1 shows the regional distribution of livestock densities and Map 2 of grazing livestock densities in the EU in 2007. The grazing livestock density is relatively high in Greece and Bulgaria. These countries have a relative low share of grassland in the total UAA, see Graph 1.
Specialisation of agriculture
Specialisation changes land use towards less diverse cropping and/or livestock patterns, due to more concentration on a limited number of products. A less diverse cropping/livestock pattern may cause a loss of diversity in farmland habitats, as well as in associated flora and fauna, crop varieties and livestock breeds, leading to overall reduction of genetic diversity.
Specialisation towards crops or livestock may also affect the nutrient balance of a holding. Fertilisers and manure contain large amounts of nutrients (e.g. phosphorus, nitrogen) and crops use these nutrients to grow. However, the amount of nutrients a crop can take up is limited, and the excess can leak into water, soil and air, causing a range of environmental problems. On the one hand, specialised livestock holdings with little or no crop area or pasture are likely to have a nutrient surplus, as it is not possible to spread all of the manure produced on the farm on crop area or pastures belonging to the agricultural holding without severe risks to the environment. This can be mitigated if the farmer is able to export excess manure to neighbouring farms with large crop areas. However, when a whole region is specialised in livestock breeding, manure disposal can be very problematic, as high transport costs may make the transport of manure to other regions prohibitively expensive. Specialist crop holdings, on the other hand, may face a nutrient deficit and have to import nutrients. Due to the low availability of manure, regions specialised in cropping tend to rely on mineral fertilisers which are produced with high amounts of energy and contribute to greenhouse gases.
However, some specialised systems have positive impacts on the environment. For instance, extensive cattle and sheep grazing in mountainous regions can be highly specialised, but have a positive impact on the conservation of high-value EU habitats and associated biodiversity.
The environmental effects of mixed farming are less obvious. Diversification can improve income security and thus the viability of a farm, by spreading risks over several activities. If one activity fails, say, because of animal or crop disease, other activities may still render income. A specialised holding, on the contrary, mainly depends on a single activity. If this fails, the viability of the entire holding may be at stake. Farmers ceasing activities in marginal areas may induce loss of agricultural habitats and soil erosion. Diversification could potentially prevent land abandonment in such areas.
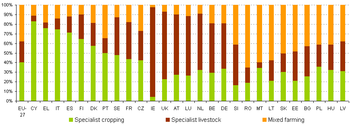
In 2007 there were approximately 13.7 millions of agricultural holdings in the EU, representing a decrease by -9% compared to 2003 (15 millions holdings in 2003). The distribution of crop-specialist, livestock-specialist and mixed-farming holdings remained rather stable between 2003 and 2007. In 2007, 40% of agricultural holdings were specialised in cropping (20% in field crops, 2% in horticulture, 18% in permanent crops), whereas 22% were specialised in livestock (17% in grazing livestock, 5% in granivores) and 38% were mixed-farming holdings (12% in mixed cropping, 12% in mixed livestock, 14% in mixed cropping-livestock).
Graph 6 shows there is much diversity in combinations of specialised and mixed farming. In the Mediterranean and Scandinavian countries, specialist cropping is the dominant farm type. Specialist livestock is the dominant farm type in parts of Western Europe (i.e. Ireland, UK, Benelux, Germany). In most new Member States, mixed farming is the dominant farm type.
Specialisation is often, but not always, associated with intensification. The Netherlands, for instance, have both a high share of specialist holdings and a high share of the utilised agricultural area (UAA) managed by high-input holdings. However, specialisation can also be found in more extensive agriculture, for instance, in Ireland, where the share of specialised holdings in 2007 is 97% (93% livestock-specialist and 4% crop-specialist), while almost half the UAA is managed by low-input holdings.
Map 3 shows the regional variation of farm specialisation in cropping in the EU in 2007. The specialisation in cropping was rather high in most regions of the Iberian Peninsula, Italy and Greece.
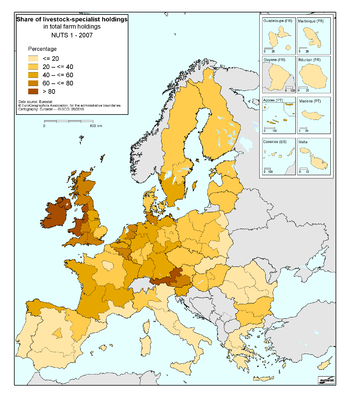
As can also be seen in Map 4 the share of specialist livestock holdings is rather low in these areas. A high specialisation in cropping may result in a higher need for mineral fertilisers, as manure is less available. However, farms differ in size. Therefore a large share of holdings specialised in cropping does not necessarily mean that also a large part of the UAA is managed by specialist crop holdings. A minority of large specialist livestock holdings may produce enough manure to meet the requirements of a majority specialised in cropping.
Irrigation
Irrigation fosters crop production by bringing water to plants, which is absolutely essential if plants are to grow in some areas. Irrigation increases productivity and therefore contributes significantly to agricultural output and food supply. However, irrigation is a major driving force behind water abstraction, which can eventually lead to environmental problems. In particular, availability problems occur when the demand for water exceeds the amount available during a certain period. The environmental impacts of irrigation are variable but some can be very severe, especially in the southern Member States. The use of water in agriculture for irrigation is also continuously under pressure from other users of fresh water (e.g. urban population, industry), as fresh water is a scarce resource throughout the world.
Across Europe, the main types of environmental impact arising from irrigation are:
- water pollution from nutrients and pesticides due to increased run-off;
- damage to habitats and aquifer exhaustion due to abstraction of water;
- salinisation of groundwater sources or contamination of water by minerals;
- ecological effects of large-scale water transfers associated with irrigation projects;
- soil erosion arising both from intensive irrigation and from the abandonment of formerly hand-irrigated terrace agriculture in the hills.
However, before intensive water use can be considered to have a negative impact on the environment, water use for irrigation, among other uses in other sectors, should be compared with water availability at local level. Moreover, the water sources used for irrigation also matter, e.g. surface water can be replenished much faster than groundwater.
Irrigable and irrigated areas alone give no indication of the intensity of water use, which also depends on the type of equipment used. Sprinkler and drop irrigation methods are less water-intensive than surface irrigation (also called ‘flood irrigation’), which still predominates in some countries. Equipment for drop irrigation is more expensive than for other irrigation methods and this system therefore tends to be concentrated in areas with high-value crops. Given that data on the actual volumes of water used for irrigation are quite difficult to collect, data on irrigation areas and methods can be used to estimate the volume. However, data on Irrigation methods used are for the moment only available for 2003.
In 2007 the total irrigable area in the EU (excluding Germany and Estonia) was about 15 million hectares, representing a decrease by -8.2% compared to 2003. The area actually irrigated was over 10.3 millions of hectares (-6.5% compared to 2003). The share of the irrigable area in total UAA in EU (excluding Germany and Estonia) in 2007 was 9.8%, while the share of the irrigated area was only 6.7%. The share of irrigable area in total UAA is the largest in the Mediterranean countries such as Greece (38.2%), Cyprus (31.4%), Malta (31.0%) and Italy (31.0%). In the Netherlands the irrigable area is also quite large (23.9%), however only 10.6% of the UAA was actually irrigated in 2007.
There are great variations from region to region and between countries. In southern European countries full irrigation is an essential element in many types of agricultural production. In central and northern European countries, supplementary irrigation is generally used to improve production in dry summers, especially when the dry period occurs at a sensitive crop growth stage. Ireland and Luxembourg did not declare irrigable or irrigated areas in 2003 and 2007 whereas Finland had an area equipped for irrigation but did not actually irrigate.
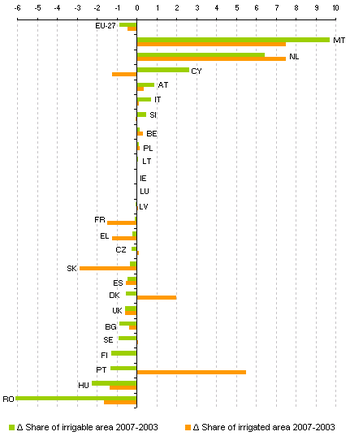
Graph 7 shows the change in the shares of irrigable and irrigated areas in total UAA between 2003 and 2007. The difference is presented in percentage points. The share of irrigable area increased in Malta from
21.3% to 31.0%, an increase of more than 9.7 percentage points, while the share of irrigated area rose from 19.7% to 27.2%. The share of irrigable area also increased significantly in the Netherlands between 2003 and 2007; however, the share of irrigated area increased even more in the same period. In Romania the shares of irrigable and irrigated areas decreased significantly. In Portugal and Denmark irrigation intensified as the share of irrigated area increased while the share of irrigable area decreased. The changes observed in irrigation could be caused by changes in cropping patterns (towards less or more water-intensive crops) and the share of irrigated areas by crop. To analyse these influences on irrigation, data on crop areas and irrigated areas for individual crops are needed. Data on irrigated areas by crop are not available after 2003. Therefore it is not possible to see whether the change in irrigation
between 2003 and 2007 may have been influenced by changes in cropping patterns and irrigation of crops.
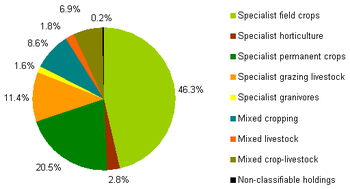
Graph 8 shows the share of irrigable area managed by different farm types in the EU (excluding Germany and Estonia) in 2007. The largest share of irrigable area in 2007 was managed by crop-specialist holdings, as farms specialised in field crops, horticulture and permanent crops altogether accounted for 69.6% of the irrigable area, while holdings specialised in grazing livestock and granivores managed only 13.0%. Mixed farming accounted for 17.3% of the irrigable area and 0.2% was managed by non-classifiable holdings. Although some countries experienced significant changes between 2003 and 2007, the distribution over farm types changed very little in the EU-27 (excluding Germany and Estonia) as a whole. The most significant changes occurred in the share managed by holdings specialised in field crops, which decreased from 48.7% in 2003 to 46.3% in 2007, and in the share managed by holdings specialised in permanent crops, which increased from 18.5% to 20.5%.
Irrigation can lead to water pollution from pesticides and nutrients due to increased run-off. Lack of rotation and diversification on specialist holdings takes away key self-regulating mechanisms, turning monocultures into highly vulnerable agri-systems. Therefore crop-specialist holdings have a greater risk of pesticide and nutrient leaching than other types of farm. However, the actual risk of nutrient and pesticide pollution from farming depends on the combination of farm management practices such as the amount of water, pesticides and nutrients used, the irrigation, plant protection and fertilisation techniques, or the timing and method of application.
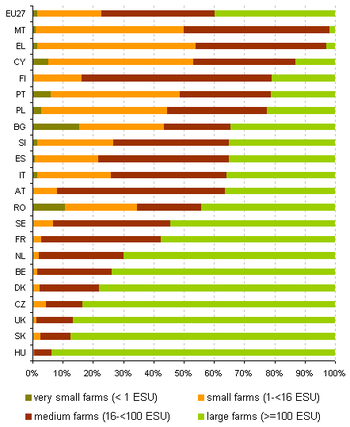
Graph 9 shows the share of irrigable area managed by holdings of different economic size in the EU in 2007. In the EU (Germany, Estonia, Latvia and Lithuania excluded), 39.9% of the irrigable area was managed by large farms (>=100 ESU ) and 22.7% by small and very small farms (<16 ESU).
However, the share of UAA managed by large farms in the EU (Germany, Estonia, Latvia and Lithuania excluded) in 2007 was only 29.0%, whereas the share of UAA managed by small and very small farms was 32.4%. Thus it seems that, in general, irrigation (measured by the irrigable area) was more common on large farms than on small and very small farms, although the situation was the opposite in Portugal, Bulgaria and Cyprus. In Bulgaria the share of irrigable area managed by very small and small farms was 43.4%, whereas the share of total UAA managed by these farms was 21.4%. In most Member States the irrigable area managed by very small farms (<1 ESU) is negligible; however, in Portugal, Bulgaria, Romania and Cyprus the irrigable area managed by very small farms is significant (5-15%).
Data sources and availability
All the data come from the Farm Structure Surveys.
Context
Around 40 % of the EU’s land area is farmed. This fact alone highlights the importance of farming for the EU’s natural environment. The links between the two, however, are complex. On the one hand, farming has contributed over the centuries to creating and maintaining a variety of valuable semi-natural habitats and agricultural landscapes on which a wide range of wild species rely for their survival. On the other hand, agriculture also has an adverse impact on natural resources such as pollution of soil, water and air, fragmentation of habitats, and a loss of wildlife which can result from agricultural practices and land use.
This complex relationship has to be taken into account in integrating environmental concerns and safeguards into the Common agricultural policy (CAP), with particular attention paid to reducing the risks of environmental degradation through cross-compliance criteria (as a condition for benefiting from direct payments, farmers must comply with certain requirements, some related to environmental protection), incentives and targeted agri-environmental measures, in order to enhance the sustainability of agro-ecosystems.
The importance attached to assessing the interaction between agriculture and the environment is underlined by the fact that the European Commission adopted a list of 28 agri-environmental indicators (AEI) in 2006 in its Communication COM(2006) 508 final. The AEI are developed for monitoring the integration of environmental concerns into the common agricultural policy at EU, national and regional levels.
Further Eurostat information
Publications
- Agricultural statistics: Main results - 2007-08
- SIGMA - The Bulletin of European Statistics, 01/2010: From farm to fork - Focus on sustainable agriculture and fisheries statistics
Main tables
- Agriculture (t_agri), see:
- Structure of agricultural holdings (t_ef)
- Irrigable area (tag00095)
- ...
- Livestock density index (tsdpc450)
Database
Dedicated section
Methodology/Metadata
- Main agricultural land types [ESMS metadata file - aei_ps_alt_esms]
- Major livestock categories [ESMS metadata file - aei_ps_lsc_esms]
- Livestock density [ESMS metadata file - aei_ps_ld_esms]
- Irrigable and irrigated areas [ESMS metadata file - aei_ps_ira_esms]
- Irrigation methods [ESMS metadata file - aei_ps_irm_esms]
- Specialised and mixed farming [ESMS metadata file - aei_ps_sm_esms]

