Data extracted in March 2024.
Planned article update: 30 April 2025.
Highlights
All European Neighbourhood Policy-South countries for which data is available experienced a sharp increase in consumer prices in 2022. In Lebanon, economic and financial crises since 2020 have led to exponentially rising prices.
In the European Neighbourhood Policy-South region, Lebanon had by far the highest long-term unemployment, with a rate of 14.3% in 2022. There were high rates also in Palestine (9.6%) and Morocco (8.9%). In comparison, in the EU the rate was 2.4% in 2022.
This article is part of an online publication. It provides data on economic statistics for nine of the ten countries that form the European Neighbourhood Policy-South (ENP-South) region — Algeria, Egypt, Israel, Jordan, Lebanon, Libya, Morocco, Palestine [1] and Tunisia. Cooperation with Syria is suspended since 2011. Lebanon data does not account for Palestinian refugee camps in Lebanon.
This article presents, among others: statistics on Gini coefficient measuring inequality of disposable income, Consumer price index highlighting prices trends and disparity but also non-economic indicators such as the share of population connected to public water supply. The last part of the article presents the long-term unemployment and share of population below the national poverty line as a measure of the risk of social and economic exclusion.
Gini coefficient of equivalised disposable income
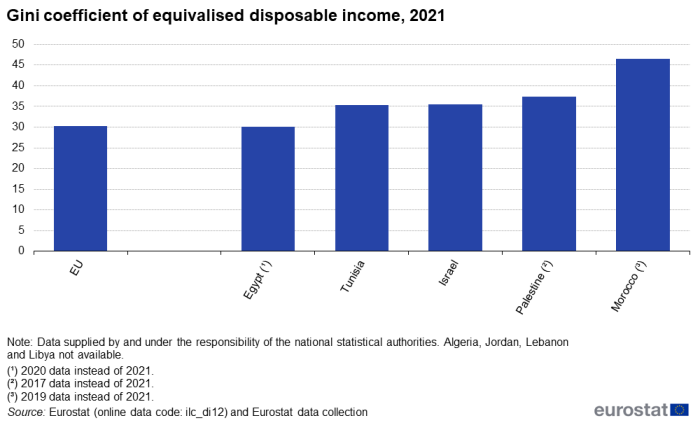
The Gini coefficient measures inequality in how income is distributed within a country. It measures how different the actual income distribution is from a distribution where every household has the same income. Higher values of the coefficient indicate greater income inequality: if the Gini coefficient is 0, everyone has the same income; a coefficient of 100 means that one household has all the income. The Gini coefficient is one of the most common indicators for measuring economic inequality. In Figure 1, the Gini coefficients for equalised disposable income in the ENP-East countries are presented and compared with the coefficient for the EU.
Source: Eurostat (ilc_di12) and Eurostat data collection.
The disposable income of a household is its total net income, including income from work and investments, as well as social benefits, after any taxes are deducted and social contributions paid. To compare the disposable income of households of different sizes and compositions, the size of the households is 'equivalised' by giving a weight to each member of the household, with the first adult counting 1.0 and all other persons in the household counting less, typically according to age group. In the OECD modified scale used for the EU, further household members aged 14 and over count 0.5, while children aged under 14 count 0.3.
Among the ENP-South countries for which data is available, the income inequality measured by the Gini coefficient was lowest in Egypt, at 30.0 (2020 data). The Gini coefficients in Tunisia and Israel were notably higher, at 35.3 and 35.5, respectively (both 2021 data). The same applied to Palestine, at 37.4 (2017 data). The inequalities in disposable income were more pronounced in Morocco, with a Gini coefficient of 46.4 (2019 data).
Data is not available for Algeria, Jordan, Lebanon and Libya.
The EU had a Gini coefficient of 30.2 in 2021.
Consumer prices
A consumer price index (CPI), in the EU countries the Harmonised index of consumer prices (HICP), is an indicator that measures changes in the price level of a basket of goods and services purchased by households. The index is used to assess inflation in an economy.

(index 2015 = 100)
Source: Eurostat (prc_hicp_aind) and (enps_cpi).
In Figure 2, the data for Lebanon is presented in a separate chart with a different scale, as its consumer prices increased exponentially from 2020 to 2022. Between 2012 and 2019, consumer prices in Lebanon changed year-on-year by between -3.8% (2015) and 6.1% (2018), with deflation in 2015 (-3.8%) and 2016 (-0.8%). The prices almost doubled (+84.9%) in 2020, more than doubled in 2021 (+147.2%) and almost tripled in 2022 (+171.2%). In 2022, consumer prices were 12 times higher than they were in 2019. This remarkably high inflation, combined with a strong devaluation of the Lebanese currency, was part of the large economic and financial crisis which affected the country from 2019 onwards. This crisis culminated from the economic and financial effects of a banking crisis, a sovereign debt default by the Lebanese state, the Covid-19 pandemic, the Beirut port explosion, and the beginning of the Russian war of aggression against Ukraine.
Between 2012 and 2019, the consumer price index more than doubled in Egypt, from 75.2 in 2012 to 184.1 in 2019. Inflation was particularly strong 2016-2018, peaking at 29.5% in 2017. In 2013-2016 as well as 2019, the consumer prices grew year-on-year by between 9.2% (2019) and 10.4% (2014). Data on consumer prices is not available for Egypt for 2020-2022.
In Tunisia, the consumer price index increased from 86.0 in 2012 to 151.1 in 2022, corresponding to an increase in consumer prices of 75.7% over this period. Inflation followed a relatively stable trend, with year-on-year increases in consumer prices ranging between 3.6% (2016) and 8.2% (2022).
Algeria also experienced a significant increase in consumer prices over the period, with the index rising from 89.8 in 2012 to 143.3 in 2022 (+59.6%). The lowest rise in consumer prices was recorded in 2019, at 2.0%. The highest rises were recorded in a period of accelerating prices in 2021 and 2022, with increases of 7.3% and 9.2%, respectively. It should be noted that the data have been rescaled from a series originally provided with index year 2001 = 100.
Regarding the other countries of the ENP-South, price increases were more moderate, even recording deflation in some years, but with accelerated inflation in 2022. The consumer price index in Morocco increased from 96.2 in 2012 to 113.7 in 2022, a plus of 18.2% over the period. Year-on-year, prices rose by between 0.2% (2019) and 1.9% (2013), except in 2022 when the consumer prices increased by 6.6%.
In Jordan, the index grew from 93.5 in 2012 to 109.7 in 2021 (2022 data not available). This was an overall increase of 17.3% over this period. The annual changes in consumer prices varied between deflation of -0.9% and -0.8% in 2015 and 2016, respectively, to inflation of 4.8% in 2013 and 4.5% in 2018.
Israel measured a rise in consumer prices of 8.1% from 2012 to 2022, with the index increasing from 98.7 (2012) to 106.7 (2022). For individual years, the consumer prices changed year-on-year within the range -0.6% (2015) to 1.5% (2013 and 2021), except in 2022 when prices rose by 4.3%.
In Palestine, the consumer price index climbed from an estimated 95.3 in 2012 to 105.7 in 2022. This corresponded to an increase in consumer prices of 10.9% over this period, with annual changes ranging between -0.8% (2020) and 1.8% (2014), except in 2022 when inflation stood at 3.7%.
Comparable data on the consumer price index is not available for Libya.
In the EU, consumer prices grew continuously over the period 2012-2022, with the harmonised index of consumer prices rising from 98.2 in 2012 to 118.8 in 2022. Over the whole period, prices increased by 21.0%, with most of this increase coming in 2021 (2.9%) and 2022 (9.2%). Over the rest of the period, annual inflation was between 0.1% (2015) to 1.8% (2018).
Persons connected to public water supply
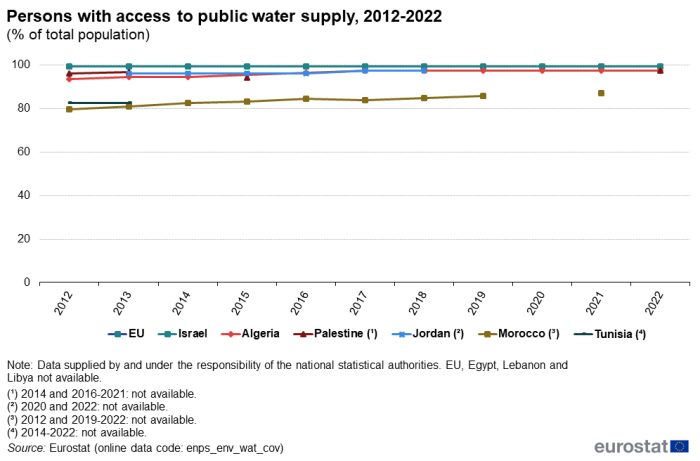
Safe and affordable access to drinking water is a necessity for a good living quality. The share of the population that have access to public water supply is an important indicator of living quality (Figure 3).
(% of total population)
Source: Eurostat (enps_env_wat_cov).
In Israel, the whole population had access to public water in the period 2012-2022, with complete coverage of water supply.
Over the same period, Algeria and Palestine both improved the water infrastructure to assure access to the public water supply for almost all of its population. In Algeria, the share of the population increased steadily from 94% in 2012 to 98% in 2017, remaining at that level for the rest of the period. In Palestine, the coverage decreased from 96.6% in 2012 to 94.9% in 2015 but increased again to 98.0% in 2022. However, data for Palestine is not available for 2014 and 2016-2021. Similarly, in Jordan most of the population had access to public water supply. From 2013 to 2016, the share of the population covered stood at 96.7%, rising to 98.0% in 2017 and 2018. More recent data is not available for Jordan.
In Morocco, access to public water supply has increased steadily from 80.2% in 2012 to 87.8% in 2021 (2020 and 2022 data not available).
In Tunisia, 83.0% of the population had access to public water supply in 2012 and 2013, the only years for which data is available.
Data for the EU, Egypt, Lebanon and Libya is not available.
Electricity prices for households
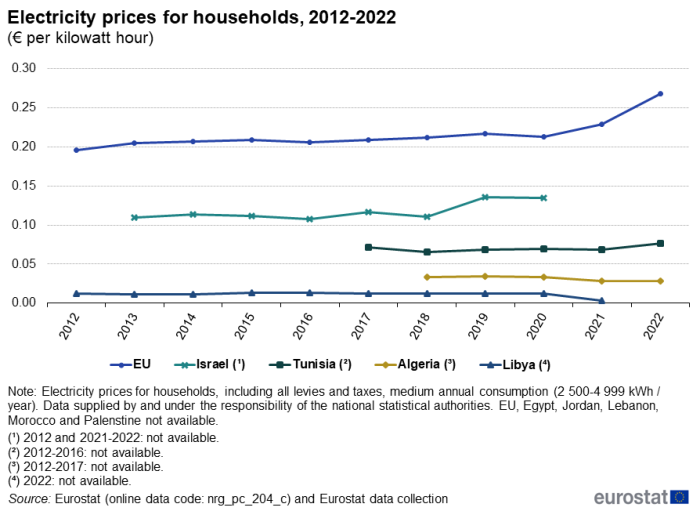
The electricity prices for households presented in Figure 4 are based on prices for households with medium annual electricity consumption, i.e. between 2 500 and 5 000 kilowatt-hours (kWh) per year. The prices include all levies and taxes, also VAT.
(€ per kilowatt hour)
Source: Eurostat (nrg_pc_204) and Eurostat data collection.
Over the period 2013-2018, households in Israel paid between €0.107 (2016) to €0.112 (2015) per kWh of electricity. Subsequently, the electricity price increased by 22.2% in 2019 compared with 2018, to €0.135 per kWh. The price remained stable, at €0.134 per kWh, in 2020. Data for the years 2012, 2021 and 2022 is not available.
In Tunisia, electricity prices for households fluctuated between 2017 and 2022 (no data available prior to 2017). The lowest price was observed in 2018, at €0.066 per kWh, following a 9.0% decrease compared with the year before. The highest price was registered in 2022, at €0.077 per kWh, after an increase of 11.8%.
Between 2018 and 2020, the electricity price for households in Algeria remained stable at €0.033 to €0.034 per kWh (no data available prior to 2018). In 2021, the price decreased to €0.028 per kWh (-15.2% compared with 2020) and remained unchanged in 2022.
In Libya, the electricity price for households varied only marginally between €0.012 and €0.013 per kWh over the period 2012-2020.In 2021 the price measured in € per kWh fell sharply, by 70.4% compared with 2020, to €0.004 per kWh. However, this large fall was mainly caused by a devaluation of the Libyan dinar (LYD) at the beginning of 2021; measured in LYD per kWh, the price fell by -7.2%. Data for 2022 are not available.
Data for Egypt, Jordan, Palestine, Lebanon and Morocco is not available.
In the EU, the electricity price for households with medium annual consumption fluctuated between €0.196 per kWh (2012) and €0.217 per kWh (2019) over the period 2012-2020. In 2021, the price increased by 7.2 % to €0.229 per kWh. The electricity price for households increased further in 2022, by 17.3% to €0.268 per kWh.
Gas prices for households
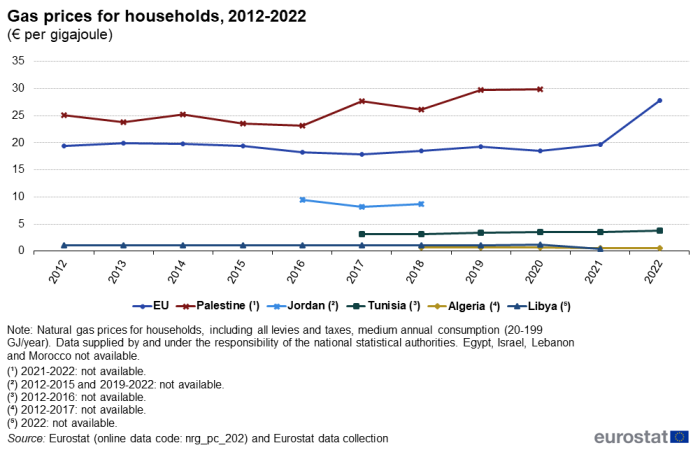
The prices of natural gas for households, presented in Figure 5, refer to prices for households with medium annual consumption of natural gas, i.e. between 20 and 200 gigajoule (GJ) per year. The gas prices in € per GJ include levies, VAT and all other taxes.
(€ per gigajoule)
Source: Eurostat (nrg_pc_202) and Eurostat data collection.
Palestine experienced significant fluctuations in the gas price for households with medium annual consumption, with the gas price ranging between €23.180 per GJ (2016) and €27.700 per GJ (2017) from 2012 to 2018, until it stabilised at €29.700 per GJ in 2019 and €29.900 in 2020. Data for 2021 and 2022 is not available. Particularly high increases were seen in 2017 (19.5%) and 2019 (13.8%).
Data for the household gas price in Jordan is only available for 2016, 2017 and 2018. The gas price in Jordan decreased over these years, from €9.453 per GJ in 2016 to €8.750 per GJ in 2018 (-7.4%).
Tunisia's gas price for households increased overall, from €3.200 per GJ in 2017 to €3.836 per GJ in 2022, the highest price recorded in Tunisia in this period (data not available before 2017). The lowest price was recorded in 2018, at €3.114 per GJ. The prices fell in 2018 and 2021, by -2.7 and -2.0%, respectively. There were high price increases in 2019 (10.3%) and 2022 (9.0%).
Algeria experienced a drop in the gas price for households by -14.7% in 2021, with the price falling to €0.573 per GJ in 2021 and remaining at that level also in 2022. In the preceding years 2018-2020, the price had fluctuated between €0.672 per GJ (2018 and 2020) and €0.690 per GJ (2019). Data is not available before 2018.
The gas price for households in Libya remained relatively stable between 2012 and 2020, varying from €1.079 per GJ (2012) to €1.264 per GJ (2020). Just as the electricity price discussed above, the gas price measured in € per kWh fell sharply in 2021, by -70.4% to €0.374 per GJ. However, as for the electricity price, the scale of the fall in the gas price was magnified by the devaluation of the Libyan dinar at the beginning of 2021. Measured in dinars per kWh, the fall in the price was -7.2%. Data for 2022 is not available.
Data for Egypt, Israel, Lebanon and Morocco are not available.
In the EU, the gas price for households ranged between €17.931 per GJ (2017) and €19.719 per GJ (2021) from 2012 to 2021. However, the price rose sharply in 2020, by 40.8% to €27.757 per GJ, following the start of Russia' war of aggression against Ukraine and the associated turbulences in international gas markets.
Long-term unemployment rate
The long-term unemployment rate presented in Figure 6 represents the percentage of the labour force that is unemployed and has been actively seeking employment for at least a year. Unemployment results in a loss of income, and if it persists long-term it increases the risk of falling into poverty.
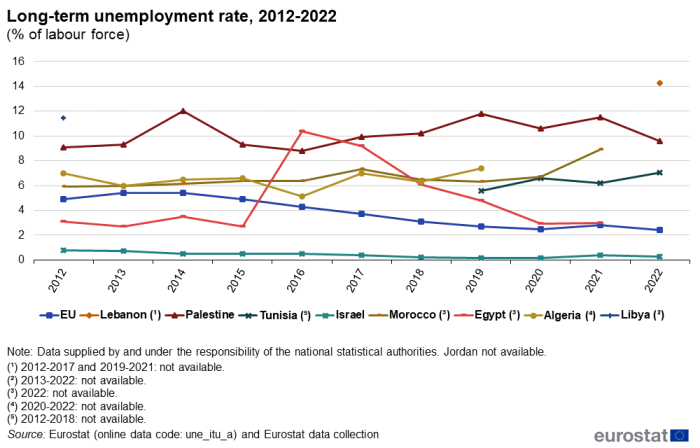
(% of labour force)
Source: Eurostat (une_itu_a) and Eurostat data collection.
In Lebanon, the long-term unemployment rate more than doubled between 2018, when it was 6.3%, and 2022, when it was 14.3%. Data are available only for those two years.
Data for the long-term unemployment rate in Libya is available only for 2012, when it was 11.5%.
The long-term unemployment rate in Palestine fluctuated considerably over the period 2012-2022, overall increasing from 9.1% in 2012 to 9.6% in 2022. In the years between, the rate ranged between 8.8% in 2016 and 12.0% in 2014. In 2022, it decreased by 1.9 percentage points (pp) compared with 2021, when it stood at 11.5%.
In Morocco, the long-term unemployment rate was relatively stable between 2012 and 2020, with an increase from 5.9% (2012 and 2013) to 7.3% (2017). In 2021, long-term unemployment increased substantially, by 2.2 pp to 8.9%. (Data for 2022 is not available.)
The long-term unemployment rate in Algeria remained relatively stable between 2012 and 2019 (no data after 2019 available), ranging from 5.1% 2016 and 7.4% in 2019.
In Tunisia, the long-term unemployment rate ranged from 5.6% in 2019 to 7.0% in 2022. Data before 2018 are not available.
In Egypt, the long-term unemployment rate was relative stable between 2012 and 2015, ranging between 2.7% in 2013 and 3.5% in 2014. In 2016, the rate increased by 7.7 percentage points, to 10.4% in 2016. Then, the rate progressively decreased to 2.9% in 2020. A small increase was recorded in 2021, to 3.0%. 2022 data are not available for Egypt.
Israel maintained a relatively stable long-term unemployment rate over the period 2012-2022, ranging from 0.8% in 2012 to 0.2% in 2018, 2019 and 2020. In 2022 it stood at 0.3%.
In the EU, the long-term unemployment rate steadily declined from 5.4% in 2013 to 2.4% in 2022, with an exception in 2021, when it increased by 0.3 percentage points compared to 2020.
Data is not available for Jordan.
Persons below the national poverty line
The poverty rate as defined by the national poverty line corresponds to the share of the population that fails to meet the standard considered necessary to cover basic needs. The so-called 'poverty headcount ratio at national poverty lines' is normally estimated based on national household surveys on income, expenditure, consumption and living conditions, such as the National survey on consumer spending and household standard of living in Algeria, or the Household income, expenditure and consumption survey in Egypt, or other household income, expenditure and consumption surveys. [2].
The 'poverty headcount ratio at national poverty lines' is presented in Figure 6. It should be noted that the poverty rates at national poverty lines are not suited to compare countries, as the national poverty lines are specific to each country. However, they are useful to analyse poverty within a specific country.
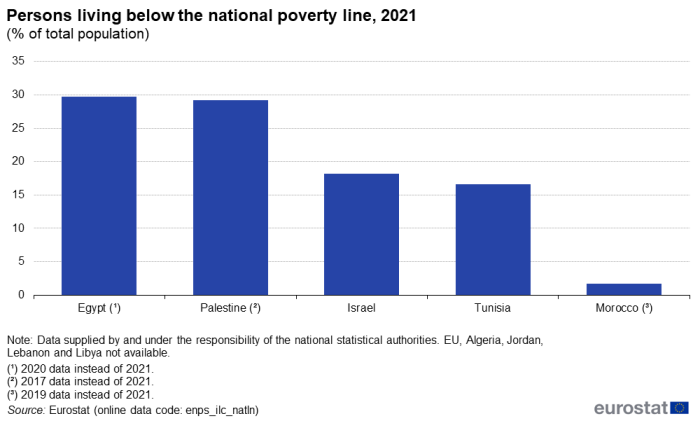
(% of total population)
Source: Eurostat (enps_ilc_natln)
Almost one third (29.7%) of the population in Egypt lived below the national poverty line in 2020 (2021 data not available).
The same applied to Palestine, where 29.2% of the population lived below the national poverty line in 2017 (more recent data not available).
In 2021, the share of the population below the national poverty line was 18.2% in Israel.
In Tunisia, the 'poverty headcount ratio at national poverty line' stood at 16.6% in 2021.
Morocco recorded a very low share of the population living below the national poverty line in 2019 (more recent data not available), with 1.7%.
Data for the EU, Algeria, Jordan, Lebanon and Libya are not available.
Source data for tables and graphs
Data sources
The data for ENP-South countries are supplied by and under the responsibility of the national statistical authorities of each country on a voluntary basis. The data mainly result from an annual data collection cycle that has been established by Eurostat. Cooperation with Syria is suspended since 2011. These statistics are available free-of-charge on Eurostat's website, together with a range of different indicators covering most socio-economic areas.
For the EU, the EU statistics on income and living conditions (EU-SILC) is a key source for data on living conditions of the European population. It aims to collect timely and comparable data on income, poverty, social inclusion and living conditions. Eurostat's website provides an overview of legislation related to EU-SILC, as well as an online publication on EU statistics on income and living conditions (EU-SILC) methodology and an overview article over main results on Living conditions in Europe - poverty and social exclusion.
In the ENP-South countries, data are generally collected through national household surveys on income, expenditure, consumption and living conditions, such as the Household Income and Expenditure Surveys (HIES). [3] Data on household income and expenditure may also be collected using income surveys, household budget surveys, or living standard measurement surveys. In the ENP-South countries, poverty estimates are generally based on surveys such as the National survey on consumer spending and household standard of living in Algeria, the Household income, expenditure and consumption survey (HIECS) in Egypt, the Household expenditure and income survey (HEIS) in Jordan, the National household consumption and expenditure survey (ENCDM) in Morocco and the National survey on the budget, consumption and standard of living of households (EBCNV) in Tunisia. These representative surveys are generally carried out at regular intervals, e.g. on average every two years in Egypt and every seven years in Morocco.
National poverty lines are generally applying a 'cost of basic needs' (CBN) approach to estimate poverty. These basic needs are generally defined through estimated required calories per capita, and a common food and non-food basket for all households. The calculation generally includes expenditure groups such as food, clothing, education, health, dwelling-related expenditures, communications, transportation, an estimate of the rental value for the dwelling the household lives in, general services, and purchases of other non-durable goods. Separate poverty lines may be calculated for urban and rural regions when prices vary considerably between urban and rural regions.
Context
The Covid-19 crisis and the subsequent cost-of-living crisis have had a direct and indirect impact on the general population but in particular on vulnerable groups such as the elderly, people with disabilities, young people, low-wage earners, part-time workers and people with precarious work contracts. Pressure on the living conditions of households have increased through rising consumer prices and energy prices in particular, together with a generally uncertain economic environment.
The EU and the EU Member States operate an open method of coordination for social protection and social inclusion. This aims to promote social cohesion and equality through adequate, accessible and financially sustainable social protection systems and social inclusion policies. As such, the EU provides a framework for national strategy development, as well as the opportunity to discuss and learn from best practices and to coordinate policies between EU Member States in areas such as: building a fairer and more inclusive EU, social protection and social inclusion, and pensions.
At the start of March 2021, the European Commission outlined its ambition for an EU that focuses on education, skills and jobs for the future and targets a fair, inclusive and resilient socioeconomic recovery. The European Pillar of Social Rights Action Plan outlines a range of actions designed to promote social rights through the active involvement of social partners and civil society. It also proposes employment, skills and social protection headline targets for the EU. One of the headline targets relates specifically to living conditions, namely that the number of people at risk of poverty or social exclusion should decrease by at least 15 million persons (of which, at least five million should be children) between 2019 and 2030. The Action Plan highlights how the principles of the social pillar might be implemented, with the aim of building a stronger social Europe by 2030.
The European Neighbourhood Policy (ENP), launched in 2003 and developed throughout 2004, supports and fosters stability, security and prosperity in the EU's neighbourhood. The ENP was revised in 2015. The main principles of the revised policy are a tailored approach to partner countries; flexibility; joint ownership; greater involvement of EU member states and shared responsibility. The ENP aims to deepen engagement with civil society and social partners. It offers partner countries greater access to the EU's market and regulatory framework, standards and internal agencies and programmes.
The Joint Communication on Renewed Partnership with the Southern Neighbourhood – A new Agenda for the Mediterranean, accompanied by an Economic and Investment Plan for the Southern neighbours, of 9 February 2021 further guides cooperation with the ENP-South countries. Additional information on the policy context of the ENP is provided on the website of Directorate-General European Neighbourhood Policy and Enlargement Negotiations (DG NEAR).
In cooperation with its ENP partners, Eurostat has the responsibility to promote and implement the use of European and internationally recognised standards and methodology for the production of statistics, necessary for designing and monitoring policies in various areas. Eurostat manages and coordinates EU efforts to increase the capacity of the ENP countries to develop, produce and disseminate good quality data according to European and international standards.
Reliable and comparable data are essential for evidence-based decision-making. They are needed to monitor the implementation of the agreements between the EU and the ENP-South countries, the impact of policy interventions and the reaching of the Sustainable Development Goals (SDGs).
The main objective of Euro-Mediterranean cooperation in statistics is to enable the production and dissemination of reliable and comparable data, in line with European and international norms and standards.
The EU has been supporting statistical capacity building in the region for a number of years through bilateral and regional activities. This takes the form of technical assistance to partner countries' national statistical authorities through targeted assistance programmes, such as the MEDSTAT programme (currently in its fifth phase: MEDSTAT V (2022-2025)), and activities such as training courses, working groups and workshops, exchange of best practices and the transfer of statistical know-how.
Notes
- ↑ This designation shall not be construed as recognition of a State of Palestine and is without prejudice to the individual positions of the Member States on this issue.
- ↑ Information on national poverty measurement and relevant household surveys can be found in the country poverty and equity briefs (PEBs) on the World Bank's Poverty and Inequality Platform (PIP).
- ↑ See e.g. the International Labour Organization's Survey Catalogue.
Explore further
Other articles
- All articles on non-EU countries
- European Neighbourhood Policy countries — statistical overview — online publication
- Statistical cooperation — online publication
- Income and living conditions – overview over all articles on income and living conditions
- EU statistics on income and living conditions (EU-SILC) methodology - online publication
Thematic section
Publications
Books
Factsheets
- Basic figures on the European Neighbourhood Policy-South countries — 2023 edition
- Statistics for a green future — factsheets on European Neighbourhood policy-South Countries — 2022 edition
- Basic figures on the European Neighbourhood Policy-South countries — 2022 edition
- Basic figures on the European Neighbourhood Policy-South countries — 2021 edition
Leaflets
- Basic figures on the European Neighbourhood Policy — South countries — 2020 edition
- Basic figures on the European Neighbourhood Policy — South countries — 2019 edition
- Labour force statistics in Enlargement and ENP‑South countries — 2019 edition
- Basic figures on the European Neighbourhood Policy — South countries — 2018 edition
- Energy and transport statistics for the European neighbourhood policy-South countries — 2018 edition
- Basic figures on the European Neighbourhood Policy — South countries — 2016 edition
- Labour force statistics for the Mediterranean region — 2016 edition
- Basic figures on the European Neighbourhood Policy — South countries — 2015 edition
- International trade in goods for the European neighbourhood policy-South countries — 2018 edition
Factsheets
Methodology
- Southern European Neighbourhood Policy countries (ENP-South) (enps) (ESMS metadata file — enps_esms)
- Income and living conditions (ESMS metadata file — ilc)
External links
- Directorate-General European Neighbourhood Policy and Enlargement Negotiations (DG NEAR) — Southern Neighbourhood
- Directorate-General European Neighbourhood Policy and Enlargement Negotiations (DG NEAR) — The EU and its Southern Neighbourhood Factsheet (2021)
- European External Action Service — European Neighbourhood Policy
- European External Action Service — Renewed partnership with the Southern Neighbourhood - A new agenda for the Mediterranean
- Joint Communication JOIN(2021) 2 final: Renewed Partnership with the Southern Neighbourhood – A new Agenda for the Mediterranean
- Joint Staff Working Document SWD(2021) 23 final: Renewed Partnership with the Southern Neighbourhood – Economic and Investment Plan for the Southern Neighbours, accompanying the document JOIN(2021) 2 final
- Economic and Investment Plan for the Southern neighbours
- European External Action Service — Middle South and North Africa (MENA)
- European External Action Service — Union for the Mediterranean (UfM) and the EU
- MEDSTAT V – Euro Mediterranean Statistical Cooperation
- Directorate-General for Employment, Social Affairs and Inclusion
- The European Pillar of Social Rights Action Plan
