Archive:Housing statistics
- Data from June 2009, most recent data: Further Eurostat information, Database.
Decent and affordable housing is a fundamental need and right which a number of European Union (EU) Member States still cannot fully satisfy; housing deprivation is one of the examples of poverty and social exclusion. This article presents data on the new housing indicators adopted by the Indicators Sub-Group of the Social Protection Committee in 2009, in order to monitor social inclusion.
Main statistical findings
Tenure status
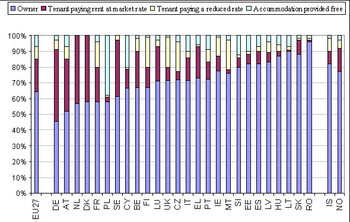
In 2007, 65 % of households in the EU owned their home, 21 % paid rent at market rates, 8 % paid a reduced-rate rent and 7 % occupied free accommodation. A majority of households in all Member States owned their own home, with the highest proportions in Romania (96 %), Lithuania, Slovakia (both 89 %) and Hungary (87 %). By contrast, Germany (46 %), Austria (52 %), the Netherlands (56 %) and Denmark, France and Poland (all 58%) had the lowest percentages of proprietary households.
Type of dwelling
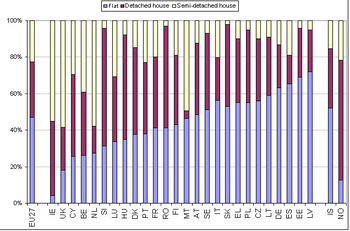
In 2007, 46 % of EU households lived in flats, 30 % in detached houses and 22 % in semi-detached houses. The share of households living in flats was highest in Latvia (72 %), Estonia (69 %), Spain (66 %) and Germany (62 %). The percentage of households living in detached houses was largest in Slovenia (65 %), Hungary (57 %), Romania (56 %) and Denmark (48 %). The highest percentages for semi-detached houses were reported in the United Kingdom (59 %), as well as Ireland and the Netherlands (both 55 %).
Housing quality
The overcrowding rate describes the percentage of people living in households considered to be overcrowded. It depends on the household's size, as well as its members' ages and family situation.
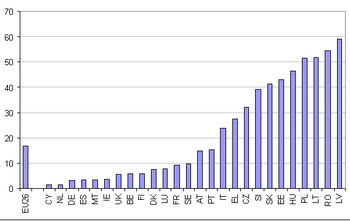
In 2007, 17 % of the EU population lived in overcrowded households. Among Members States, the highest percentages of overcrowded households were registered in Latvia (59 %), Romania (54 %), Lithuania and Poland (both 52 %). By contrast, Cyprus and the Netherlands (both 2 %) recorded the lowest percentage.
Housing affordability
Two new indicators were recently adopted to measure housing affordability. These are the 'Share of population whose housing cost overburden rate exceeds 40% of disposable income' and the median of the distribution of the 'Share of housing cost in disposable income' indicator, which is the proportion of disposable income spent on housing by half of the population.
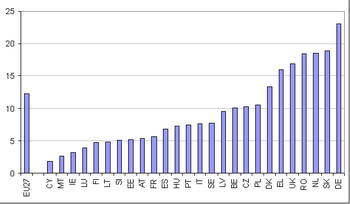
In the EU in 2007, 12 % of European citizens spent 40 % or more of their disposable income on housing. This average masks significant differences between Member States. At one extreme are countries with a small percentage of the population whose housing cost exceeds 40 % of their disposable income including: Cyprus (2 %), Malta and Ireland (both 3 %), as well as Luxembourg (4 %). At the other extreme, this share was around 18-19 % in Romania, the Netherlands and Slovakia. The highest value was reached in Germany with 23 %.
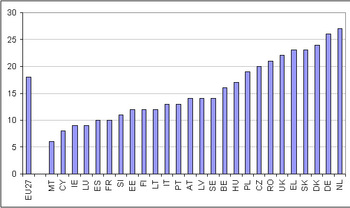
The median of the housing costs burden distribution - measured by the share of housing costs in disposable income - reached 18 % in 2007. The median of the distribution, however, varied enormously across Europe, ranging from 6 % to 27 %. The lowest values were recorded in Malta, Cyprus, Ireland and Luxembourg, with 50 % of individuals living in households for which the housing costs represented less than 10 % of the total disposable income. By contrast, 50 % of the population in Romania, the United Kingdom, Greece, Slovakia, Denmark, Germany and the Netherlands lived in households for which the housing costs represented more than 20 % of the total disposable income.
Data sources and availability
The information presented in this section are extracted from micro-data from EU statistics on income and living conditions (EU-SILC) and refers to 2007, when EU-SILC covered all EU Member States plus Norway and Iceland. There is no data yet for Bulgaria.
Context
At the Laeken European Council in December 2001, European heads of state and government endorsed a first set of common statistical indicators of social exclusion and poverty that are subject to regular revisions by the Indicators Sub-group (ISG) of the Social Protection Committee (SPC). These indicators are an essential element in the 'open method of coordination (OMC)' to monitor the progress of Member States in the fight against poverty and social exclusion. The list was updated in 2006 and 2008.
The 2001 SPC report on indicators to monitor the social inclusion process recommended "improving comparable information and reporting on decency of housing, housing costs and homelessness". The 2006 SPC report on indicators reserved a slot in the social inclusion portfolio for housing.
To provide underlying data for indicators, the EU Statistics on income and living conditions ( EU-SILC) was implemented. The EU-SILC, organized under a Framework Regulation (1177/2003) of the European Parliament and the Council, is now the basis for statistics on income and living conditions, in particular for common social inclusion indicators.
Further Eurostat information
Database
- Income and living conditions (ilc)
- Living conditions (ilc_lv)
- Housing conditions (ilc_lvho)
- Distribution of population by degree of urbanisation, dwelling type and income group (Source: SILC) (ilc_lvho01)
- Distribution of population by tenure status, type of household and income group (Source: SILC) (ilc_lvho02)
- Average number of rooms per person by tenure status and dwelling type from 2003 (Source: SILC) (ilc_lvho03)
- Average number of rooms per person by tenure status and dwelling type until 2001 (Source: ECHP) (ilc_lvho03h)
- Average number of rooms per person by type of household and income group from 2003 (Source: SILC) (ilc_lvho04)
- Average number of rooms per person by type of household and income group until 2001 (Source: ECHP) (ilc_lvho04h)
- Housing conditions (ilc_lvho)
- Material deprivation (ilc_md)
- Economic strain linked to dwelling (ilc_mded)
- Share of housing costs in disposable household income, by type of household and income group (Source: SILC) (ilc_mded01)
- Share of rent related to occupied dwelling in disposable household income, by type of household and income group (Source: SILC) (ilc_mded02)
- Total housing costs in pps (Source: SILC) (ilc_mded03)
- Financial burden of the total housing cost (Source: SILC) (ilc_mded04)
- Financial burden of the repayment of debts from hire purchases or loans (Source: SILC) (ilc_mded05)
- Economic strain linked to dwelling (ilc_mded)
- Living conditions (ilc_lv)
Dedicated section
- Household Budget Surveys
- Income, Social Inclusion and Living Conditions
Other information
- The continuity of indicators during the transition between ECHP and EU-SILC
- The production of data on homelessness and housing deprivation in the European Union: survey and proposals
- Regulation 1177/2003 of 16 June 2003 concerning Community statistics on income and living conditions (EU-SILC)
- Regulation 1553/2005 of 7 September 2005 amending Regulation 1177/2003 concerning Community statistics on income and living conditions (EU-SILC)
- Regulation 1791/2006 of 20 November 2006 adapting certain Regulations and Decisions in the fields of ... statistics, ..., by reason of the accession of Bulgaria and Romania