Archive:Housing statistics
- Data from September 2011, most recent data: Further Eurostat information, Main tables and Database.
The text for this article is being edited in preparation for the 2012 edition of the Eurostat yearbook. Please do not edit it while the tables and graphs are being checked and while the text is being harmonised with the remainder of the yearbook publication.
Decent housing, at an affordable price in a safe environment, is a fundamental need and right. Ensuring this need, which is likely to alleviate poverty and social exclusion, is still a significant challenge in a number of European countries.
This article provides information in relation to recent statistics on housing in the European Union (EU), focusing on dwelling types, tenure status (owning versus renting), housing quality and affordability.


Main statistical findings
Type of dwelling
In 2009, 41.8 % of EU population lived in flats, 34.4% in detached houses and 23.0% in semi-detached houses. The share of persons living in flats was highest in Latvia (66.2%), Estonia (65.1%) and Spain (64.6%). The share of people living in detached houses was largest in Slovenia (68.7%), Hungary (67.6%), Romania (60.7%) and Denmark (58.4%). Norway also reported high share (62.4%) of those living in detached houses. The highest propensity to live in semi-detached houses was reported in the Netherlands (61.4%), the United Kingdom (60.9%) and Ireland (57.6%) - see Figure 1.
Tenure status
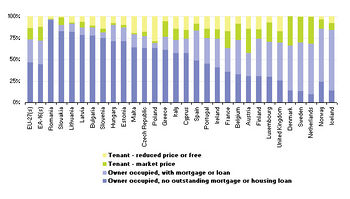
In 2009, just over one quarter of the EU-27 population lived in an owner-occupied home for which there was an outstanding loan or mortgage, while close to half of the population lived in an owner-occupied home without a loan or mortgage. As such, a total of nearly three quarters (73.6%) of the population lived in owner-occupied dwellings, while 13.0% lived in dwellings with a market price rent, and 13.5% in reduced-rent or free accommodation. At least half of the population lived in owner-occupied dwellings in 2009 across all of the EU Member States; the figures ranged from 57.5% in Austria to 96.5% in Romania. In the Netherlands (59.2%), Sweden (56.8%) and Denmark (52.8%) more than half of the population lived in owner-occupied dwellings with an outstanding loan or mortgage; this was also the case in Iceland (70.6%) and Norway (61.3%). The share of persons living in rented dwellings with a market price rent in 2009 was less than 10% in 12 of the EU Member States, as well as in Iceland. In Denmark, the Netherlands, Sweden and Austria more than one quarter of the population lived in rented dwellings with a market price rent. The share of the population living in a dwelling with a reduced price rent or occupying a dwelling free of charge was less than 20% in all of the Member States except for Poland where this share reached 29.1% (see Figure 2 - data for Germany not available).
Housing quality
One of the key dimensions in assessing the quality of housing conditions is the availability of sufficient space in the dwelling. The overcrowding rate describes the share of people living in a dwelling considered as overcrowded. Based on the number of rooms available to the household, this indicator depends on the household's size, as well as its members' ages and family situation.
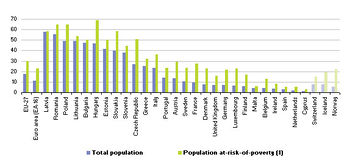
Some 17.7% of the EU-27 population lived in overcrowded dwellings in 2009; the highest overcrowding rates were registered in Latvia (57.7%), Romania (55.3%), Poland (49.1%) and Lithuania (49.0%). In contrast, Cyprus (1.0%) and the Netherlands (1.7%) recorded the lowest rates of overcrowding.
Within the population at-risk-of-poverty (i.e. individuals living in households where equivalised [i.e. per individual] disposable income is below 60% of the national median), the overcrowding rate in the EU-27 was 30.0% in 2009, about 12 percentage points above the rate for the whole population. The highest overcrowding rates among the population at-risk-of-poverty were registered in Hungary (68.8%), Poland (64.9%), and Romania (64.8%), while the overcrowding were lowest in Cyprus (2.7%), Spain (5.1%), the Netherlands (5.5%) and Malta (5.6%) (see Figure 3).
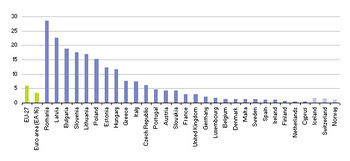
In addition to overcrowding some aspects of housing deprivation – such as the lack of a bath or a toilet, a leaking roof in the dwelling, or a dwelling considered as too dark – are taken into account to build a more complete indicator of housing quality. The severe housing deprivation rate is defined as the share of persons living in a dwelling which is considered as overcrowded, while having at the same time at least one of the housing deprivation measures. Across the EU-27 as a whole 5.9% of the population suffered from severe housing deprivation in 2009. In Poland, Lithuania, Slovenia, Bulgaria and Latvia more than 15% of the population faced severe housing deprivation in 2009, rising to a high of 28.6% in Romania. In contrast, less than 1% of the population in Finland, the Netherlands and Cyprus lived in conditions which could be qualified as severe housing deprivation (see Figure 4).
Housing affordability
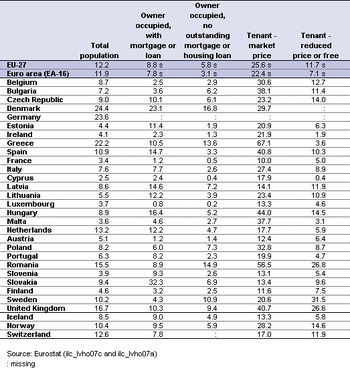
In 2009, 12.2% of the EU-27 population lived in the household that spent 40 % or more of their equivalised disposable income on housing. The proportion of the population whose housing costs exceeded 40% of their equivalised disposable income was highest for tenants with market price rents and lowest for persons in owner-occupied dwellings without a loan or mortgage (see Table 1).
The EU-27 average masks significant differences between Member States: at one extreme there were a number of Member States where a relatively small proportion of the population lived in the household that had housing costs in excess of 40% of their disposable income, notably Cyprus (2.5%), France (3.4%), Malta (3.6%), Luxembourg (3.7%), Slovenia (3.9%), Ireland (4.1%) and Estonia (4.4%) and Finland (4.6%). At the other extreme, 24.4% of the population in Denmark, 23.6% in Germany and 22.2% in Greece spent more than 40% of their equivalised disposable income on housing, well above the next highest shares recorded in the United Kingdom (16.7%) and Romania (15.5%).
Data sources and availability
The data used in this section are primarily derived from micro-data from EU statistics on income and living conditions (EU-SILC). The reference population is all private households and their current members residing in the territory of the Member State at the time of data collection; persons living in collective households and in institutions are generally excluded from the target population.
Context
Questions of social housing, homelessness or integration play an important role within the social policy agenda. The charter of fundamental rights stipulates in Article II-94 that ‘in order to combat social exclusion and poverty, the Union recognises and respects the right to social and housing assistance so as to ensure a decent existence for all those who lack sufficient resources, in accordance with Community law and national laws and practices’.
However, the EU does not have any responsibilities in respect of housing; rather, national governments develop their own housing policies. Many countries face similar challenges: for example, how to renew housing stocks, how to plan and combat urban sprawl, how to promote sustainable development, how to help young and disadvantage groups to get into the housing market, or how to promote energy efficiency among house owners.
Further Eurostat information
Publication
- 51 million young EU adults lived with their parent(s) in 2008 - Statistics in focus 50/2010
- Combating poverty and social exclusion
- Housing conditions in Europe in 2009 - Statistics in focus 4/2011
- Income and living conditions in Europe
- Over-indebtedness of European households in 2008 - Statistics in focus 61/2010
- The social situation in the European Union 2009
Main tables
- Data
- Main tables
- Income and living conditions (t_ilc)
- Living conditions (t_ilc_lv)
- Housing conditions (t_ilc_lvho)
- Housing deprivation
- Living conditions (t_ilc_lv)
- Income and living conditions (t_ilc)
- Main tables
Database
- Living conditions (ilc_lv)
- Housing conditions (ilc_lvho)
- Distribution of population by degree of urbanisation, dwelling type and income group (Source: SILC) (ilc_lvho01)
- Distribution of population by tenure status, type of household and income group (Source: SILC) (ilc_lvho02)
- Overcrowding rate (ilc_lvho_or)
- Housing cost burden (ilc_lvho_hc)
- Housing conditions (ilc_lvho)
Dedicated section
Source data for tables and figures (MS Excel)
![]() Housing statistics_graphs and table
Housing statistics_graphs and table
Methodology / Metadata
- Income and living conditions (ESMS metadata file - ilc_esms)
- The production of data on homelessness and housing deprivation in the European Union: survey and proposals
Other information
- Regulation 1177/2003 of 16 June 2003 concerning Community statistics on income and living conditions (EU-SILC)
- Regulation 1553/2005 of 7 September 2005 amending Regulation 1177/2003 concerning Community statistics on income and living conditions (EU-SILC)
- Regulation 1791/2006 of 20 November 2006 adapting certain Regulations and Decisions in the fields of ... statistics, ..., by reason of the accession of Bulgaria and Romania