- Data extracted in December 2014 and January 2015. Most recent data: Further Eurostat information, Main tables and Database. Planned article update: October 2016.
(thousand tonnes) — Source: Eurostat (apro_cpp_crop)
(%, based on tonnes) — Source: Eurostat (apro_cpp_crop)
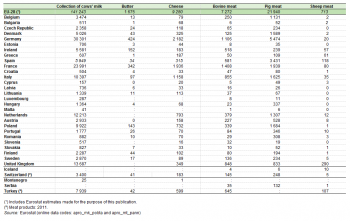
(thousand tonnes) - Source: Eurostat (apro_mk_pobta) and (apro_mt_pann)
There is a wide diversity of natural environments, climates, economic conditions and farming practices across Europe. They are reflected in the broad array of food and drink products that are made available for human consumption and animal feed, as well as a range of inputs for non-food processes. Indeed, agricultural products contribute to the cultural identity of Europe’s people and regions.
Main statistical findings
Crops
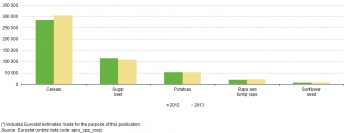
In 2013, the EU-28 produced 306 million tonnes of cereals (including rice). This was the highest level of production since a peak in production in 2008. The EU-28's production of cereals in 2013 was 20.9 million tonnes higher than in 2012 (+7.3 %).
The EU-28 produced 109.1 million tonnes of sugar beet in 2013, which was 5.7 million tonnes less than in 2012. The production of the other main root crop in the EU-28 — potatoes — was 53.9 million tonnes.
Oilseeds production has followed an upward pattern in recent years mainly due to the increased use of oilseeds for bioenergy production. Rape and turnip rape, and sunflower seeds are the main types of oilseeds produced in the EU-28. In 2013, 21.0 million tonnes of rape and turnip rape were produced, a much larger volume than in 2012 (+9.2 %). By comparison, an estimated 9.2 million tonnes of sunflower seeds were produced across the EU-28 in 2013.
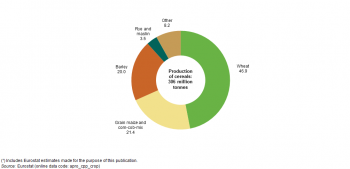
Figure 2 presents an analysis of the production of cereals in the EU-28 in 2013. Almost half (46.9 %) of the total production of cereals was accounted for by wheat, while around one fifth of the total was composed of grain maize and corn-cob-mix (21.4 %) and a further fifth of barley (20.0 %).
France and Germany were by far the largest cereal and sugar beet producers, together accounting for just over a half (51.9 %) of the EU-28’s sugar beet production and almost two fifths of its cereals production (37.6 %) in 2013 (see Table 1), while their combined share of the EU-28's oilseed production — as covered by rape and turnip rape and sunflower seeds — was also close to two fifths (39.1 %).
The production of potatoes was more widely spread across the EU Member States, with Germany recording the highest level of production (17.9 % of the EU-28 total), while Poland, France, the Netherlands and the United Kingdom each accounted for between 13.2 % and 10.6 %.
In the EU-28, the most important vegetables in terms of the level of production were tomatoes, onions and carrots. The total production of tomatoes among the EU Member States was 14.9 million tonnes in 2013. Italy and Spain were the largest producers among the EU Member States, with a combined share of 60.3 % of the EU-28's production.
The most important fruits in terms of the level of production in the EU-28 were apples and oranges. The production of apples was common across most of the EU, although there was a particularly high level of production in several eastern EU Member States, notably in Poland. Indeed, Poland was the leading producer of apples in the EU-28 in 2013 and accounted for just over one quarter (25.6 %) of the EU-28’s output. Italy and France were the second and third largest producers of apples with shares of 18.5 % and 17.4 % respectively.
Meat and milk
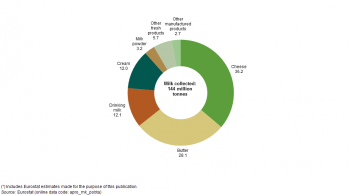
Dairy production has a diverse structure across the EU Member States, in terms of farm and dairy herd sizes, as well as milk yields. Figure 5 shows that 36.2 % of the whole milk that was utilised in the EU-28 in 2013 was converted into cheese, with butter accounting for the next highest proportion (28.1 %); almost one quarter of the whole milk utilised in the EU-28 was used either for drinking milk (12.1 %) or for cream (12.0 %).
Table 2 summarises a range of different agricultural products from animals. The total collection of cows’ milk in the EU-28 in 2013 amounted to an estimated 141 million tonnes. Germany and France recorded the highest quantities of cows’ milk collected in 2013 and they also accounted for the highest levels of production for butter and cheese; together they contributed between 38 % and 46 % of the EU-28’s total production for each of these three dairy products.
The principal meat product in the EU-28 was pig meat (21.9 million tonnes in 2013), with the weight of production almost three times as high as that for beef / veal (7.3 million tonnes); the production of sheep meat in the EU-28 was relatively modest (0.7 million tonnes).
A quarter (24.9 % or almost 5.5 million tonnes) of the EU-28’s pig meat production in 2013 came from Germany, the next highest contributions being recorded for Spain (15.6 %) and France (8.8 %), while the 7.7 % share for Poland and the 7.2 % share for Denmark were also notable. Just under one fifth (19.4 % or 1.4 million tonnes) of the beef / veal produced in the EU-28 originated from France in 2013, with Germany (15.2 %), Italy (11.8 %) and the United Kingdom (11.7 %) the next largest producers; Ireland reported a relatively high share (7.1 %) of the EU-28’s production of bovine meat. The United Kingdom dominated the production of sheep meat (almost 0.3 million tonnes), with a 40.7 % share of the EU-28 total in 2013, followed by Spain (16.6 %), France (11.2 %), Greece (8.5 %) and Ireland (8.1 %).
Data sources and availability
Annual statistics on the production of a range of specific crops are covered by Council Regulations, although the data presented for fruit and vegetables are collected under various informal agreements with the EU Member States.
The statistics on crop production relate to harvested production. Agricultural production of crops is synonymous with harvested production and includes marketed quantities, as well as quantities consumed directly on the farm, losses and waste on the agricultural holding, and losses during transport, storage and packaging.
Statistics on milk and meat products are compiled according to Community legislation. Milk production covers farm production of milk from cows, sheep, goats and buffaloes. A distinction is made between milk collected by dairies and milk production on the farm. Milk collection is only a part of the total use of milk production on the farm, the remainder generally includes own consumption, direct sale, processing on the farm and animal feed.
Meat production is based on the activity of slaughterhouses regarding meat fit for human consumption. The carcass weight is the weight of the slaughtered animal’s cold body and the precise definition varies according to the animal under consideration.
Context
Information on agricultural products may be used to analyse developments within agricultural markets in order to help distinguish between cycles and changing production patterns; these statistics can also be used to study how markets respond to policy actions. Agricultural product data also provides supply side information, furthering understanding as regards price developments which are of particular interest to agricultural commodity traders and policy analysts.
In October 2007, the Council adopted legislation to establish a single common market organisation for agricultural products (Regulation 1234/2007). This was designed to reduce the volume of legislation in the farming sector, to improve legislative transparency, and to make agricultural policy more easily accessible. Between the start of 2008 and the start of 2009, the single common market organisation replaced 21 individual markets for a variety of different products such as fruit and vegetables, cereals, meats, eggs, dairy products, sugar or wine. Widespread reforms of the common agricultural policy (CAP) took place in 2003, 2008 and 2013. The December 2013 reforms comprise four Regulations, including Regulation 1308/2013 which concerns measures linked to agricultural products.
See also
Further Eurostat information
Publications
- Agriculture, forestry and fishery statistics — 2013 edition
- Agriculture, fishery and forestry statistics — Main results — 2010–11 — 2012 edition
Main tables
- Agriculture (t_agri), see:
- Agricultural production (t_apro)
- Crops products (t_apro_cp)
- Milk and milk products (t_apro_mk)
- Livestock and meat (t_apro_mt)
- Regional Agriculture Statistics (t_agr_r)
Database
- Agriculture (agri), see:
- Agricultural production (apro)
- Crops products (apro_cp)
- Poultry farming (apro_ec)
- Milk and milk products (apro_mk)
- Livestock and meat (apro_mt)
Dedicated section
Methodology / Metadata
- Crops products: areas and production (ESMS metadata file — apro_cpp_esms)
- Crops products: supply balance sheets (ESMS metadata file — apro_cpb_esms)
- Livestock and meat (ESMS metadata file — apro_mt_esms)
Source data for tables and figures (MS Excel)
Other information
- Crop statistics are governed by:
- Regulation 837/90 on the statistical information to be supplied by the Member States on cereals production;
- Regulation 959/93 on statistical information on crop products other than cereals;
- Regulation 543/2009 concerning crop statistics.
- Milk statistics are governed by:
- Directive 96/16/EC of 19 March 1996 on statistical surveys of milk and milk products;
- Directive 2003/107/EC of 5 December 2003 amending Council Directive 96/16/EC.
- Livestock and meat statistics are governed by:
- Regulation 1165/2008 of 19 November 2008 concerning livestock and meat statistics and repealing Council Directives 93/23/EEC, 93/24/EEC and 93/25/EEC.
External links
- European Commission — Agriculture and Rural Development — EU agricultural product quality policy
- European Commission — Agriculture and Rural Development — Simplification of the CAP


