Archive:Housing statistics
- Data from September 2009, most recent data: Further Eurostat information, Database.
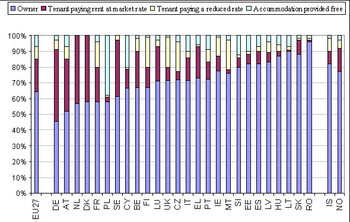
Questions of social housing, homelessness or integration play an important role within the social policy agenda. The charter of fundamental rights stipulates in Article II-94 that ‘in order to combat social exclusion and poverty, the Union recognises and respects the right to social and housing assistance so as to ensure a decent existence for all those who lack sufficient resources, in accordance with Community law and national laws and practices’.
However, the EU does not have any responsibilities in respect of housing; rather, national governments have the duty to develop their own housing policies. Many countries face similar challenges: for example, how to renew housing stocks, how to plan and combat urban sprawl, how to promote sustainable development, how to help young and disadvantage groups to get on the housing ladder, or how to promote energy efficiency among house-owners. The social and economic cost of the absence of decent housing is generally accepted to compromise the efficiency of a country or region. Indeed, decent housing, at an affordable price in a safe environment is likely to alleviate poverty and social exclusion.
Main statistical findings
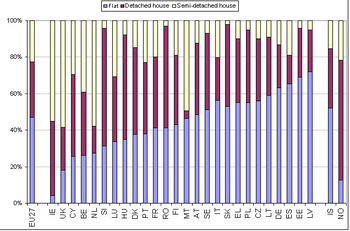
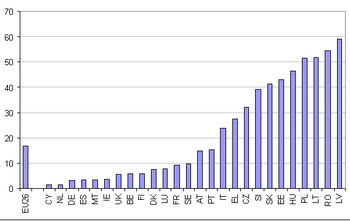
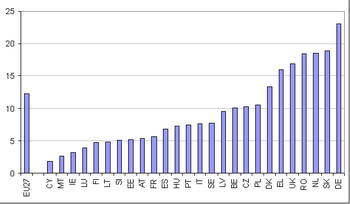
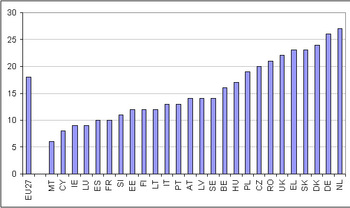
The average number of persons living in a household in the EU-27 was 2.4 in 2007, although among the Member States this average ranged from a low of just over two persons per household in Germany to an average of three persons in Malta. Overcrowding depends not only upon the number of persons in a household but also the number of rooms in the dwelling; overcrowding was recorded for 17 % of all households in the EU-27 in 2007. However, it was relatively common among the central and eastern Member States that have joined the EU since 2004 and, to a lesser extent, Greece, Italy, Portugal and Austria. Between one fifth and one third of the populations of Lithuania, Latvia, Poland and Romania lived in severe housing deprivation.
There were notable differences between Member States in housing ownership status in 2007. Less than 5 % of households in Bulgaria, Poland, Lithuania and Romania rented their own house/flat in 2007 compared with closer to one third of households in Sweden, Denmark, the Netherlands, France and Austria. It is difficult to pinpoint the reasons for such differences, as the distribution of households may be related to a range of factors, including: the degree of urbanisation, the quality of accommodation, or the supply of new or renovated housing.
Data sources and availability
The data used in this section are primarily derived from micro-data from EU statistics on income and living conditions (EU-SILC). The reference population is all private households and their current members residing in the territory of the Member State at the time of data collection; persons living in collective households and in institutions are generally excluded from the target population.
A household is defined in terms of shared household expenses. If household expenses are not shared, then the person(s) constitute separate household(s) at the same address. A household may comprise either one person living alone or a group of people, not necessarily related, living at the same address with common housekeeping. The average number of persons per private household is the number of persons living in private households divided by the number of private households; collective households such as boarding houses, halls of residence and hospitals and the persons living in them are excluded.
Households are considered as overcrowded if the dwelling in which they live does not comprise a minimum number of rooms, established upon the basis of: one room for the household; one room for each couple; one room for each single person aged 18 or more; one room for two single people of the same sex between 12 and 17 years of age; one room for each single person of a different sex between 12 and 17 years of age; and one room for two people under 12 years of age.
Housing deprivation is a measure of poor amenities and is calculated by referring to those households with a leaking roof, no bath/shower and no indoor toilet, or a dwelling that is considered too dark. Severe housing deprivation is defined as households that are overcrowded, while also exhibiting at least one of the housing deprivation measures.
Context
At the Laeken European Council in December 2001, European heads of state and government endorsed a first set of common statistical indicators of social exclusion and poverty that are subject to regular revisions by the Indicators Sub-group (ISG) of the Social Protection Committee (SPC). These indicators are an essential element in the 'open method of coordination (OMC)' to monitor the progress of Member States in the fight against poverty and social exclusion. The list was updated in 2006 and 2008.
The 2001 SPC report on indicators to monitor the social inclusion process recommended "improving comparable information and reporting on decency of housing, housing costs and homelessness". The 2006 SPC report on indicators reserved a slot in the social inclusion portfolio for housing.
To provide underlying data for indicators, the EU Statistics on income and living conditions ( EU-SILC) was implemented. The EU-SILC, organized under a Framework Regulation (1177/2003) of the European Parliament and the Council, is now the basis for statistics on income and living conditions, in particular for common social inclusion indicators.
Further Eurostat information
Database
- Income and living conditions (ilc)
- Living conditions (ilc_lv)
- Housing conditions (ilc_lvho)
- Distribution of population by degree of urbanisation, dwelling type and income group (Source: SILC) (ilc_lvho01)
- Distribution of population by tenure status, type of household and income group (Source: SILC) (ilc_lvho02)
- Average number of rooms per person by tenure status and dwelling type from 2003 (Source: SILC) (ilc_lvho03)
- Average number of rooms per person by tenure status and dwelling type until 2001 (Source: ECHP) (ilc_lvho03h)
- Average number of rooms per person by type of household and income group from 2003 (Source: SILC) (ilc_lvho04)
- Average number of rooms per person by type of household and income group until 2001 (Source: ECHP) (ilc_lvho04h)
- Housing conditions (ilc_lvho)
- Material deprivation (ilc_md)
- Economic strain linked to dwelling (ilc_mded)
- Share of housing costs in disposable household income, by type of household and income group (Source: SILC) (ilc_mded01)
- Share of rent related to occupied dwelling in disposable household income, by type of household and income group (Source: SILC) (ilc_mded02)
- Total housing costs in pps (Source: SILC) (ilc_mded03)
- Financial burden of the total housing cost (Source: SILC) (ilc_mded04)
- Financial burden of the repayment of debts from hire purchases or loans (Source: SILC) (ilc_mded05)
- Economic strain linked to dwelling (ilc_mded)
- Living conditions (ilc_lv)
Dedicated section
- Household Budget Surveys
- Income, Social Inclusion and Living Conditions
Other information
- The continuity of indicators during the transition between ECHP and EU-SILC
- The production of data on homelessness and housing deprivation in the European Union: survey and proposals
- Regulation 1177/2003 of 16 June 2003 concerning Community statistics on income and living conditions (EU-SILC)
- Regulation 1553/2005 of 7 September 2005 amending Regulation 1177/2003 concerning Community statistics on income and living conditions (EU-SILC)
- Regulation 1791/2006 of 20 November 2006 adapting certain Regulations and Decisions in the fields of ... statistics, ..., by reason of the accession of Bulgaria and Romania