- Data from August 2011, most recent data: Further Eurostat information, Main tables and Database.
This article takes a look at one example of a waste-related environmental impact, the emission of greenhouse gases (GHG) in the European Union (EU) and some EFTA and candidate countries as a result of waste disposal operations such as landfilling, incineration without energy recovery and other treatment operations like composting. It is widely recognised that managing waste has a range of potential environmental impacts and as Eurostat collects and collates basic data on waste generation and treatment, the emission of greenhouse gases can be analysed in some detail.
The data were obtained from the European Environment Agency (EEA) database or EEA reports prepared for the United Nations Framework Convention on Climate Change (UNFCCC). Please note that waste nomenclatures may differ: incineration in this context only covers incineration without energy recovery.
Main statistical findings
Under the Kyoto Protocol six greenhouse gases are identified. These include carbon dioxide (CO2), methane (CH4) and nitrous oxide (N2O), along with three fluorinated gases. More information is available from the European Commission Directorate General Climate Action and the EEA. Data for other countries can be found on the UNFCCC website.
Relevance of the waste sector
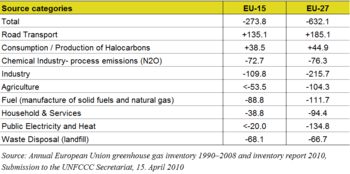
An overview of changes in GHG emissions by major sources of emissions is presented in Table 1. For the EU-15 the total reduction achieved in 2008 amounts to 274 million tonnes CO2-eq/year or 6.5 % since 1990 (when GHG emissions were 4 244.8 million tonnes CO2-eq/year). While some sources still show an increase in GHG emissions, for example the road transport sector, other categories are showing a decrease, such as chemical and other industrial processes, solid fuel manufacture, gas and waste disposal.
The emissions from waste disposal are forecast by the EEA to further decrease in the future, despite the overall quantity of waste being generated steadily increasing. This changing trend is caused by the decrease in waste being landfilled in the EU. The waste sector contributes a quarter of the avoided GHG emissions, which amounts to 1.6 % of the total emissions. The waste management sector is therefore a very relevant sector due to the reduction in reliance upon landfill for residual disposal - a change that has been significantly influenced by EU waste legislation (see Outlook below).
Waste disposal operations
Emissions from solid waste disposal are split into 3 subcategories in the official reporting to the Secretariat of the United Nations Framework Convention on Climate Change (UNFCCC):
- Sector 6A - landfill;
- Sector 6C - incineration without energy recovery;
- Sector 6D - other treatments such as fermentation / composting.
It should be noted that carbon dioxide (CO2) emissions from organic (biogenic) carbon are not counted for but methane (CH4) emissions from biogenic carbon are.
Sector 6A - Landfill
The emissions from landfill sites are not measured but modelled, as detailed in the IPCC guidelines on waste. Methane is emitted from the landfill sites as fugitive emissions. The models used take into account the local weather conditions (humidity and climate) which have a high impact on the overall process. A simple model may divide the landfill process into three steps:
- during the initial active phase the degradable portion of the waste landfilled undergoes both aerobic and anaerobic degradation; as the landfill is not sealed during this phase both methane and biogenic carbon dioxide are emitted;
- having sealed the landfill the “methanogenic” phase takes place and the landfill gas contains greater quantities of methane than in the first phase;
- finally, as different types of carbon degrade at different rates (whilst sugars and fat degrade relatively quickly, cellulose degrades more slowly) and there is very little degradation of lignin products (contained in wood) in landfill, these materials may not degrade appreciably even over much longer time periods.
Stopping landfill today, therefore, will not put an end to methane emissions immediately and as such, but a slow decline in methane emissions originating from old landfill sites will become apparent. A key measure to mitigate methane emissions is the capture of the methane, especially during the second phase, and subsequent combustion of this methane to produce energy. Methane is combusted to carbon dioxide which is not accounted for in the inventory (organic carbon). In the United Nations Framework Convention on Climate Change (UNFCCC) reporting system, the methane emitted to the atmosphere is accounted for. However, the benefits stemming from the energy production from methane gas capture at landfills and the utilisation of this gas are accounted for in the energy sector, not the waste sector.
Sector 6C - Waste incineration without energy recovery
During waste incineration the fossil carbon contents from, for example oil products such as plastics, are emitted and accounted for. Biogenic carbon from paper waste (e.g. newspapers), wood and biowaste is also emitted but not accounted for. Other types of GHG emissions are negligible. Emissions from waste incineration with energy recovery are allocated under the category “energy” and not “waste”. Therefore, if energy recovery is performed the information on GHG emissions from incineration with energy recovery can not be identified. As result a full comparison between the different waste treatment operations is not possible because the benefits from improved waste treatment, such as incineration with energy recovery (and the subsequent avoidance of equivalent energy production from e.g. fossil fuels) are not fully demonstrated within the waste sector of the UNFCCC reporting.
Sector 6D - Other waste disposal / treatment
Other treatment options include composting or fermentation of biowaste and/or mixed waste, as well as recycling or pre-treatment of waste for landfill. These processes may have lesser methane or nitrous oxide emissions.
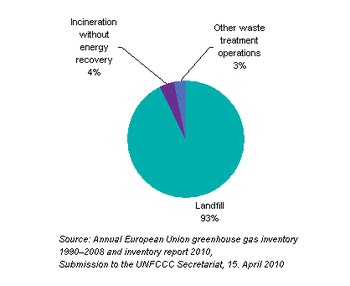
The estimated share of the greenhouse gas emissions of the three disposal / treatment operations is shown in Figure 1 as a pie chart for 2008 data.
It can be seen that 93 % of the greenhouse gas emissions from waste management come from the landfill sector, whilst the two other operations only contribute 7 % of the total emissions. However, it should be noted that in the incineration section only those facilities without energy recovery are included, hence only a small share of incineration emissions are presented in the graph. Therefore it is reasonable to focus on landfill.
Time series of GHG emissions from the waste sector
Products from fossil oil such as plastics are assumed not to degrade in a landfill site due to the long length of the degradation process, which extends the observation time frame for global warming (usually 100 years). Organic carbon may decay in the presence of oxygen (aerobically) to carbon dioxide or decompose in the absence of oxygen (anaerobically) to carbon dioxide and methane. As methane has a higher impact factor than carbon dioxide, the methane emissions are accounted for as anthropogenic emissions.
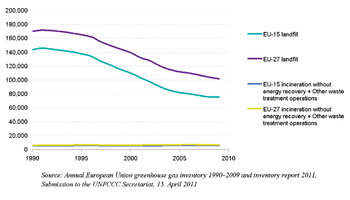
Figure 2 shows the time series for greenhouse gas emissions from 1990 to 2009. The two smaller subcategories (incineration without energy recovery and other treatments) are summarised. The data is shown for EU-15 and EU-27.
In the early 90’s the greenhouse gas emissions from landfill were decreasing slowly. Between 1995 and 2005 the rate of reduction of greenhouse gas emissions was high, but since 2005 there has been slower progress in the reduction of emissions. During this time period the greenhouse gas emissions in EU-15 for the sum of incineration without energy recovery and other treatment is nearly stable at approximately 5.5 million tonnes/a. The greenhouse gas emission from incineration without energy recovery is declining whereas the emissions from other treatment activities are rising. The development of the GHG emissions in the landfill sector for EU-15 countries is shown in Figure 3.
The emissions for the EU-15 have reduced by 50 % from 1990 to 2008. Spain, Greece and Portugal show higher GHG emissions in 2008 than in 1990. In 2008, Spain, Finland, the United Kingdom, the Netherlands and Portugal exhibit significantly higher GHG emissions than the EU-15 average. The per-capita GHG emissions of Belgium, Germany, France and Luxembourg are just half the EU-15 average in 2008.
Figure 4 gives an overview over the GHG emissions from landfill in 2008 for the non EU-15 Member States and some EFTA and candidate countries.
The GHG emissions from landfill in the new EU Member States are in general (with the exception of Poland) higher than the EU-15 average. In total, the EU-27 average differs only slightly from the EU-15 average. Many of the new Member States have per-capita emissions which are in the order of the EU-15 average. Only Bulgaria, Cyprus, Estonia, Malta and the Slovak Republic are significantly above the average. Switzerland and Croatia also exhibit per capita GHG emissions well below the EU-15 average, while Iceland and Turkey show significantly higher emissions per capita.
Outlook
With the introduction of Landfill Directive 1999/31/EC the European Union has established a powerful tool to reduce the amount of biodegradable municipal waste going to landfill. It is this biodegradable fraction of the waste which is responsible for the methane emissions. The Directive requires the collection and incineration of landfill gas and additionally the monitoring of landfill gas emissions. Flaring is also an option for older landfills, as it neutralises the methane emissions (biogenic CO2 is not accounted for, however, methane is).
Article 5 of the Directive sets targets for reduction of the amount of biodegradable municipal waste sent to landfill. On the basis of the amount of biodegradable municipal waste generated in 1995 the amount of biodegradable waste allowed to be send to landfill is limited to:
- 75 % in 2006;
- 50 % in 2009;
- 35 % in 2016.
Member States which landfilled more than 80 % of their municipal waste in the year 1995 may postpone the attainment of these targets by no more than 4 years. Of the EU-15 countries, the United Kingdom, Ireland and Greece have received a derogation period. From the new Member States the derogation does not apply to Slovenia and Hungary.
Furthermore, Member States can follow different strategies to reduce the amount of biodegradable municipal waste going to landfill by:
- recycling of biodegradable waste - paper/ cardboard, wood;
- recycling of organic waste via composting;
- recovery of biodegradable waste via fermentation, anaerobic digestion, pyrolysis;
- incineration.
From the existing Eurostat data it is not possible to track the reduction in biodegradable municipal waste, as only the total amount of municipal waste sent to landfill is monitored. The definition of biodegradable waste, the national strategies for reduction of landfill and a limited set of data are published in a report on the implementation of the Landfill Directive. A summary and update on biodegradable municipal waste is given by the EEA, from where Figure 5 has been taken. The data is also discussed in the State of the environment report No 5/2010 on Material resources and waste.
Twelve of the EU-15 Member States report a share below the 2006 target of 75 %. The United Kingdom reports a slightly higher, and Ireland and Greece a substantially higher share. All three countries have received a derogation of up to 4 years to achieve the target. From the 12 new Member States, Hungary, Estonia and Slovenia have met the target. The other new Member States have received a derogation status. Finland has fulfilled the 2009 target (50 %) and 7 EU-15 countries and Switzerland have already met the 2016 targets of landfill below 35 %.
Data sources and availability
The official greenhouse gas emission inventories for the EU and for the individual Member States are submitted to the United Nations Framework Convention on Climate Change (UNFCCC) in the following two parts:
- Common reporting format (CRF) – a series of standardized data tables containing mainly numerical information and submitted electronically;
- National inventory report (NIR) – a comprehensive description of the methodologies used in compiling the inventory, the data sources, the institutional structures and quality assurance and control procedures.
The report and data are available 15 months after the reporting year has ended. Data for other countries are also documented at the UNFCCC Secretariat.
The EU reports and condensed tables are also available at the EEA. The EEA prepares a combined database (as GHG data viewer).
More information is available from the European Commission's Directorate General for Climate Action and the EEA.
Context
The Kyoto Protocol is an international agreement that includes legally binding GHG emissions targets for the industrialised countries. It aims to an overall reduction of at least 5 % from the 1990 levels by the period 2008-2012. The Protocol defined individual targets per country, however, the 15 States who were EU members (EU-15) when the Kyoto Protocol was adopted (1997), agreed to an 8 % reduction of its GHG emissions by 2008-2012 compared to 1990 and re-distributed this target under the burden-sharing agreement (Council Decision 2002/358/EC). Bulgaria, the Czech Republic, Estonia, Latvia, Lithuania, Romania, Slovakia and Slovenia took on that 8% target as well. Poland and Hungary will have to reduce emissions by 6%. There is no legal EU target for Cyprus and Malta.
The waste sector defined by the United Nations Framework Convention on Climate Change (UNFCCC) is different to, and also narrower than the way waste management is defined according to EU waste legislation and the EU waste statistics Regulation. This report follows the United Nations Framework Convention on Climate Change (UNFCCC) reporting system and classification.
Please note that the waste term “incineration” only refers to the term “incineration without energy recovery” in GHG accounting. Waste incineration with energy recovery is an energy process in GHG accounting and could not be isolated from other energy processes. Therefore the greenhouse gas emissions for “incineration” derived from the GHG reporting represents only a fraction of the processes “incineration with or without energy recovery” normally covered under waste legislation. The term “other” processes refers to pre-treatment processes like fermentation or composting.
If the entire spectrum of impacts, which are consequences of waste management operations, are to be investigated, a different approach is needed. This approach should take into account all emissions that are caused or avoided by waste treatment. Namely, the direct emissions from all waste treatment types should be accounted for independent of whether the treatment is recycling, incineration or landfilling. Moreover, the recovery of energy (incineration, landfill gas, anaerobic digestion plants) and materials (recycling, composting, anaerobic digestion) has as a consequence the avoidance of primary production of energy (e.g. from fossil fuels) and virgin materials (e.g. virgin paper, metals etc.) respectively. The avoided emissions should be accounted for in order to demonstrate the full effect of waste management within emissions inventory reporting. An example of this approach, which is based on life cycle thinking, applied on municipal solid waste in the EU can be seen in an EEA publication.
Further Eurostat information
Publications
- Generation and treatment of municipal waste - Statistics in focus 31/2011
- Driving forces behind EU-27 greenhouse gas emissions over the decade 1999-2008 - Statistics in focus 10/2011
- Environmental statistics and accounts in Europe - Statistical book 2010
- Waste opportunities - Past and future climate benefits from better municipal waste management in Europe - EEA Report 03/2011
- National Inventory Reports - UNFCCC 2011
- EEA’s State of the environment report 5/2010 - SOER 2010
Main tables
Database
Methodology / Metadata
- IPPC Guidelines
- Municipal waste by type of treatment (ESMS metadata file - tsien130_esms)
- Municipal waste generated (ESMS metadata file - tsien120_esms)
- Waste Statistics (ESMS metadata file - env_wasr_esms)
Source data for tables and figures (MS Excel)
External links
- European Commission - DG Climate Action
- European Environment Agency – Waste and material resources
- European Commission - DG Environment – Landfill of waste
See also
- Climate change - driving forces
- Climate change statistics
- Carbon dioxide emissions from final use
- End-of-life vehicle statistics
- Environment and economy
- Municipal waste statistics
- Packaging waste statistics
- Sustainable development - Climate change and energy
- Waste shipment statistics
- Waste statistics


