Tutorials
Log in
Statistics Explained
menu
search
search
Navigation
Main page
Statistical themes
Glossary
Categories
Statistics 4 beginners
Tutorials
Help
Eurostat home
Education corner
Online publications
Regional yearbook
Sustainable development
Full list
Tools
User contributions
Logs
View user groups
Special pages
search
Navigation
Main page
Statistical themes
Glossary
Categories
Statistics 4 beginners
Tutorials
Help
Eurostat home
Education corner
Online publications
Regional yearbook
Sustainable development
Full list
Tools
User contributions
Logs
View user groups
Special pages
Navigation
Main page
Statistical themes
Glossary
Categories
Statistics 4 beginners
Tutorials
Help
Eurostat home
Education corner
Online publications
Regional yearbook
Sustainable development
Full list
Tools
User contributions
Logs
View user groups
Special pages
Uploads by Mollmst
This special page shows all uploaded files.
File list
Items per page:
20
50
100
250
500
Search for media name:
Username:
Include old versions of files
Go
First page
Previous page
Next page
Last page
Date
Name
Thumbnail
Size
Description
Versions
12:05, 14 May 2024
SE article PEFA 2024-05-14.xlsx
(
file
)
9 MB
1
12:03, 14 May 2024
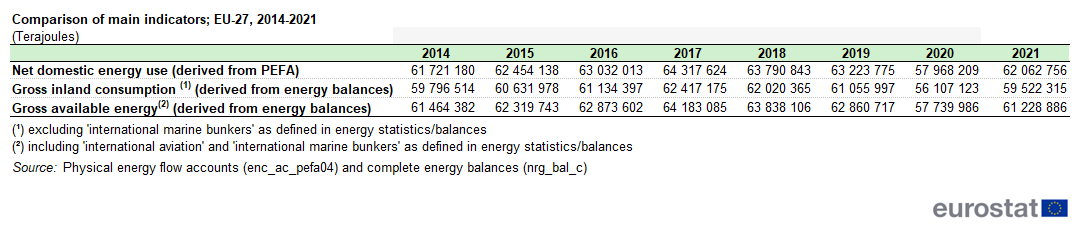
Comparison of main indicators; EU-27, 2014-2021 (Terajoules).png
(
file
)
26 KB
5
11:36, 14 May 2024
SE article PEFA 2024-05-14-new-style.xlsx
(
file
)
9 MB
1
09:33, 14 May 2024
Domestic energy footprints' of goods and services delivered to main categories of final uses European Union (EU-27), 2021, Terajoule.png
(
file
)
59 KB
1
17:20, 12 February 2024
Raw material equivalents 15 Februar 2024.xlsx
(
file
)
1.29 MB
1
17:20, 12 February 2024
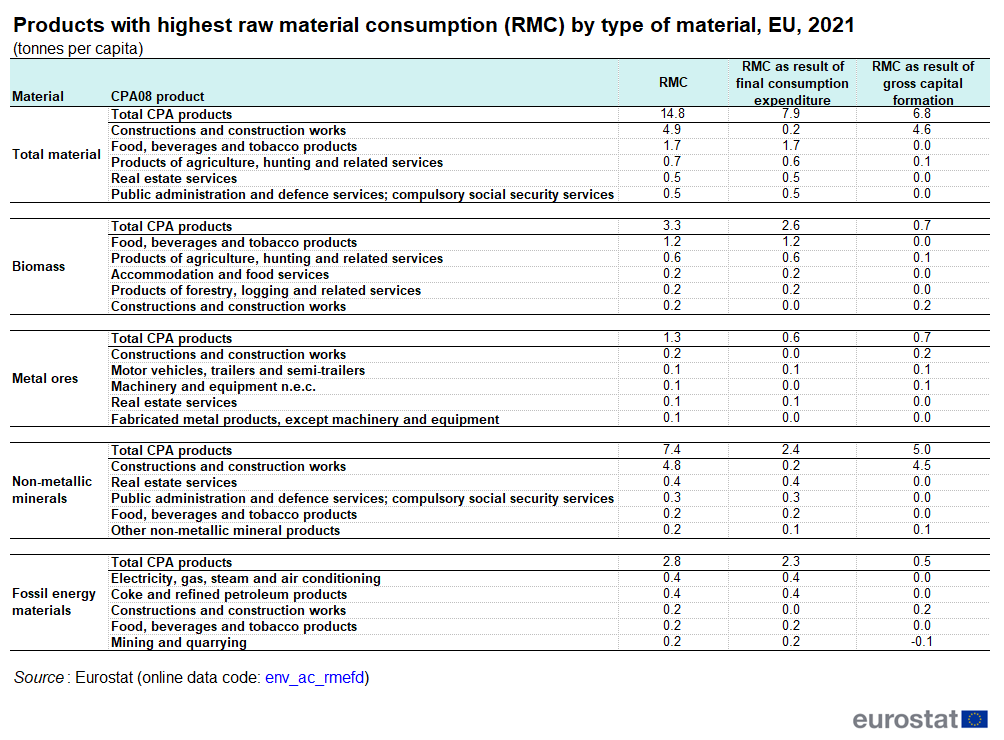
Products with highest raw material consumption (RMC) by type of material, EU, 2021.png
(
file
)
61 KB
1
17:19, 12 February 2024
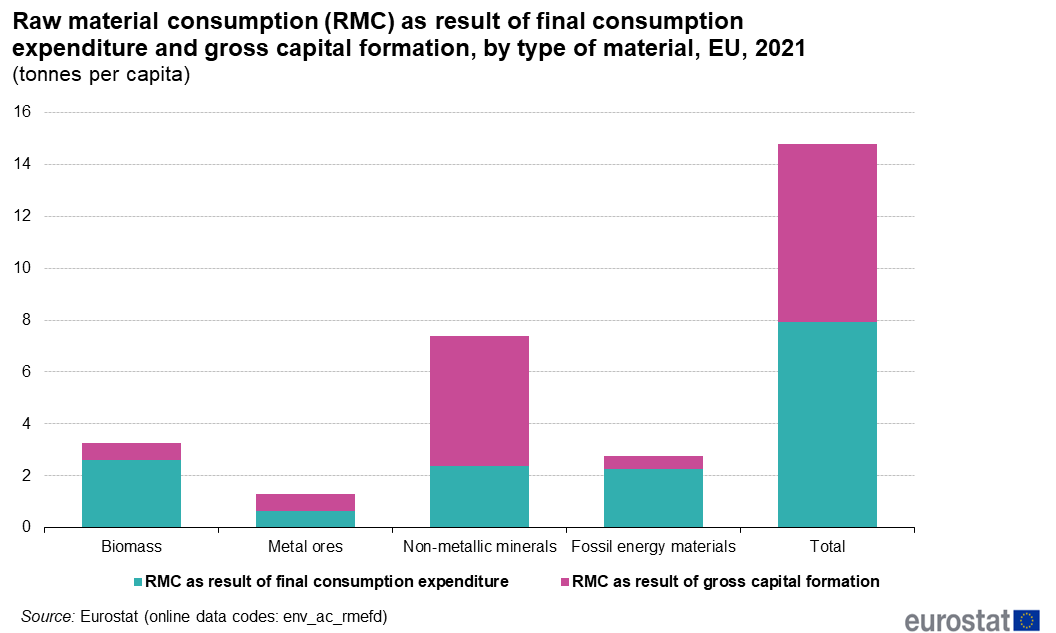
Raw material consumption (RMC) as result of final consumption expenditure and gross capital formation, by type of material, EU, 2021 (tonnes per capita).png
(
file
)
32 KB
1
17:18, 12 February 2024
Material extraction and consumption in EU and non-EU rest of the world, 2021 (Billion tonnes).png
(
file
)
22 KB
1
17:16, 12 February 2024
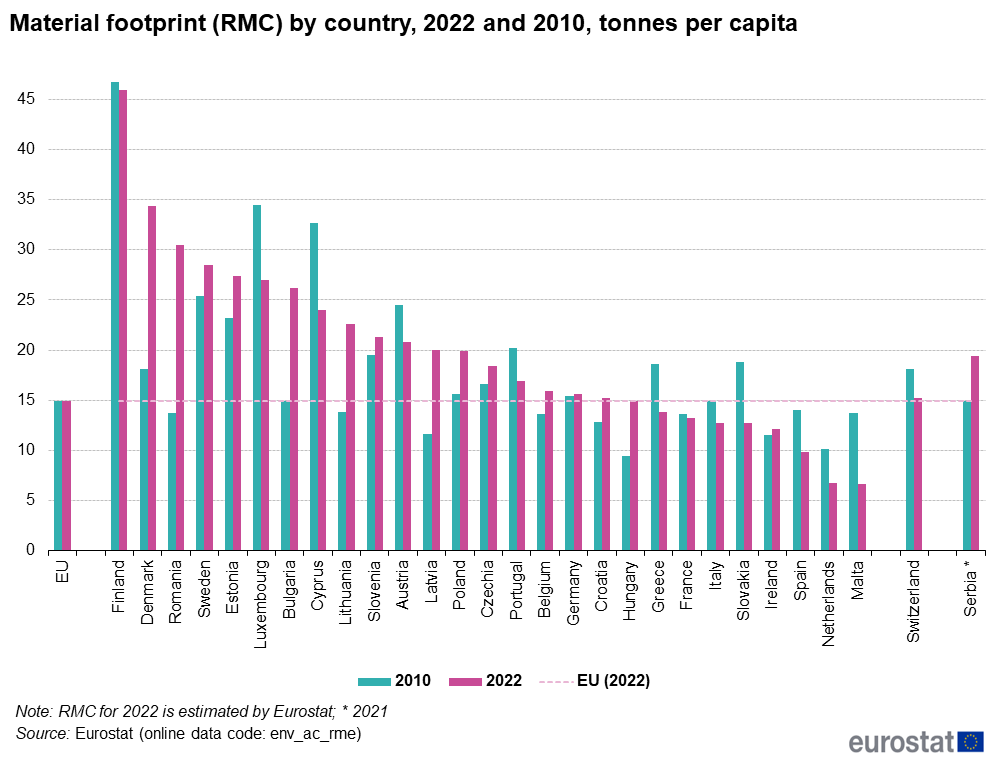
Material footprint (RMC) by country, 2022 and 2010, t per cap.png
(
file
)
63 KB
2
16:20, 12 February 2024
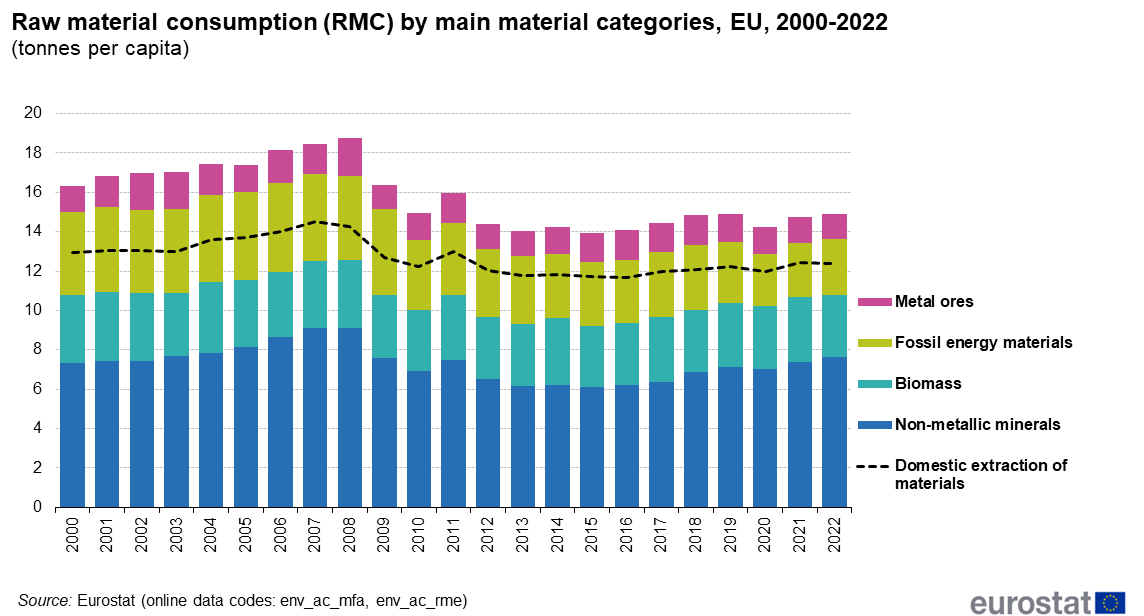
Raw material consumption (RMC) by main material categories, EU, 2000-2022 (t per cap).png
(
file
)
58 KB
2
13:03, 4 January 2024
SE article PEFA 2024-01-04.xlsx
(
file
)
8.98 MB
1
11:26, 17 August 2023
Greenhouse gas emission statistics - carbon footprints - tables and figures.xlsx
(
file
)
1.58 MB
1
11:25, 17 August 2023
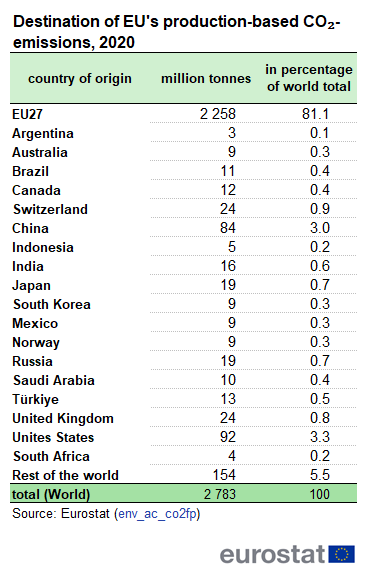
Destination of EU's production-based CO₂-emissions, 2020 country of origin.png
(
file
)
33 KB
1
11:25, 17 August 2023
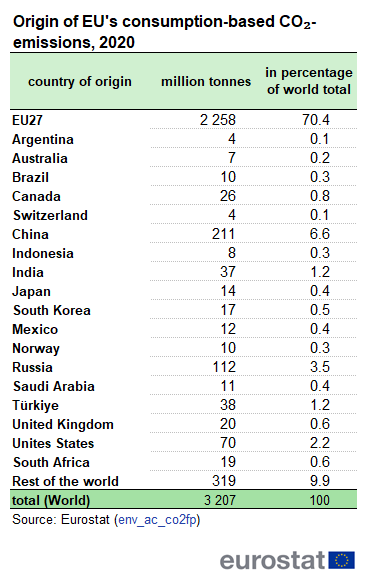
Origin of EU's consumption-based CO₂-emissions, 2020 country of origin.png
(
file
)
32 KB
1
11:24, 17 August 2023
Global CO₂-emissions - EU vis-a-vis the rest of the world, 2020, billion tonnes.png
(
file
)
27 KB
1
11:23, 17 August 2023
CO₂-emissions by perspective, EU 2010-2020, billion tonnes.png
(
file
)
43 KB
1
17:43, 11 August 2023
Water statistics, September 2023.xlsx
(
file
)
325 KB
1
17:34, 11 August 2023
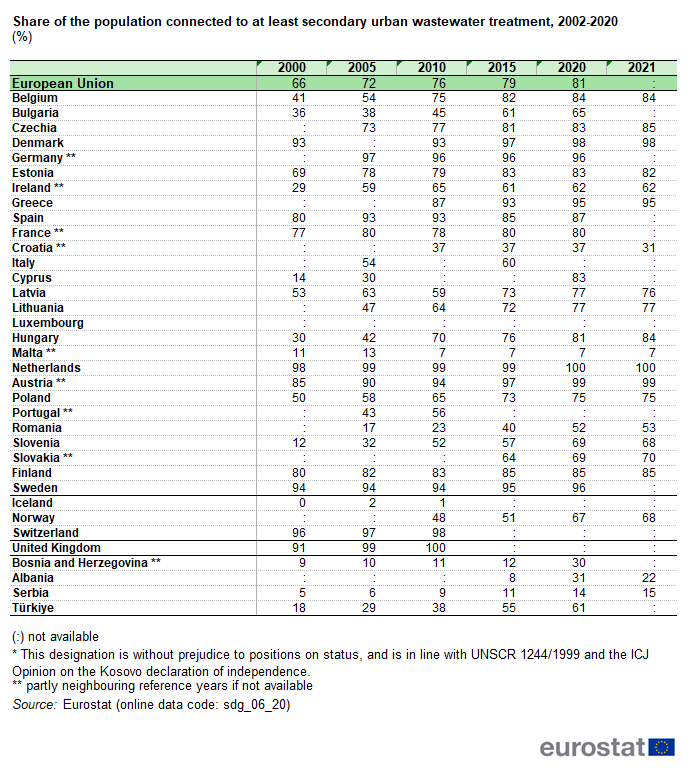
Tab 3 - Share of the population connected to at least secondary urban wastewater treatment, 2002-2020 (%).png
(
file
)
60 KB
1
17:26, 11 August 2023
Share of external inflow from neighbouring territories in renewable freshwater resources - long-term average (%).pnger resources - long-term average (%).png
(
file
)
75 KB
1
17:16, 11 August 2023
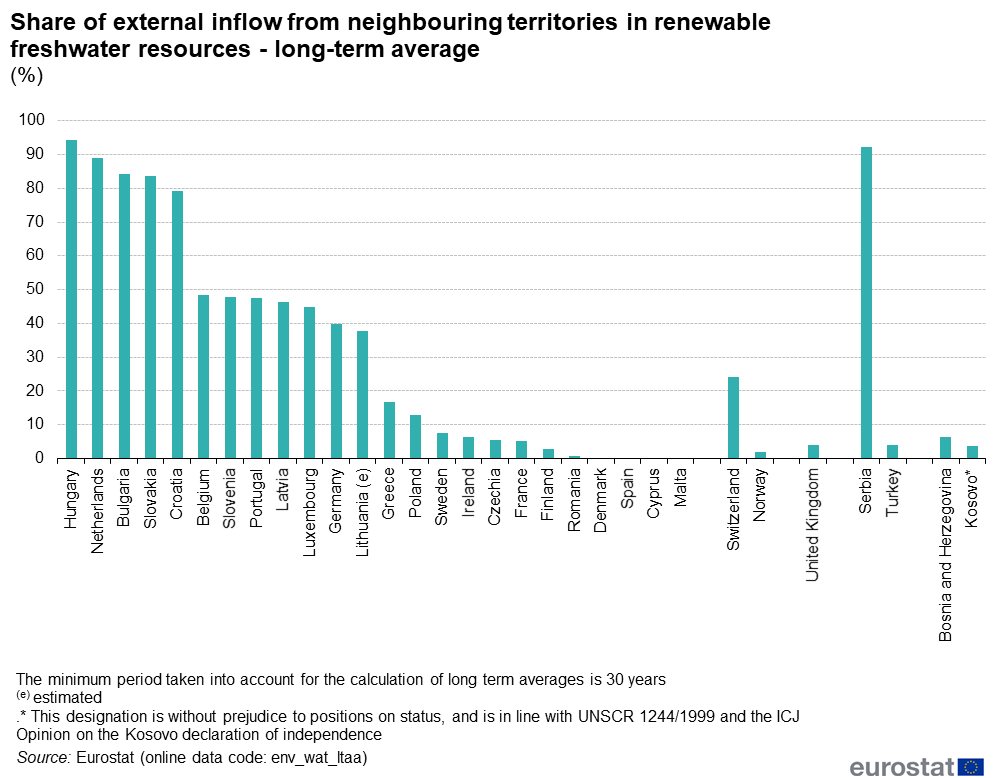
Fig 1 - Share of external inflow from neighbouring territories in renewable freshwater resources - long-term average (%).png
(
file
)
75 KB
1
18:01, 14 February 2023
Raw material equivalents 14 February 2023.xlsx
(
file
)
1.42 MB
1
17:57, 14 February 2023
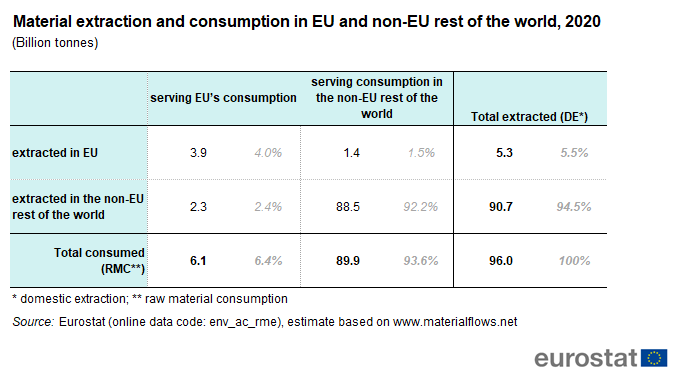
Material extraction and consumption in EU and non-EU rest of the world, 2020 (Billion tonnes).png
(
file
)
30 KB
1
13:57, 17 March 2022
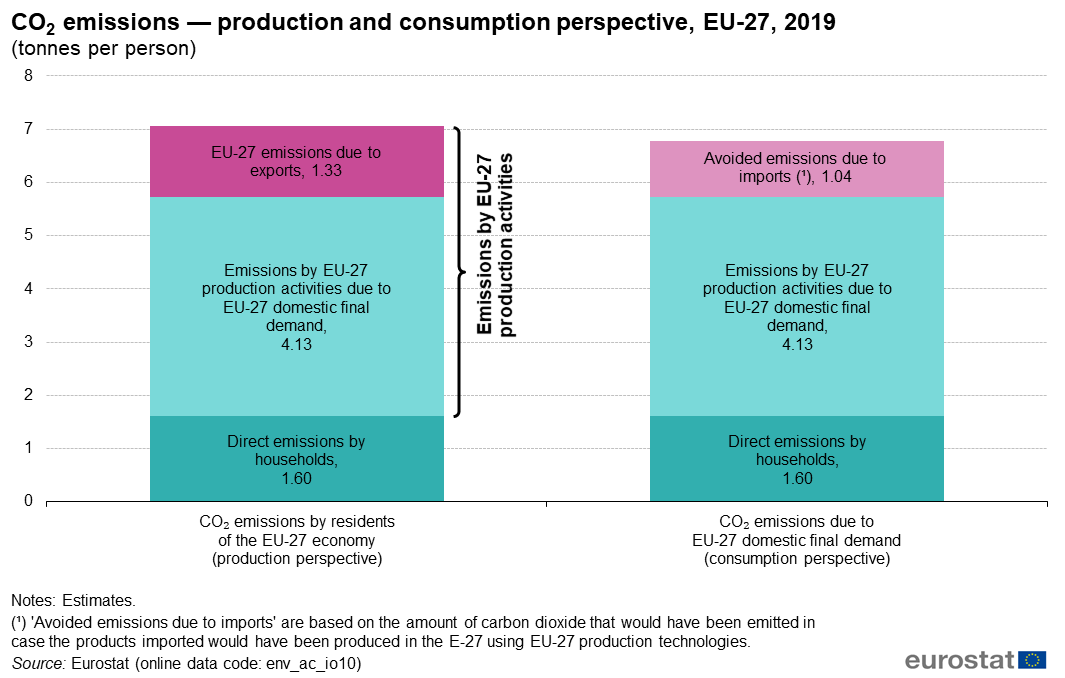
CO2 emissions — production and consumption perspective, EU-27, 2019.png
(
file
)
74 KB
3
17:27, 15 March 2022
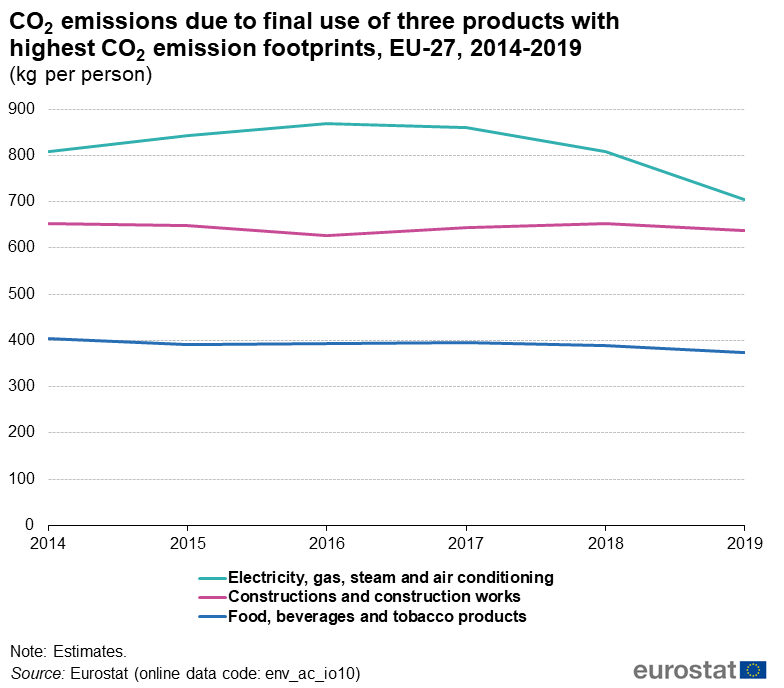
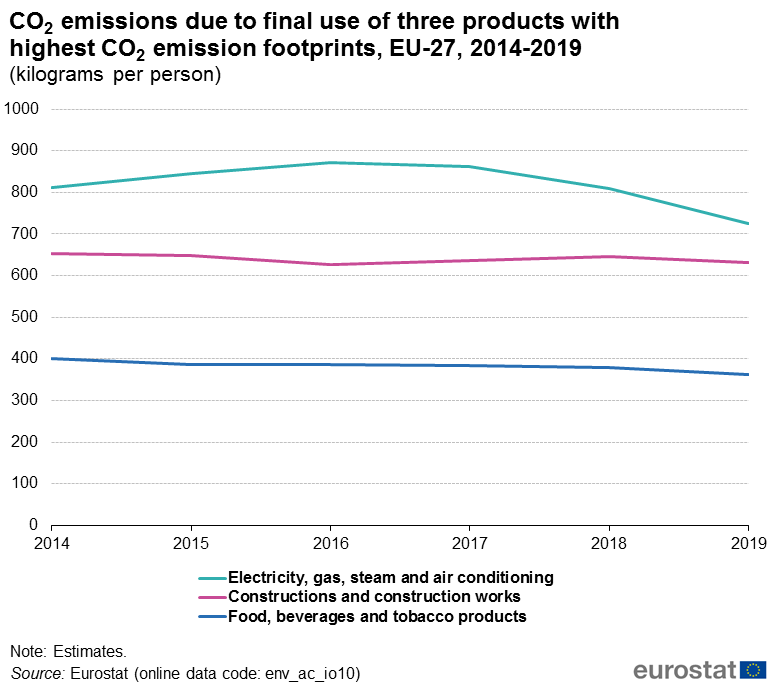
CO2 emissions due to final use of three products with highest CO2 emission footprints, EU-27, 2014-2019 (kg per person).png
(
file
)
42 KB
2
17:26, 15 March 2022
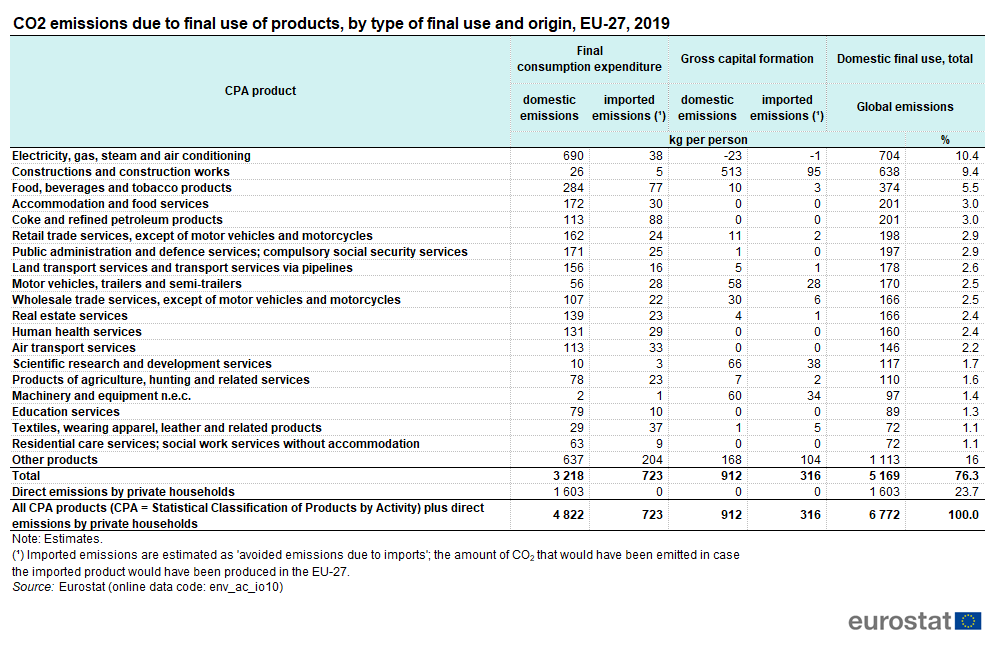
CO2 emissions due to final use of products, by type of final use and origin, EU-27, 2019.png
(
file
)
78 KB
3
17:25, 15 March 2022
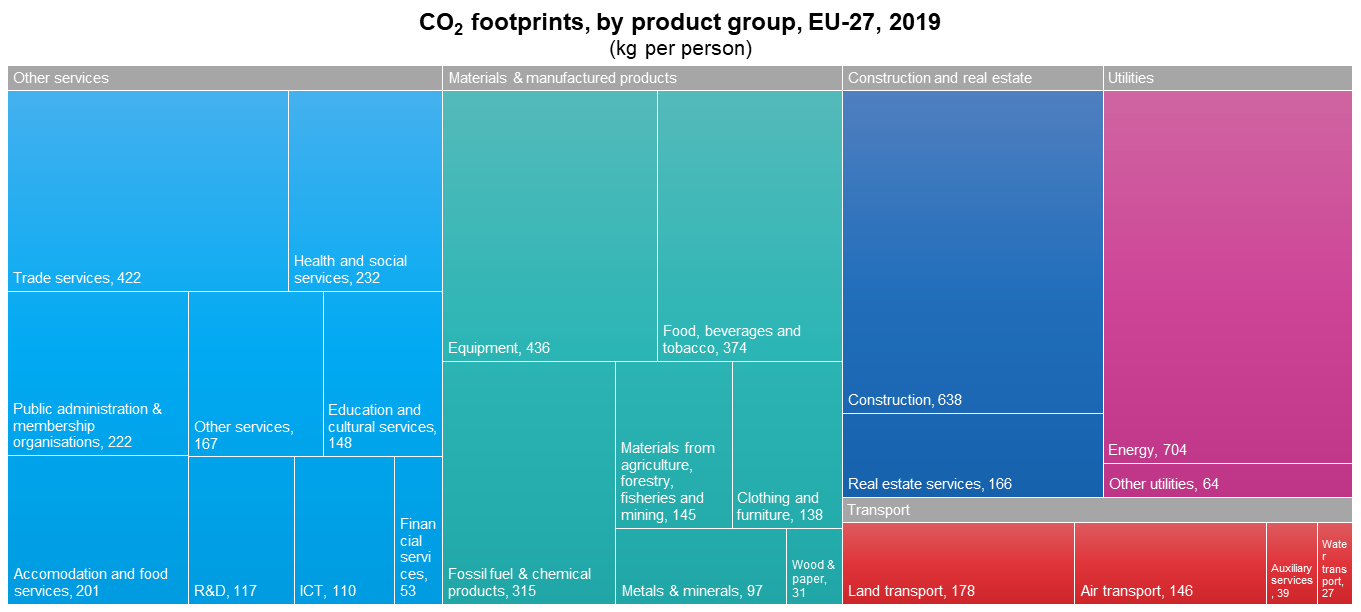
CO2 footprints, by product group, EU-27, 2019.png
(
file
)
77 KB
3
16:29, 15 March 2022
CO2 emissions in exports versus avoided emissions due to imports, EU-27, 2014-2019.png
(
file
)
42 KB
3
15:11, 9 March 2022
SE article PEFA data update 2022.xlsx
(
file
)
259 KB
1
15:03, 9 March 2022
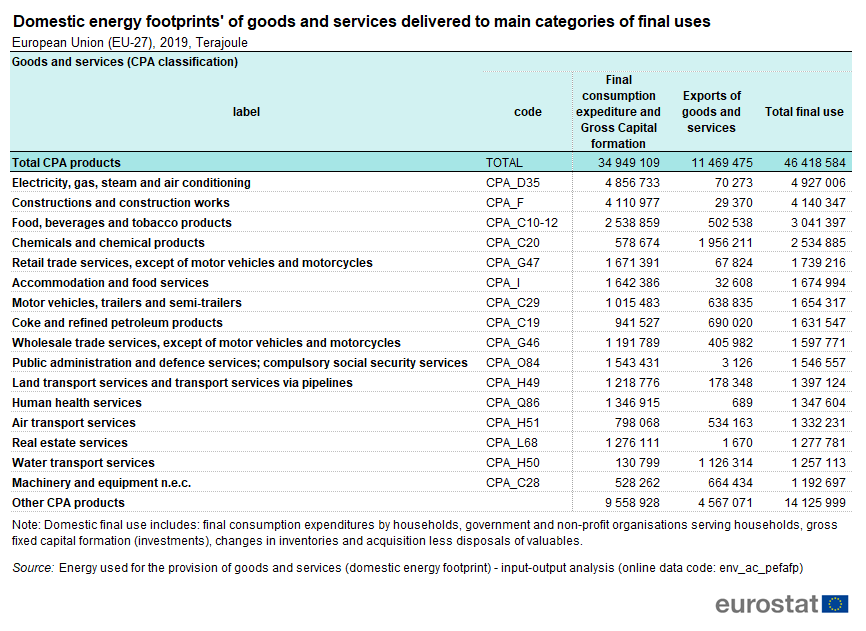
'Domestic energy footprints' of goods and services delivered to main categories of final uses European Union (EU-27), 2019, Terajoule.png
(
file
)
80 KB
1
15:01, 9 March 2022
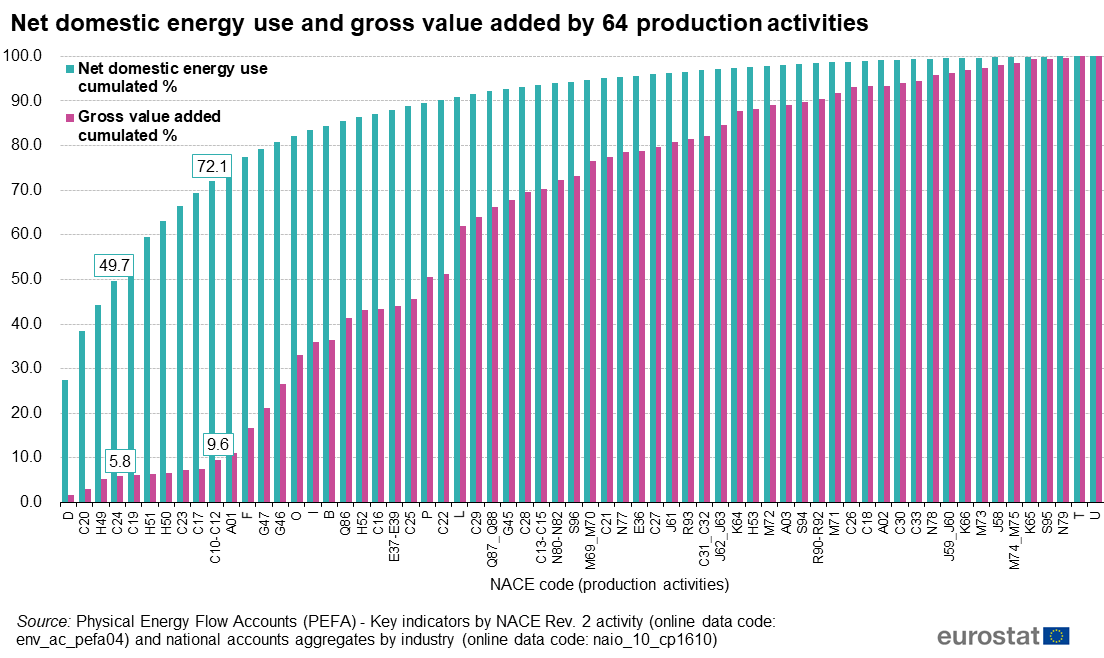
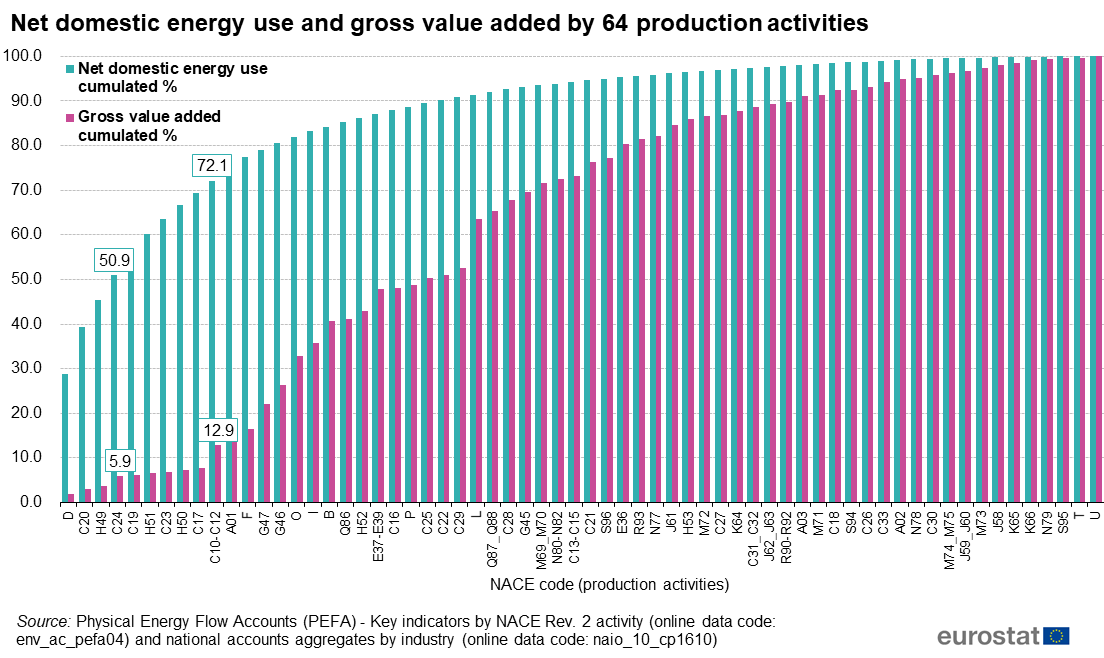
Net domestic energy use and gross value added by 64 production activities, 2019.png
(
file
)
118 KB
1
14:37, 9 March 2022
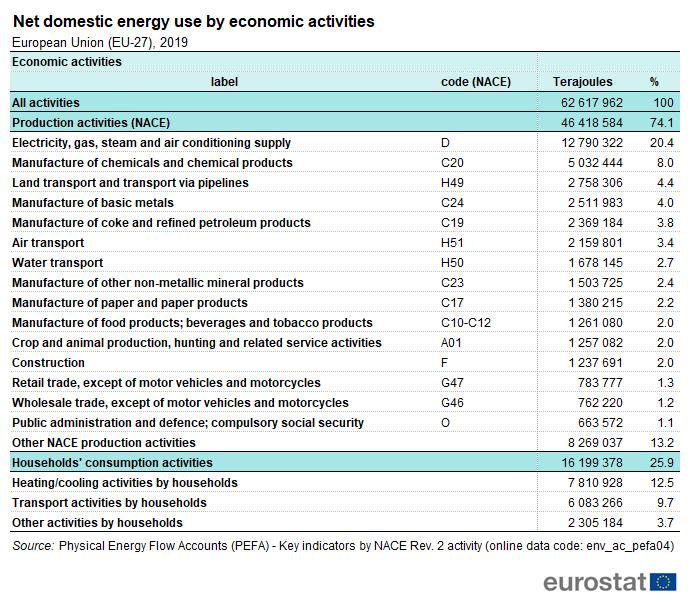
Net domestic energy use by economic activities European Union (EU-27), 2019.png
(
file
)
62 KB
1
18:45, 1 March 2021
Comparison of main indicators; EU-27 2014-2019 (Terajoules).png
(
file
)
31 KB
1
18:42, 1 March 2021
SE article SE article PEFA data 2021 03.xlsx
(
file
)
243 KB
1
18:40, 1 March 2021
Net domestic energy use and gross value added by 64 production activities, 2018.png
(
file
)
118 KB
1
18:06, 1 March 2021
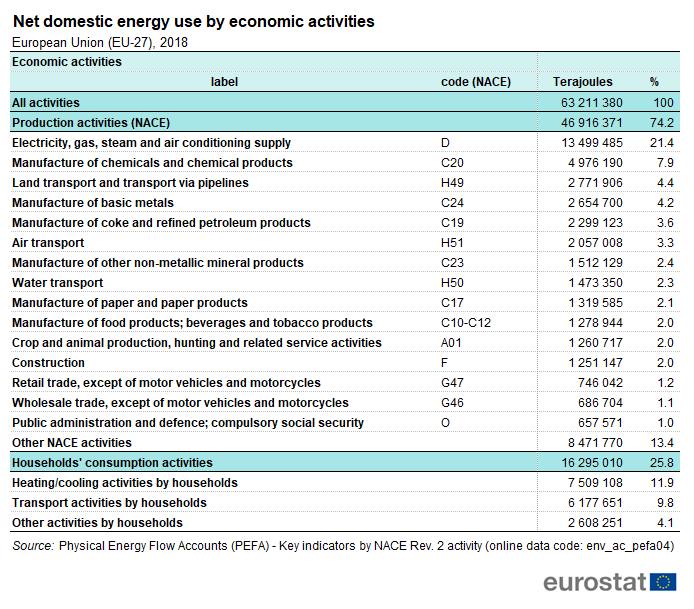
Net domestic energy use by economic activities European Union (EU-27), 2018.png
(
file
)
62 KB
1
16:48, 22 February 2021
CO2 emissions due to final use of three products with highest CO2 emission footprints, EU-27, 2014-2019 (kilograms per person).png
(
file
)
41 KB
1
08:56, 7 May 2020
SE article PEFA data.xls
(
file
)
204 KB
1
08:41, 7 May 2020
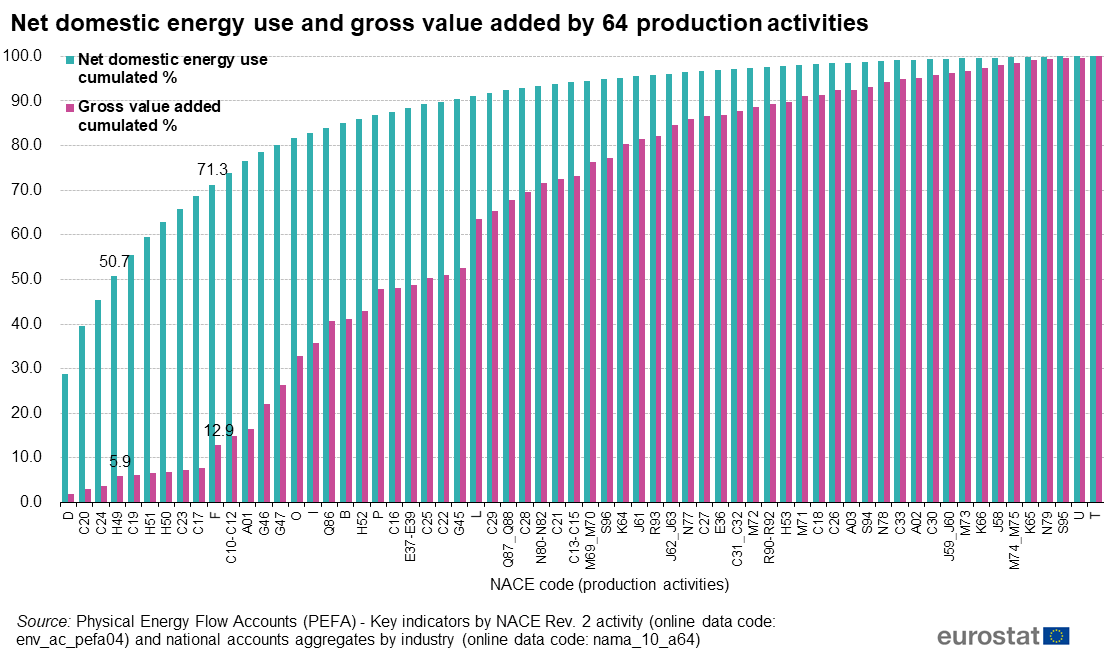
Net domestic energy use and gross value added by 64 production activities.PNG
(
file
)
118 KB
1
08:40, 7 May 2020
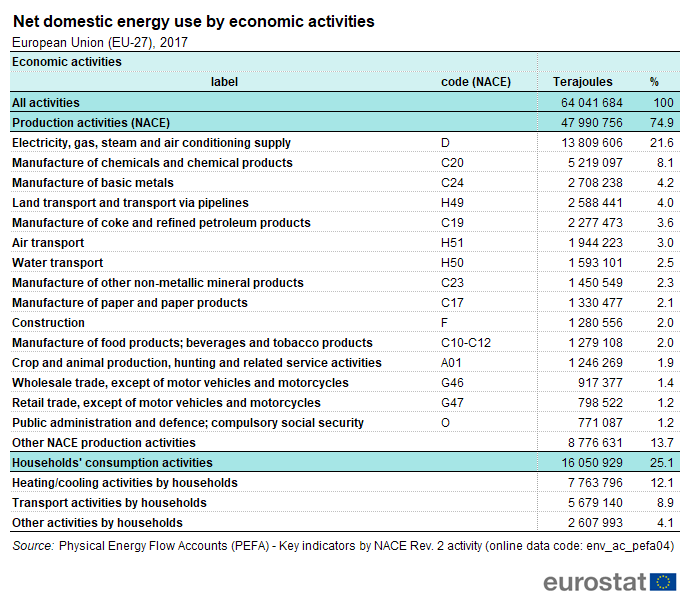
Net domestic energy use by economic activities European Union (EU-27), 2017.png
(
file
)
62 KB
2
08:38, 7 May 2020
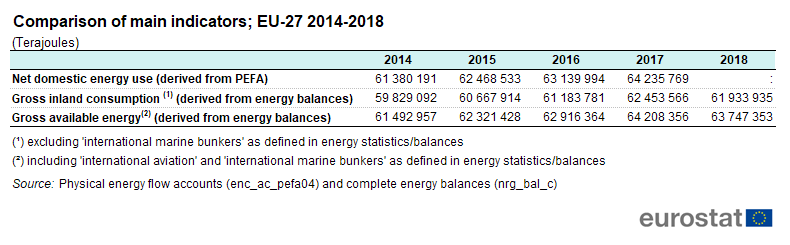
Comparison of main indicators; EU-27 2014-2018 (Terajoules).png
(
file
)
30 KB
1
08:38, 7 May 2020
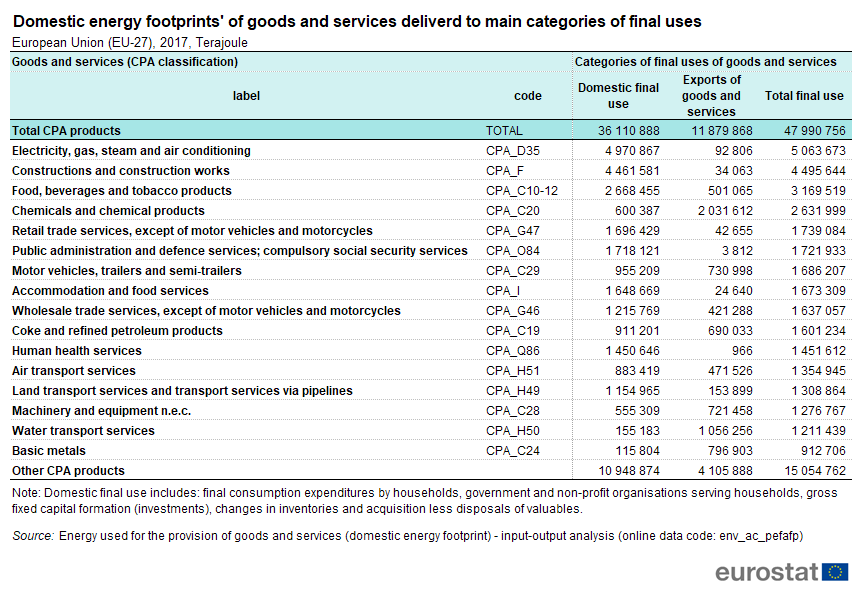
'Domestic energy footprints' of goods and services deliverd to main categories of final uses European Union (EU-27), 2017, Terajoule.png
(
file
)
79 KB
1
10:50, 23 July 2018
Resource productivity statistics 20Jul2018.xlsx
(
file
)
206 KB
1
10:04, 23 July 2018
Physical imports and exports 20July2018.xlsx
(
file
)
126 KB
1
09:58, 23 July 2018
Material flow accounts and resource productivity 19July2018.xlsx
(
file
)
274 KB
1
12:30, 29 October 2014
Resource productivity 29Oct2014.xlsx
(
file
)
50 KB
1
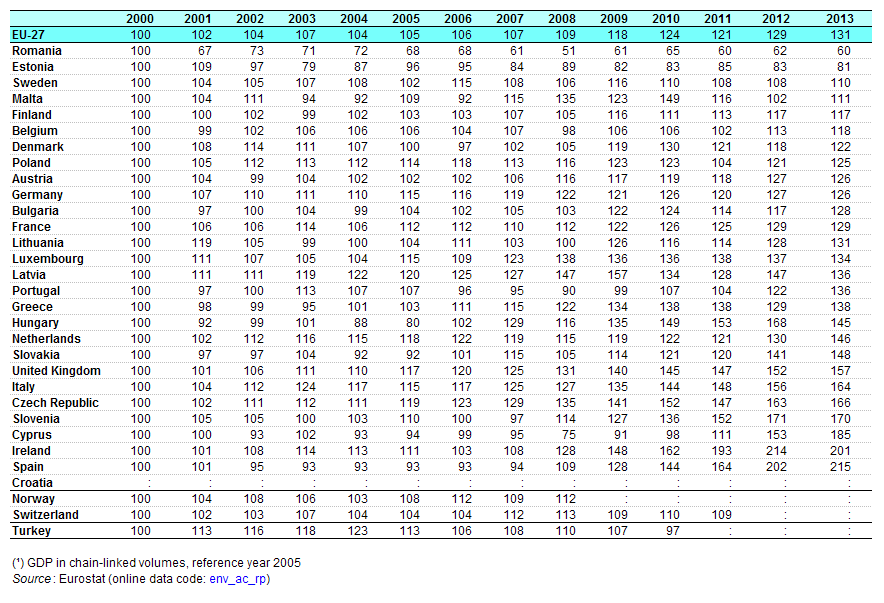
12:19, 29 October 2014
Res Prod (GDP DMC) by country 2000-2013.png
(
file
)
55 KB
1
11:09, 8 November 2013
Carbon dioxide emissions from Final Consumption.xls
(
file
)
280 KB
1
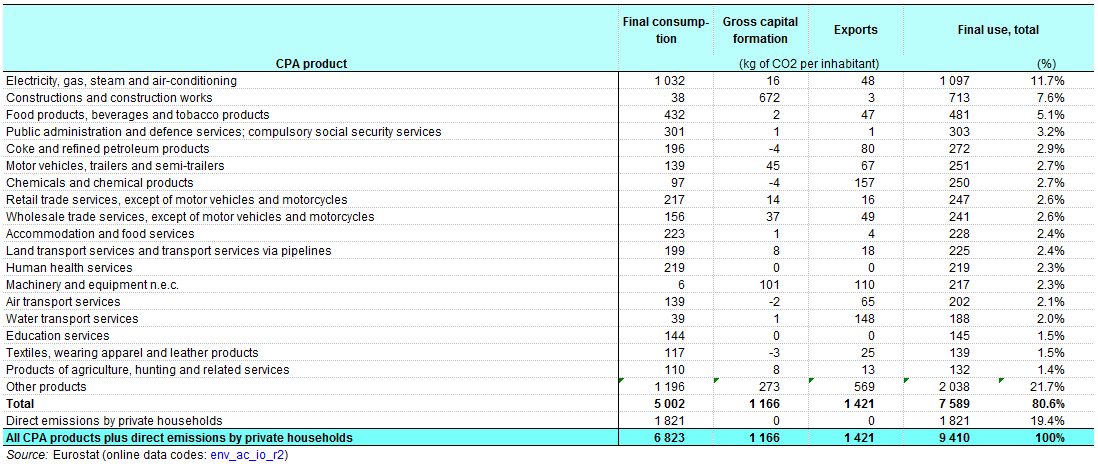
17:45, 6 November 2013
CO2 emissions induced by final use, by product groups and categories of final use, EU-27 (kg of CO2 per inhabitant).png
(
file
)
30 KB
1
17:44, 6 November 2013
Domestic and global CO2 emissions - production and consumption perspective, EU-27 (tonnes CO2 per inhabitant).png
(
file
)
19 KB
1
16:55, 18 September 2012
Material Flow Accounts.xls
(
file
)
754 KB
1
First page
Previous page
Next page
Last page
Special page
ISSN 2443-8219
,_2021,_Terajoule.png)
_by_type_of_material,_EU,_2021.png)
_as_result_of_final_consumption_expenditure_and_gross_capital_formation,_by_type_of_material,_EU,_2021_(tonnes_per_capita).png)
.png)
_by_country,_2022_and_2010,_t_per_cap.png)
_by_main_material_categories,_EU,_2000-2022_(t_per_cap).png)


.png)
.pnger_resources_-_long-term_average_(%25).png)
.png)
.png)

.png)


,_2019,_Terajoule.png)

,_2019.png)
.png)

,_2018.png)
.png)

,_2017.png)
.png)
,_2017,_Terajoule.png)
_by_country_2000-2013.png)
.png)
.png)
.png)