Tutorials
Log in
Statistics Explained
menu
search
search
Navigation
Main page
Statistical themes
Glossary
Categories
Statistics 4 beginners
Tutorials
Help
Eurostat home
Education corner
Online publications
Regional yearbook
Sustainable development
Full list
Tools
User contributions
Logs
View user groups
Special pages
search
Navigation
Main page
Statistical themes
Glossary
Categories
Statistics 4 beginners
Tutorials
Help
Eurostat home
Education corner
Online publications
Regional yearbook
Sustainable development
Full list
Tools
User contributions
Logs
View user groups
Special pages
Navigation
Main page
Statistical themes
Glossary
Categories
Statistics 4 beginners
Tutorials
Help
Eurostat home
Education corner
Online publications
Regional yearbook
Sustainable development
Full list
Tools
User contributions
Logs
View user groups
Special pages
Uploads by Wolffpa
This special page shows all uploaded files.
File list
Items per page:
20
50
100
250
500
Search for media name:
Username:
Include old versions of files
Go
First page
Previous page
Next page
Last page
Date
Name
Thumbnail
Size
Description
Versions
14:39, 4 August 2016
Share of world population, 1960, 2015 and 2060 (%) 2.png
(
file
)
56 KB
1
14:51, 4 August 2016
Net migration rate, 2005–10 and 2010–15 (per 1 000 population) V2.png
(
file
)
25 KB
1
14:56, 4 August 2016
Share of foreign-born population, 2015 (%) V2.png
(
file
)
24 KB
1
15:03, 4 August 2016
Asylum seekers, 2015 (thousand applicants) V2.png
(
file
)
21 KB
1
15:05, 4 August 2016
Ch01 Population EU world16 V2.xlsx
(
file
)
148 KB
1
15:53, 4 August 2016
Household consumption expenditure by type of expenditure, 2014 (% of total household consumption expenditure) V2.png
(
file
)
46 KB
1
16:14, 4 August 2016
Expenditure on health, 2013 V2.png
(
file
)
31 KB
1
16:30, 4 August 2016
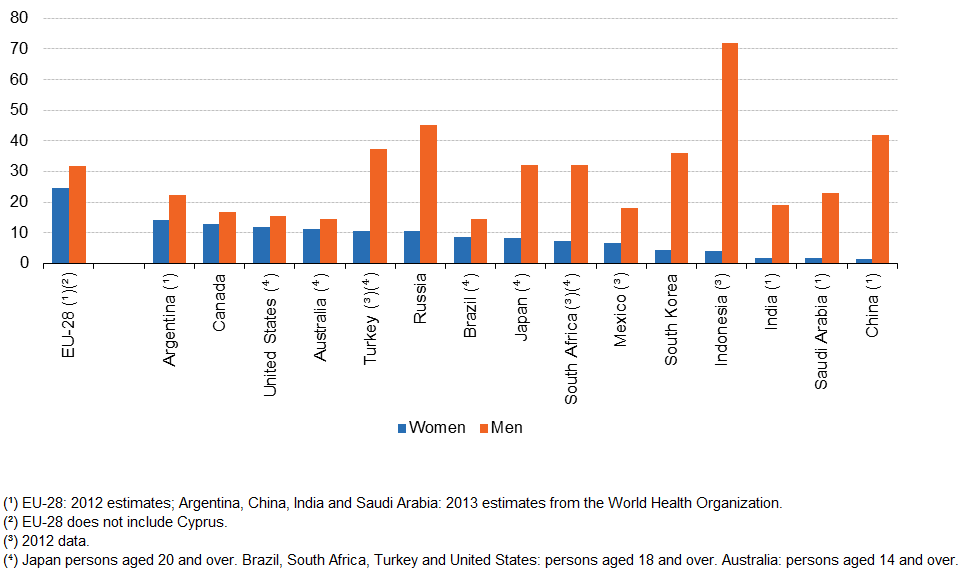
Daily smokers, by sex, 2013 (% of the population aged 15 and over) V2.png
(
file
)
29 KB
1
16:34, 4 August 2016
Ch03 Health EU world16. V2xlsx.xlsx
(
file
)
73 KB
1
16:36, 4 August 2016
Ch03 Health EU world16 V2.xlsx
(
file
)
73 KB
1
13:55, 5 August 2016
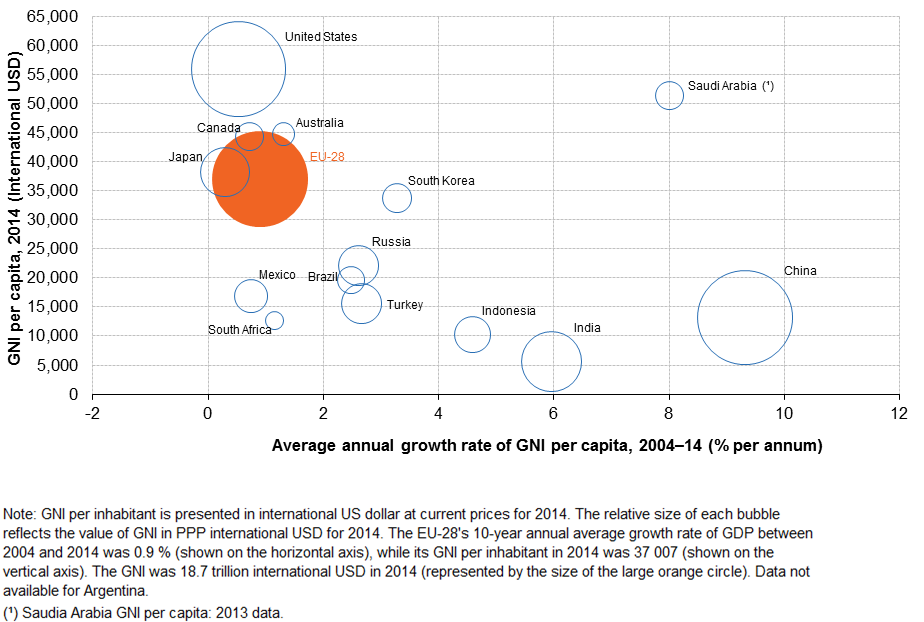
GNI per inhabitant and average annual growth of GNI per capita V2.png
(
file
)
88 KB
1
14:07, 5 August 2016
Ch06 Economy and finance EU world16 V2.xlsx
(
file
)
144 KB
1
14:26, 5 August 2016
Number of nights spent in tourist accommodation by country of origin V2.png
(
file
)
18 KB
1
15:00, 5 August 2016
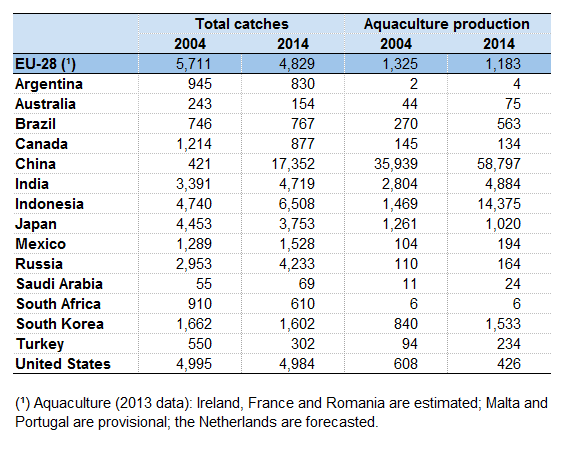
Fish catches and aquaculture production V2.png
(
file
)
25 KB
1
15:02, 5 August 2016
Production (fish catch and aquaculture) per inhabitant V2.png
(
file
)
25 KB
1
15:04, 5 August 2016
Ch11 Agriculture, forestry and fisheries EU world16 V3.xlsx
(
file
)
107 KB
1
15:18, 5 August 2016
Greenhouse gas emissions, 1990 and 2012 V2.png
(
file
)
27 KB
1
15:36, 5 August 2016
Marine protected areas, 2000 and 2014 V2.png
(
file
)
18 KB
1
15:38, 5 August 2016
Ch12 Environment EU world16 V2.xlsx
(
file
)
102 KB
1
15:50, 5 August 2016
Share of renewables and waste in GEG V2.png
(
file
)
25 KB
1
15:09, 18 August 2016
Main indicators for health resources V2.png
(
file
)
41 KB
1
16:21, 18 August 2016
Life expectancy at birth V2.png
(
file
)
38 KB
2
16:31, 18 August 2016
Ch03 Health EU world16 V3.xlsx
(
file
)
74 KB
1
16:55, 18 August 2016
Pupil-teacher ratios in primary and secondary education V2.png
(
file
)
28 KB
1
17:13, 18 August 2016
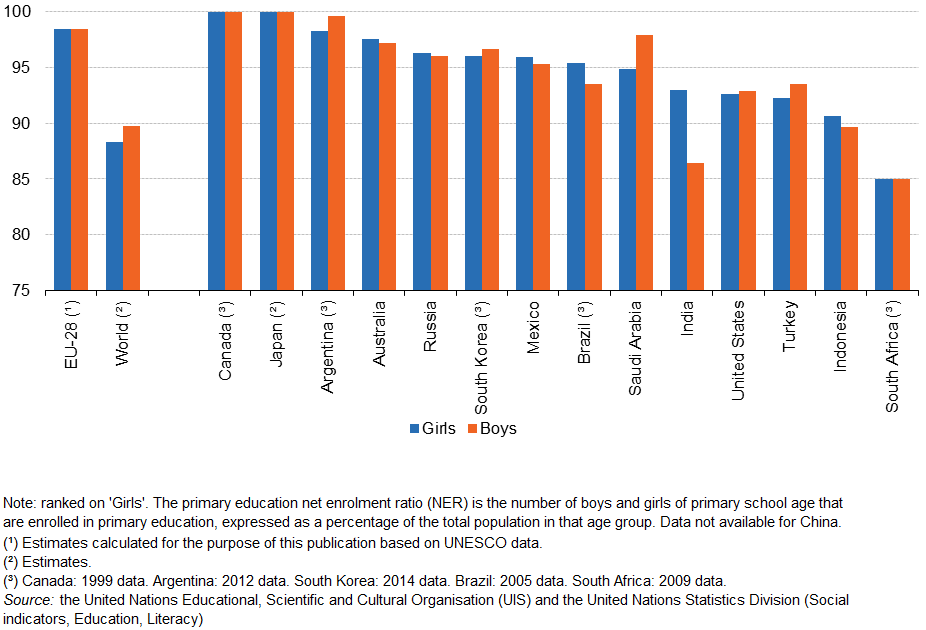
Primary education net enrolment ratio V2.png
(
file
)
50 KB
1
17:19, 18 August 2016
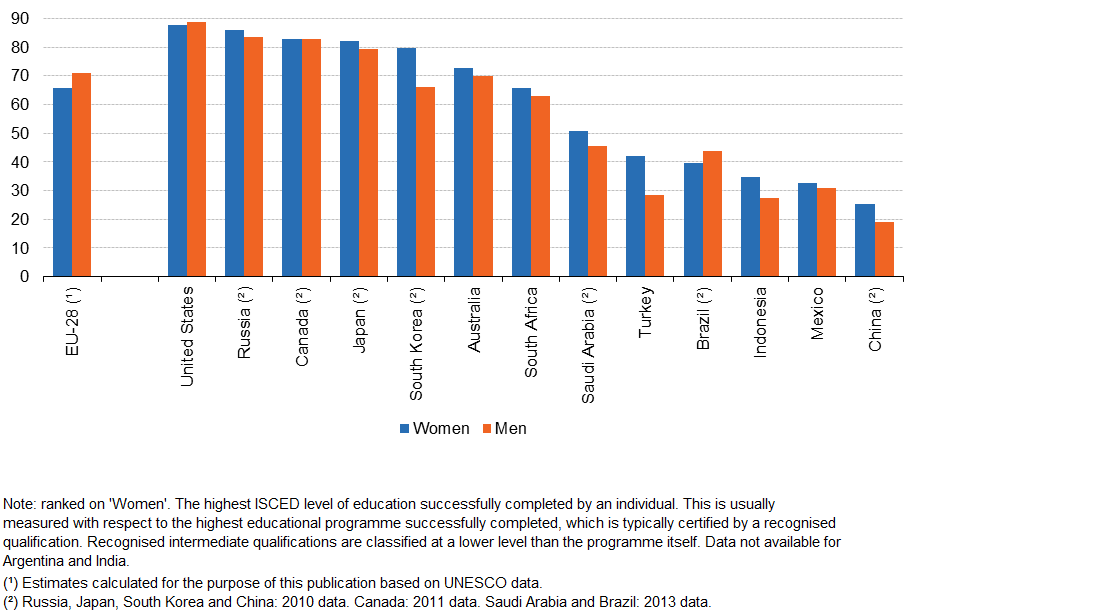
Secondary educational attainment by sex V2.png
(
file
)
44 KB
1
17:25, 18 August 2016
Primary education net enrolment ratio V3.png
(
file
)
46 KB
1
17:27, 18 August 2016
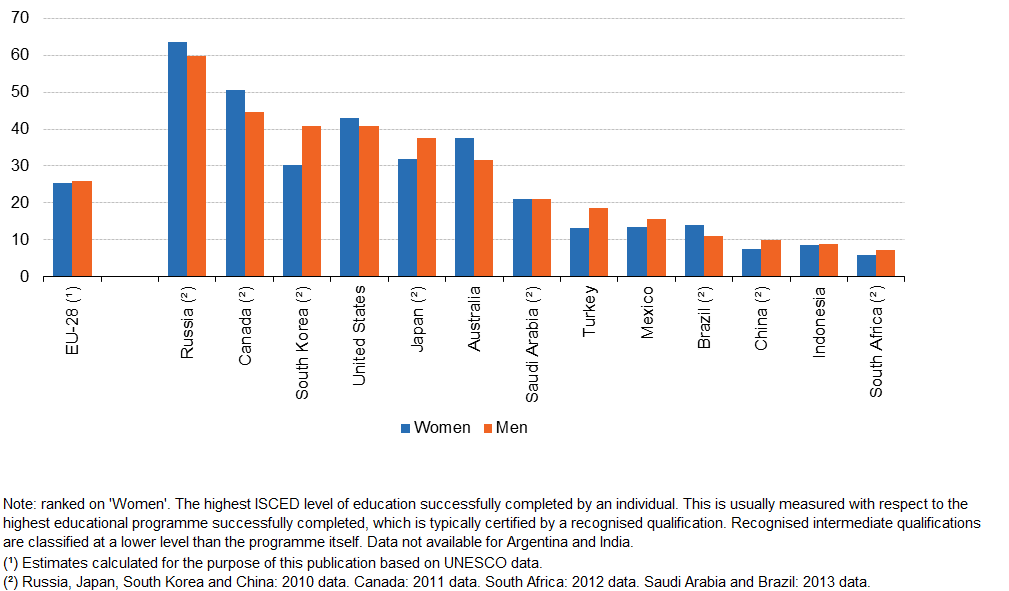
Tertiary educational attainment by sex V2.png
(
file
)
37 KB
1
17:30, 18 August 2016
Ch04 Education and training EU world16 V2.xlsx
(
file
)
98 KB
1
13:34, 19 August 2016
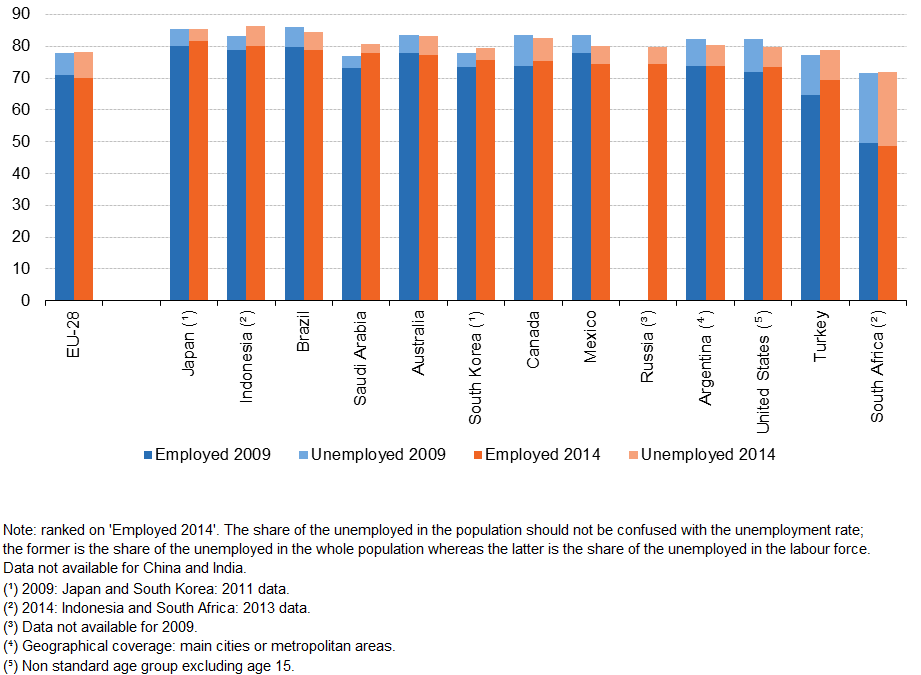
Activity rate for men — employed and unemployed V2.png
(
file
)
51 KB
1
13:37, 19 August 2016
Activity rate for women — employed and unemployed V2.png
(
file
)
45 KB
1
13:48, 19 August 2016
Male youth unemployment rate V2.png
(
file
)
29 KB
1
13:56, 19 August 2016
Ch05 Labour market EU world16 V2.xlsx
(
file
)
93 KB
1
15:46, 19 August 2016
Maritime fleet 2005 and 2014 and largest ports V2.png
(
file
)
41 KB
1
15:48, 19 August 2016
Maritime fleet 2005 and 2014 and largest ports V3.png
(
file
)
40 KB
1
16:16, 19 August 2016
Ch10 Transport EU world16 V2.xlsx
(
file
)
99 KB
1
17:18, 26 August 2016
Employment rate, persons aged 25–64, by education level, 2013 (%).png
(
file
)
23 KB
1
17:22, 26 August 2016
Employment rate by education level.png
(
file
)
40 KB
1
17:06, 9 December 2016
Current healthcare expenditure, 2013 V2.png
(
file
)
39 KB
1
17:15, 9 December 2016
Current healthcare expenditure, 2013 V2 Fig 1.png
(
file
)
75 KB
1
17:16, 9 December 2016
Healthcare expenditure by financing scheme, 2013 V2.png
(
file
)
77 KB
1
17:18, 9 December 2016
Healthcare expenditure by function, 2013 V2.png
(
file
)
76 KB
1
17:20, 9 December 2016
Healthcare expenditure by provider, 2013 V2.png
(
file
)
86 KB
1
17:24, 9 December 2016
Long-term care as a share of current healthcare expenditure, 2013 V2.png
(
file
)
37 KB
1
17:28, 9 December 2016
Long-term care expenditure, 2013 V2.png
(
file
)
35 KB
1
17:32, 9 December 2016
Healthcare expenditure YB2016 V2.xlsx
(
file
)
6.58 MB
1
18:08, 9 December 2016
Causes of death — standardised death rate per 100 000 inhabitants, males, EU-28, 2004–13 (2009 = 100) V2.png
(
file
)
44 KB
1
18:11, 9 December 2016
Causes of death — standardised death rate per 100 000 inhabitants, females, EU-28, 2004–13 (2009 = 100) V2.png
(
file
)
48 KB
1
18:12, 9 December 2016
Deaths from ischaemic heart diseases — standardised death rate, 2013 (per 100 000 inhabitants) V2.png
(
file
)
54 KB
1
18:14, 9 December 2016
Deaths from suicide — standardised death rate, 2013 (per 100 000 inhabitants) V2.png
(
file
)
50 KB
1
First page
Previous page
Next page
Last page
Special page
ISSN 2443-8219
_2.png)
_V2.png)
_V2.png)
_V2.png)
_V2.png)

_V2.png)


_per_inhabitant_V2.png)


.png)


_V2.png)
_V2.png)
_V2.png)
_V2.png)