Tutorials
Log in
Statistics Explained
menu
search
search
Navigation
Main page
Statistical themes
Glossary
Categories
Statistics 4 beginners
Tutorials
Help
Eurostat home
Education corner
Online publications
Regional yearbook
Sustainable development
Full list
Tools
User contributions
Logs
View user groups
Special pages
search
Navigation
Main page
Statistical themes
Glossary
Categories
Statistics 4 beginners
Tutorials
Help
Eurostat home
Education corner
Online publications
Regional yearbook
Sustainable development
Full list
Tools
User contributions
Logs
View user groups
Special pages
Navigation
Main page
Statistical themes
Glossary
Categories
Statistics 4 beginners
Tutorials
Help
Eurostat home
Education corner
Online publications
Regional yearbook
Sustainable development
Full list
Tools
User contributions
Logs
View user groups
Special pages
Uploads by Hauseha
This special page shows all uploaded files.
File list
Items per page:
20
50
100
250
500
Search for media name:
Username:
Include old versions of files
Go
First page
Previous page
Next page
Last page
Date
Name
Thumbnail
Size
Description
Versions
09:34, 14 March 2016
Municipal waste generated by country in 2003 and 2013, sorted by 2013 level (kg per capita)nw1.png
(
file
)
44 KB
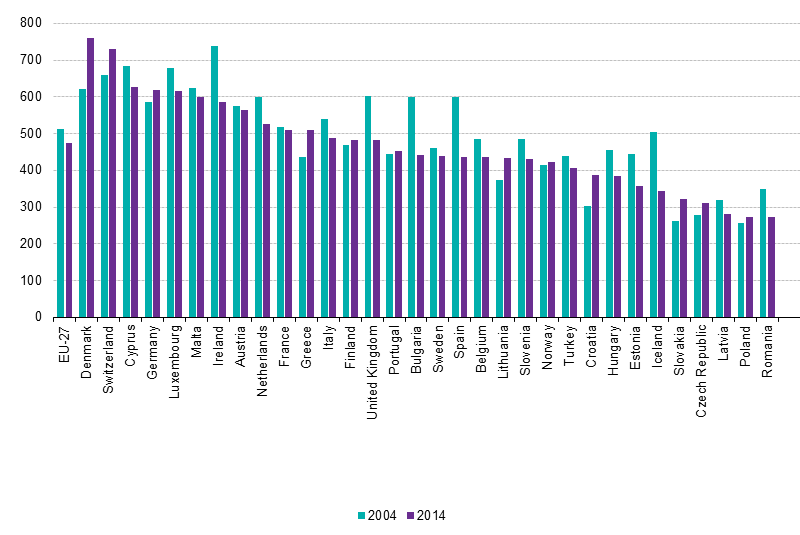
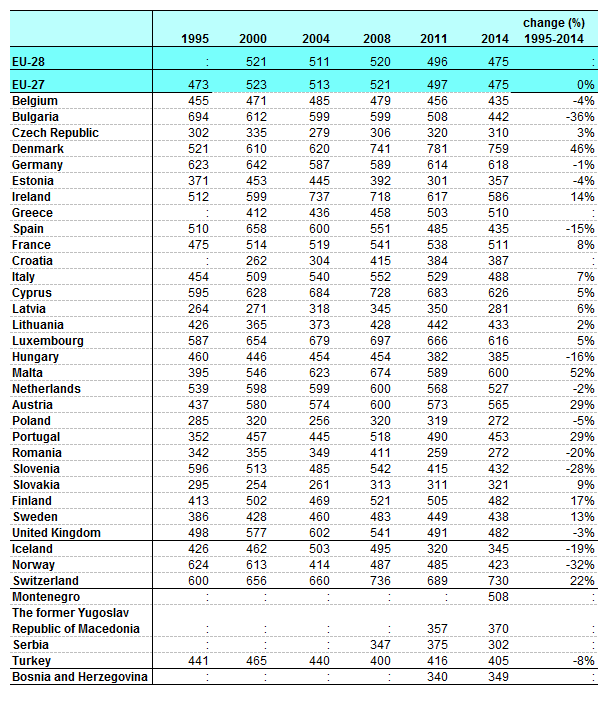
Municipal waste generated by country in 2004 and 2014, sorted by 2014 level (kg per capita)
2
12:21, 14 March 2016
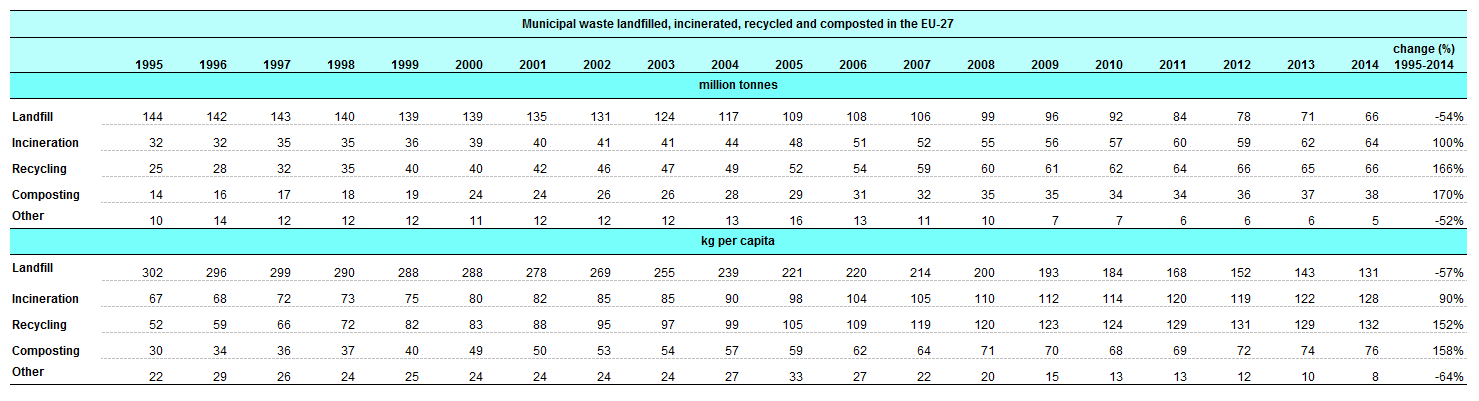
Municipal waste landfilled, incinerated, recycled and composted in the EU-27, 1995 to 2013.png
(
file
)
26 KB
4
12:26, 14 March 2016
Municipal waste generated by country in selected years (kg per capita) new1.png
(
file
)
44 KB
several years wer replaced, e.g. 2013 by 2014
2
18:03, 23 January 2017
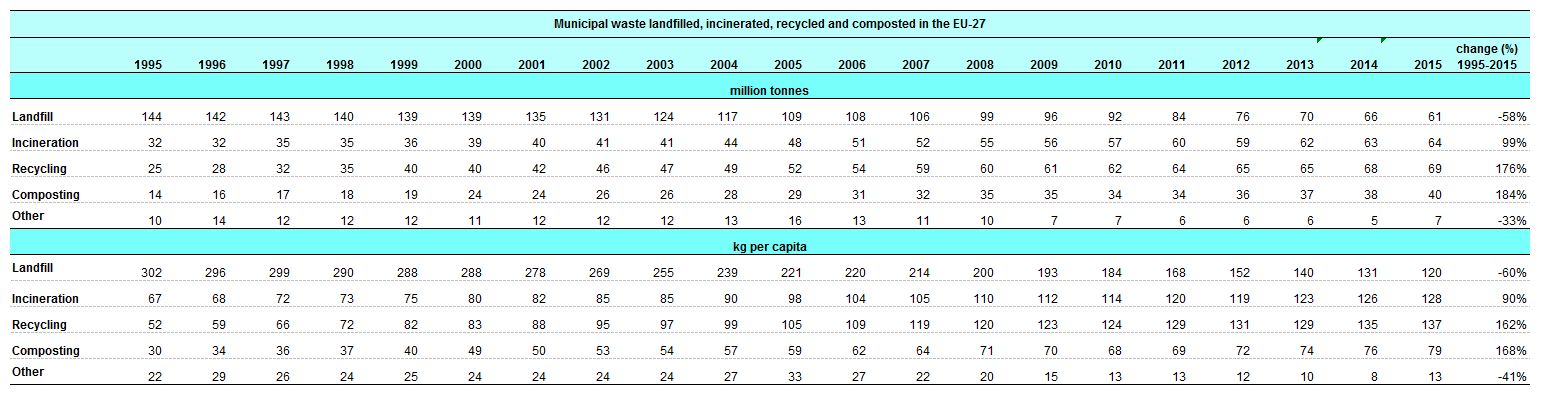
Municipal waste landfilled, incinerated, recycled and composted in the EU-27 19951995-2015.png
(
file
)
27 KB
1
09:25, 17 May 2017
Waste management indicators - tables and figures 17 05 2017 1.xlsx
(
file
)
49 KB
1
09:33, 17 May 2017
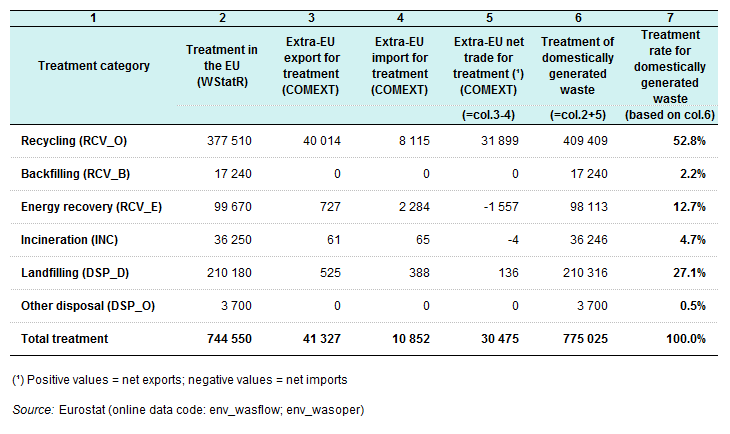
Treatment of domestically generated waste excl major mineral wastes and imports exports of waste for the EU-28, 2012.png
(
file
)
22 KB
Reverted to version as of 14:59, 11 November 2016
4
16:42, 23 May 2017
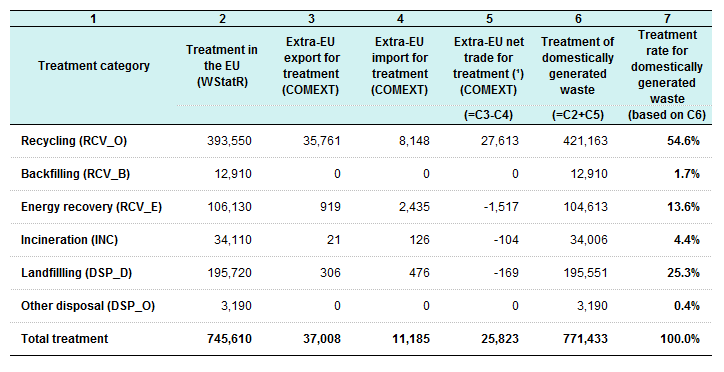
Treatment of domestically generated waste excl major mineral wastes and imports exports of waste for the EU-28, 2014.png
(
file
)
19 KB
3
16:57, 23 May 2017
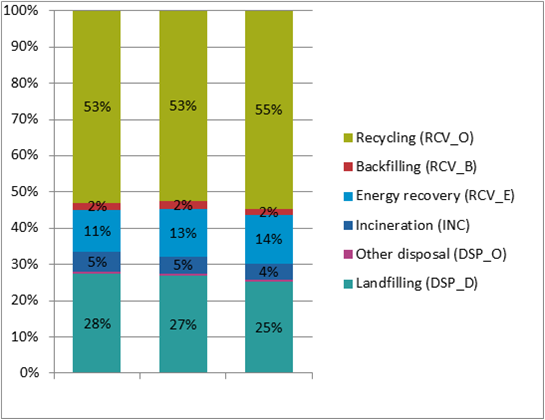
Treatment rates for domestically generated waste excl major mineral wastes in the EU-28, 2010 to 2014 (%) .png
(
file
)
45 KB
2
16:59, 23 May 2017
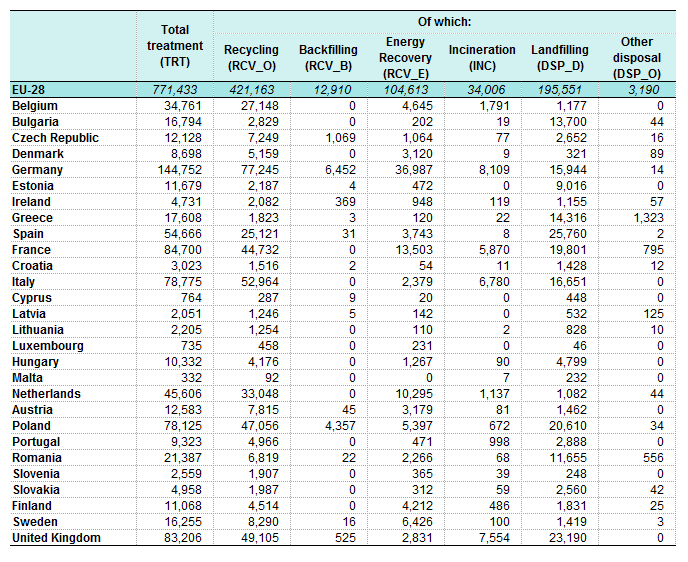
Treatment of domestically generated waste excl major mineral wastes by country and by type of treatment, 2014.png
(
file
)
42 KB
2
17:09, 23 May 2017
Domestically treated waste excluding major mineral wastes by country and by type of treatment, 2014.png
(
file
)
22 KB
Data for Germany updated
2
17:10, 23 May 2017
Recycling of domestically generated waste excluding major mineral wastes in the EU, 2014.png
(
file
)
24 KB
Data for Germany updated
2
17:13, 23 May 2017
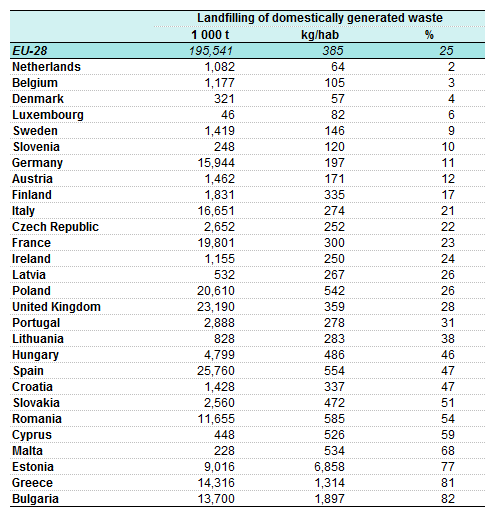
Landfilling of domestically generated waste excluding major mineral wastes in the EU, 2014.png
(
file
)
22 KB
German data updated
2
17:14, 23 May 2017
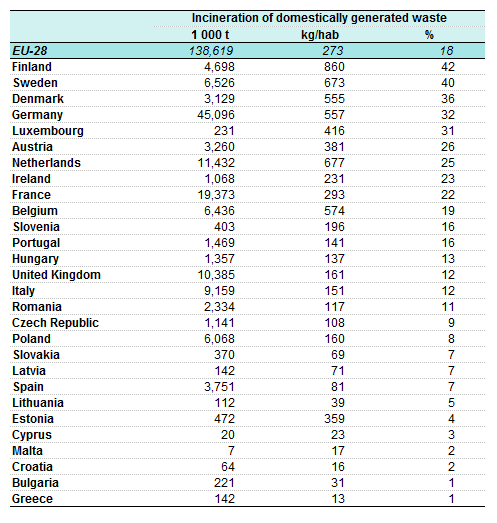
Incineration of domestically generated waste excluding major mineral wastes in the EU, 2014.png
(
file
)
21 KB
Data for Germany updated
2
08:29, 24 May 2017
Waste management indicators - tables and figures 19 05 2017 1.xlsx
(
file
)
50 KB
1
11:22, 27 July 2017
Municipal waste generated by country in 2005 and 2015, sorted by 2015 level (kg per capita) 1.png
(
file
)
38 KB
1
11:27, 27 July 2017
Municipal waste generated by country in selected years (kg per capita) 1.png
(
file
)
40 KB
1
11:28, 27 July 2017
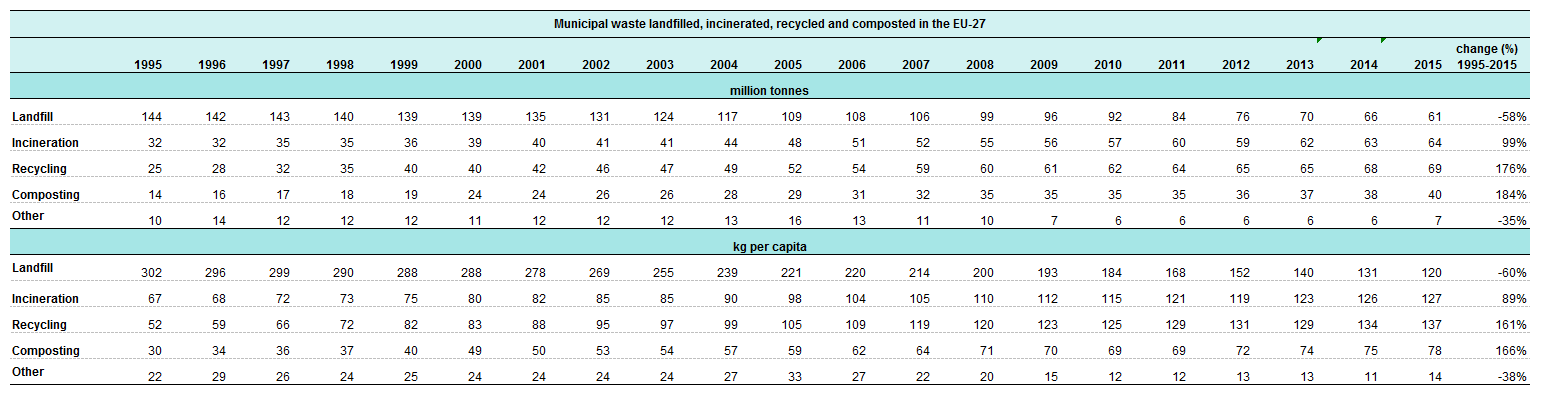
Municipal waste landfilled, incinerated, recycled and composted in the EU-27, 1995 to 2015 1.png
(
file
)
27 KB
1
11:32, 27 July 2017
Municipal waste treatment, EU-27, (kg per capita) 1.png
(
file
)
21 KB
1
15:18, 6 December 2017
WShipR Statistics explained tables and graphs 2015 -update November 2017 jw.xlsx
(
file
)
748 KB
1
15:49, 6 December 2017
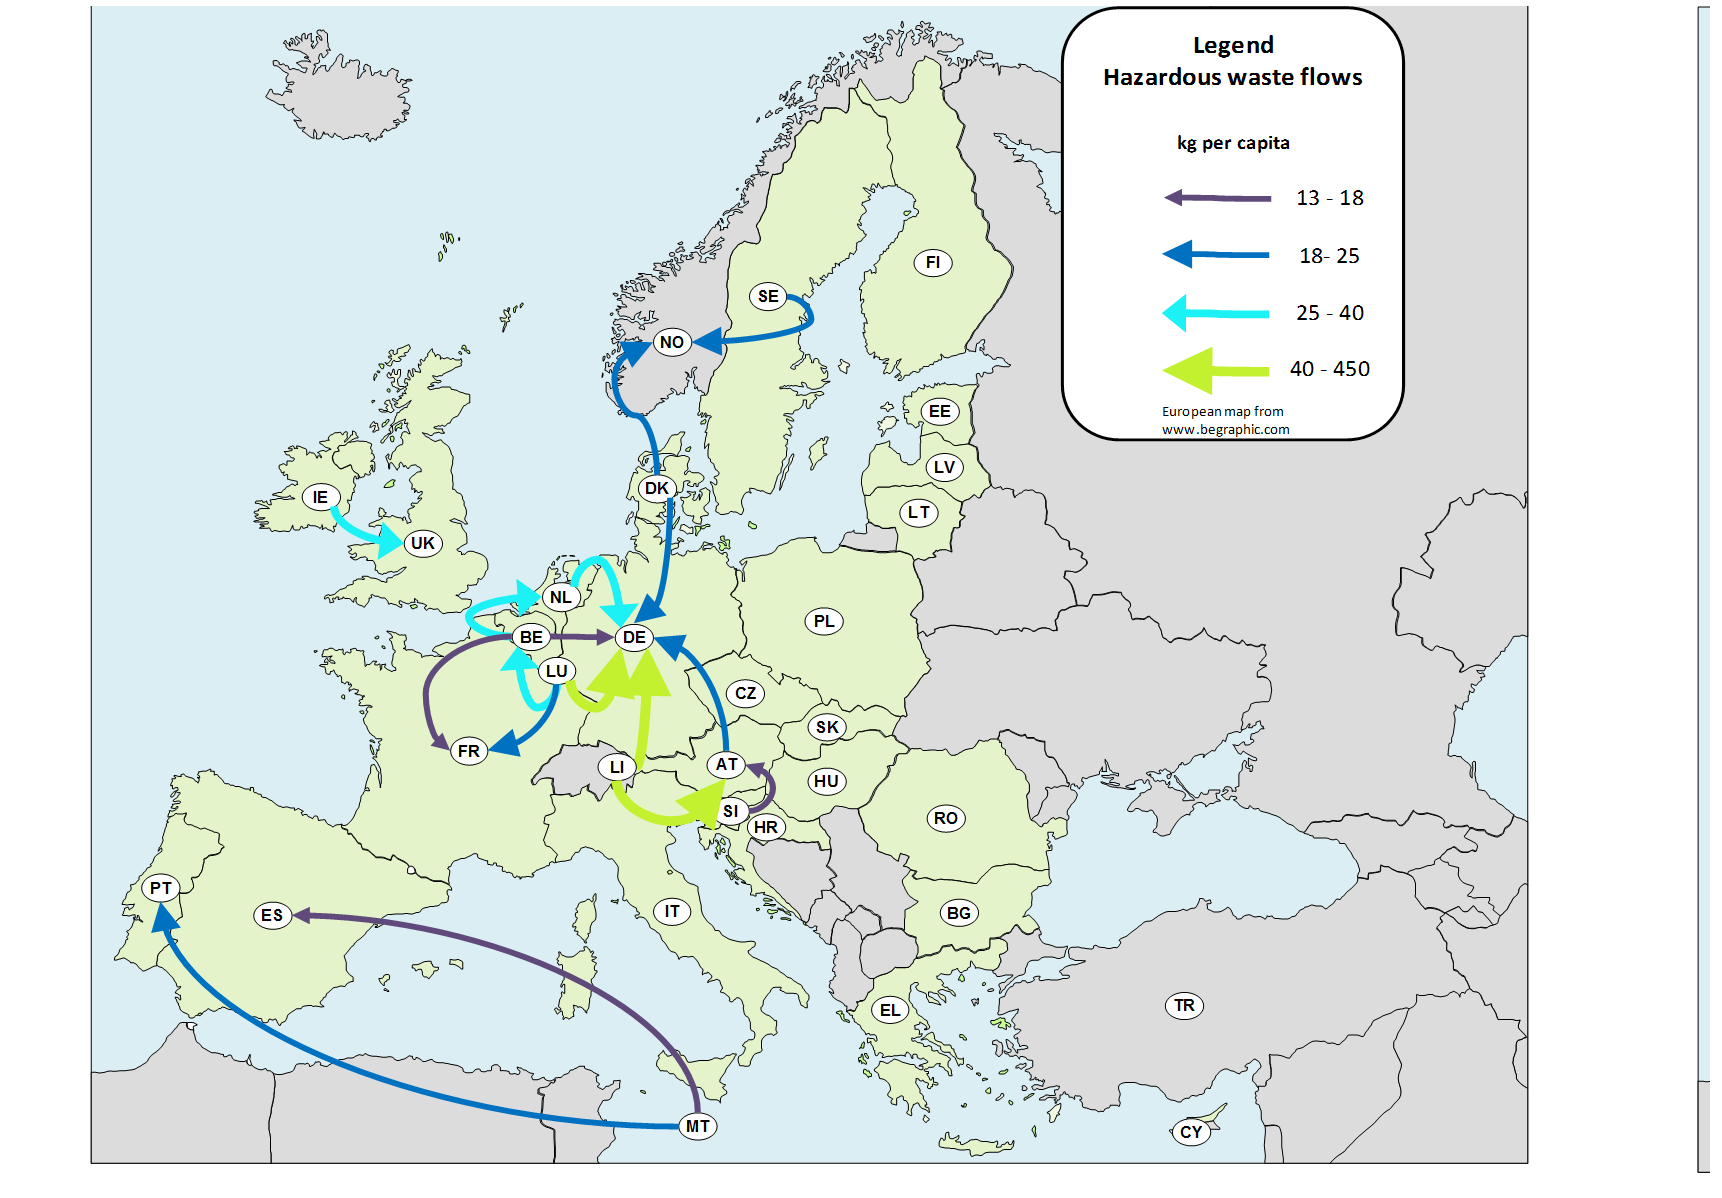
Hazardous waste shipments from EU Member States,Norway and Liechtenstein (larger flows), 2015.png
(
file
)
280 KB
1
15:54, 6 December 2017
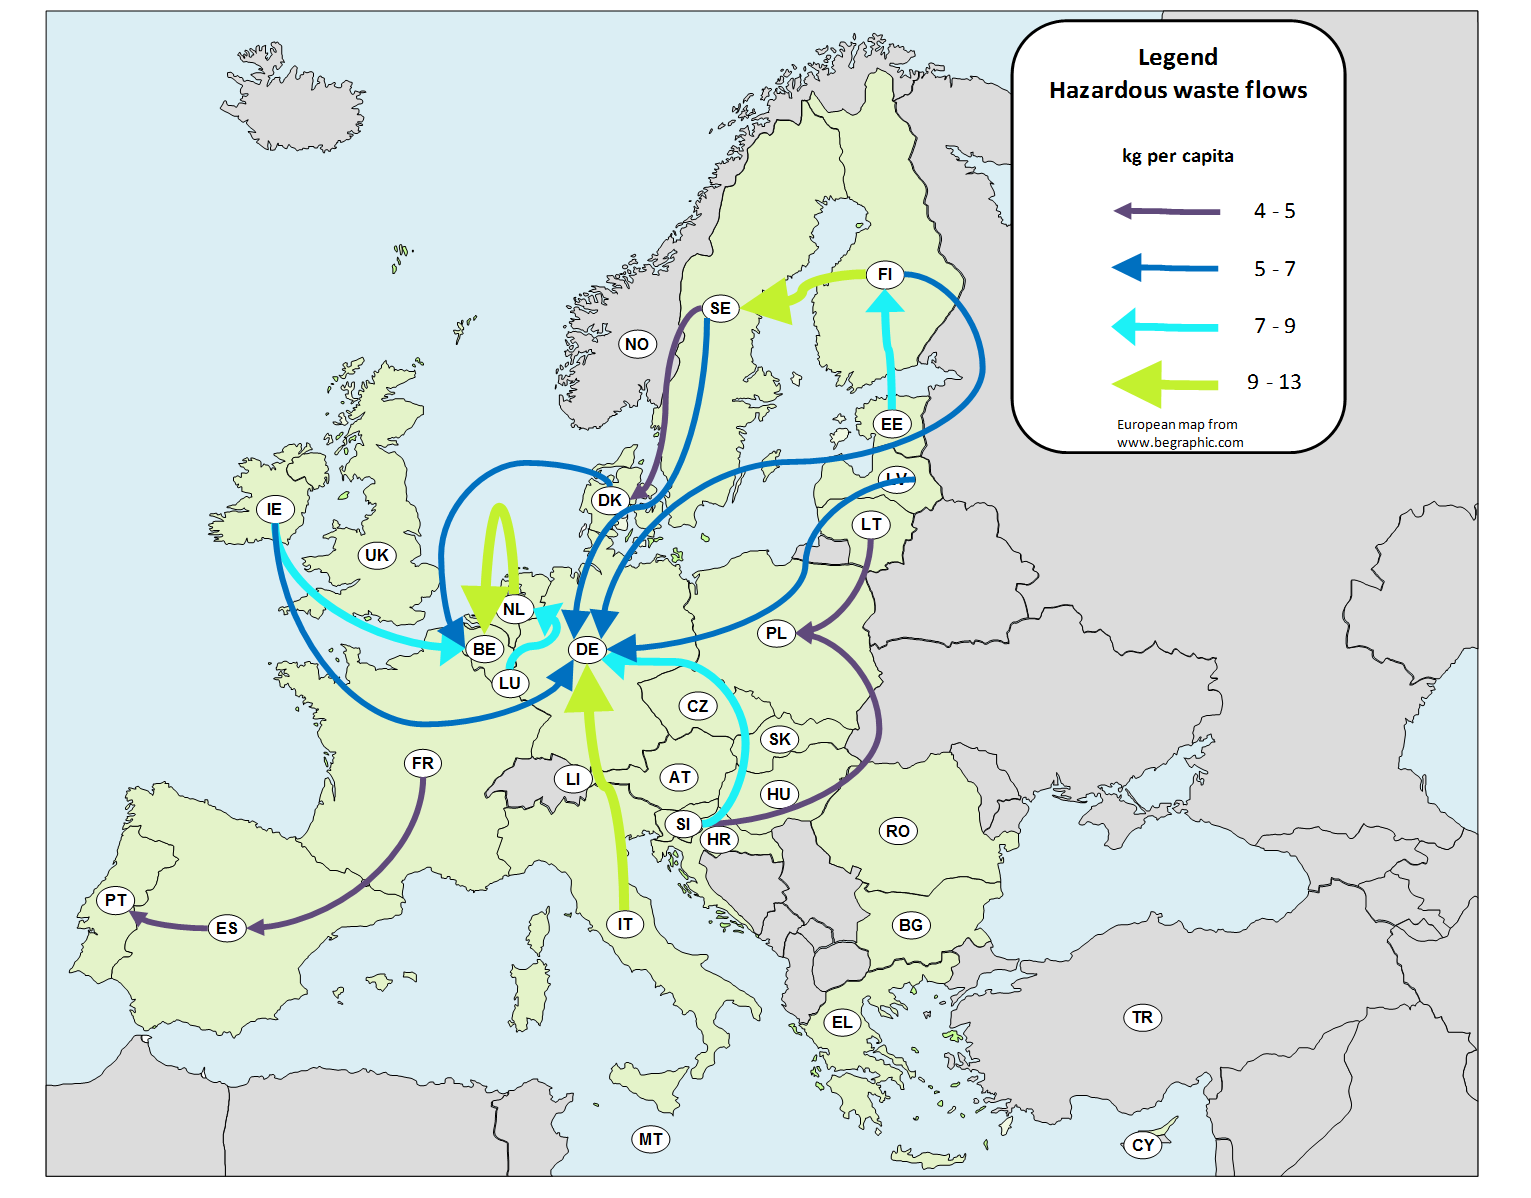
Hazardous waste shipments between EU Member States and Norway (smaller flows), 2015.png
(
file
)
279 KB
1
16:03, 6 December 2017
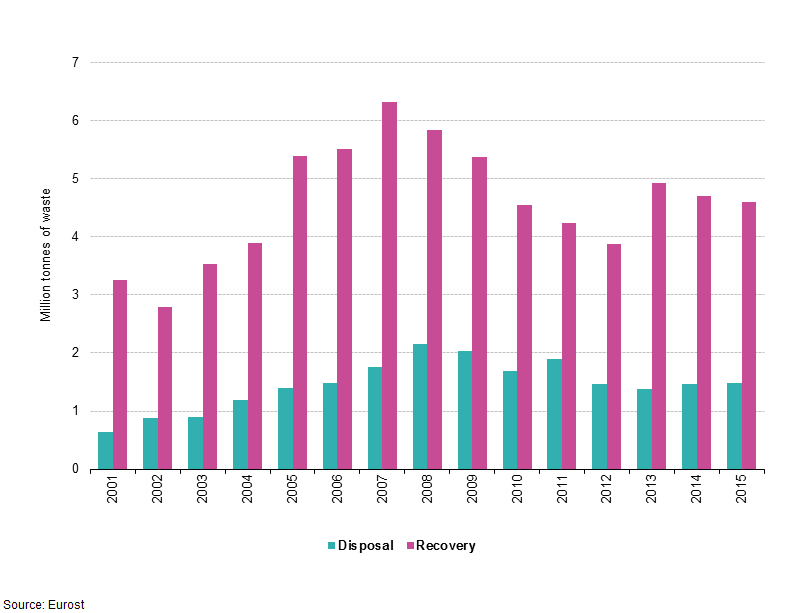
EU-28 treatment of hazardous waste shipped out of EU Member States to other EU Member States or out of the EU, 2001-2015.png
(
file
)
26 KB
1
09:37, 7 December 2017
WShipR Statistics explained tables and graphs 2015 -update November 2017 EH.xlsx
(
file
)
748 KB
1
14:20, 15 December 2017
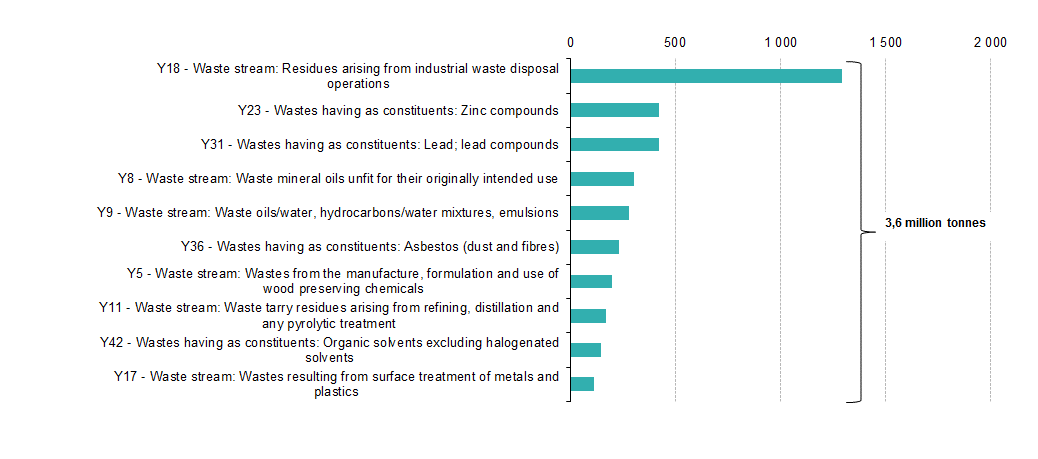
Top 10 Basel Y-codes by amounts of exported hazardous waste reported for 2015.png
(
file
)
21 KB
6
16:54, 18 January 2018
MW EU 28 20180118.xlsx
(
file
)
50 KB
2
18:04, 24 April 2018
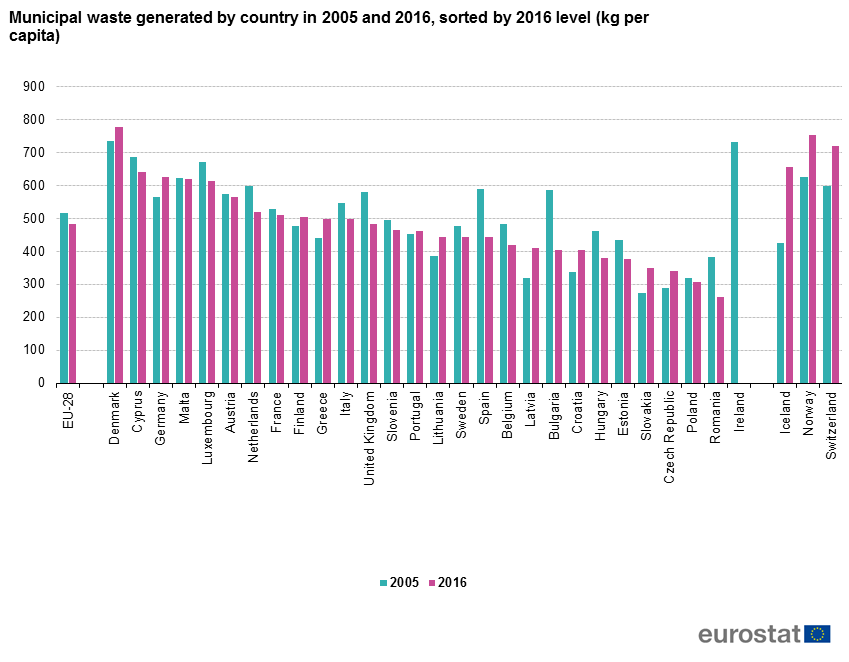
Municipal waste generated by country in 2005 and 2016, sorted by 2016 level (kg per capita).png
(
file
)
51 KB
3
18:32, 24 April 2018
MW EU 28 B 201800424.xlsx
(
file
)
56 KB
1
18:34, 24 April 2018
MW EU 28 201800424.xlsx
(
file
)
47 KB
1
14:09, 18 July 2018
Municipal waste landfilled, incinerated, recycled and composted in the EU-28, 1995 to 2016 .png
(
file
)
35 KB
2
14:11, 18 July 2018
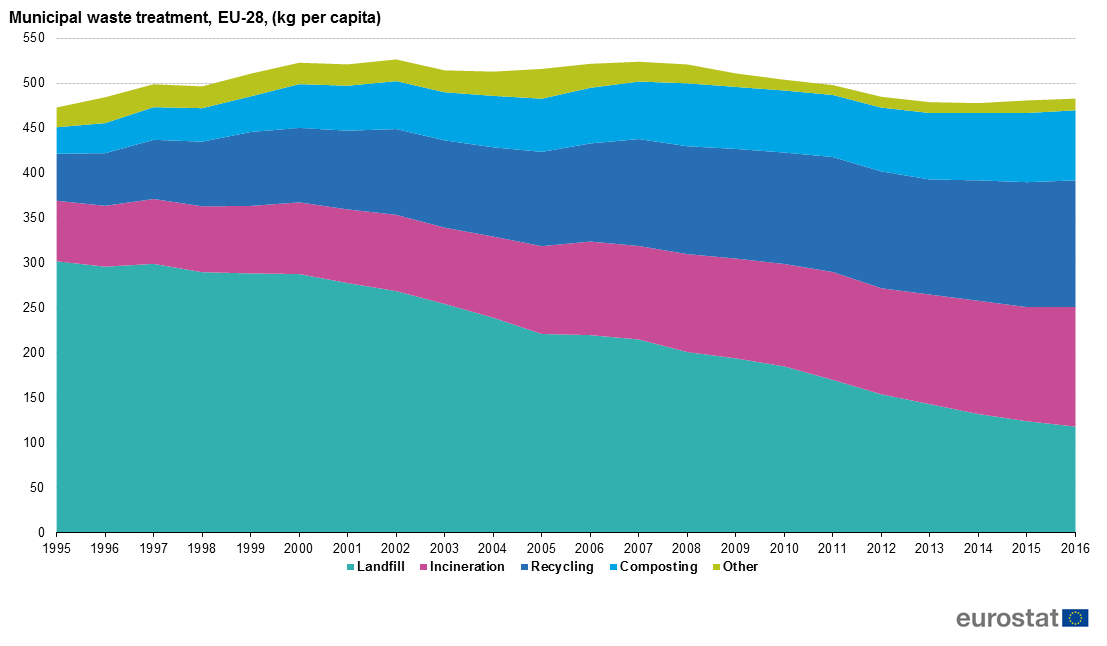
Municipal waste treatment, EU-28, (kg per capita).png
(
file
)
27 KB
1
15:43, 18 July 2018
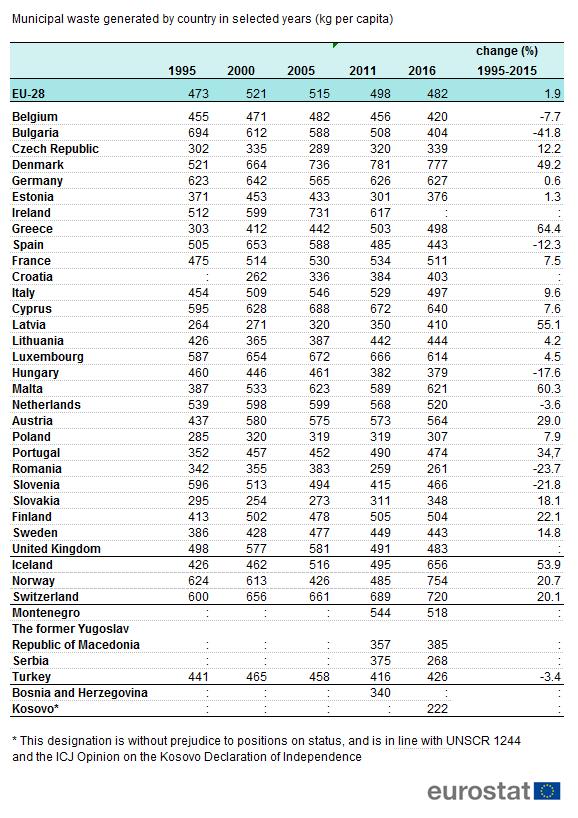
Municipal waste generated by country in selected years (kg per capita) .png
(
file
)
46 KB
2
15:56, 18 July 2018
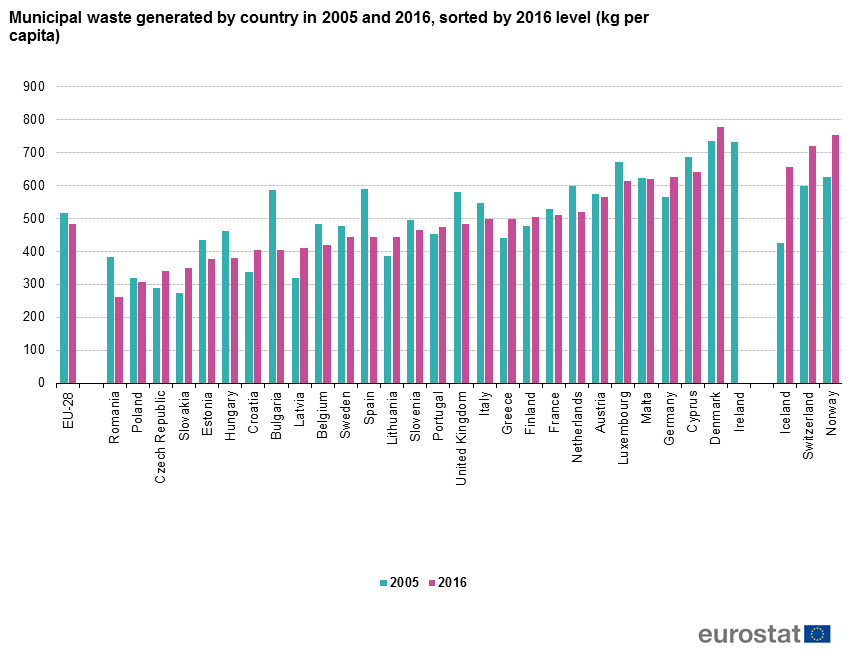
Municipal waste generated by country in 2005 and 2016, sorted by 2016 level (kg per capita) .png
(
file
)
51 KB
1
13:31, 19 July 2018
MW EU 28 20180713.xlsx
(
file
)
48 KB
3
10:55, 13 November 2018
Waste generation, 2016.png
(
file
)
34 KB
1
15:22, 14 November 2018
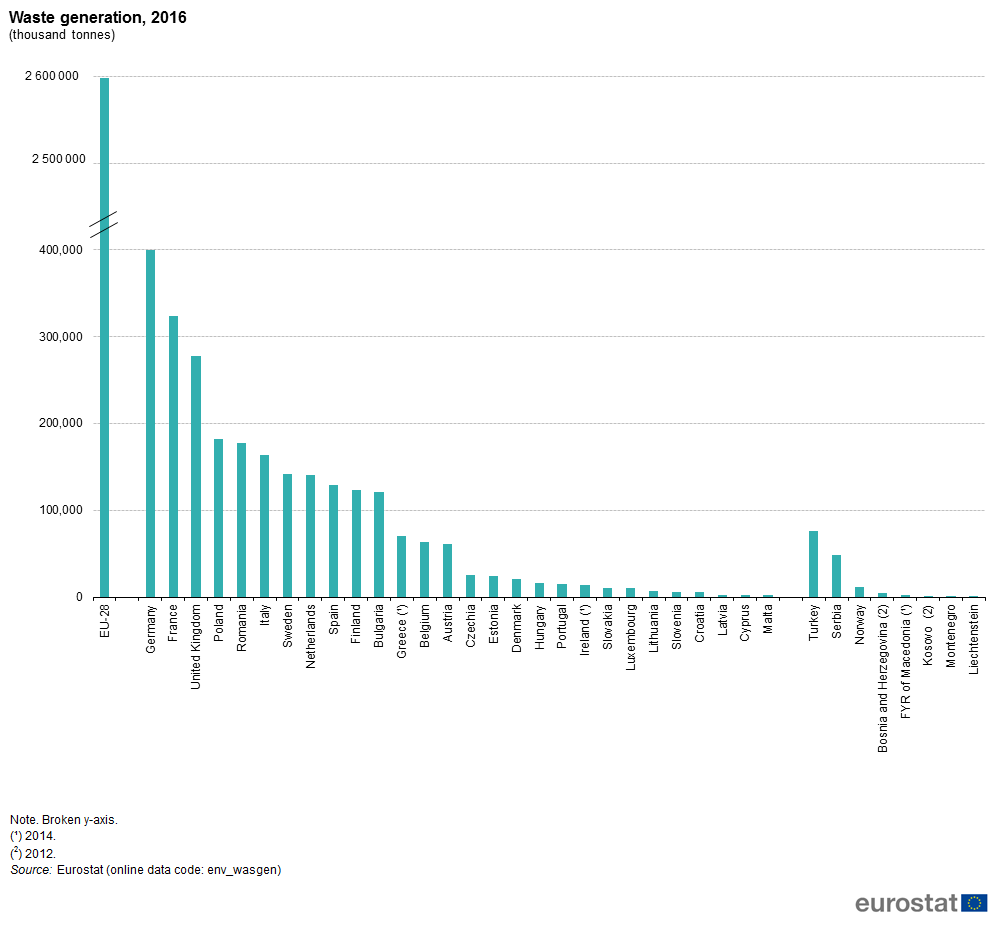
Waste generation, 2016 (thousand tonnes).png
(
file
)
37 KB
1
17:44, 20 November 2018
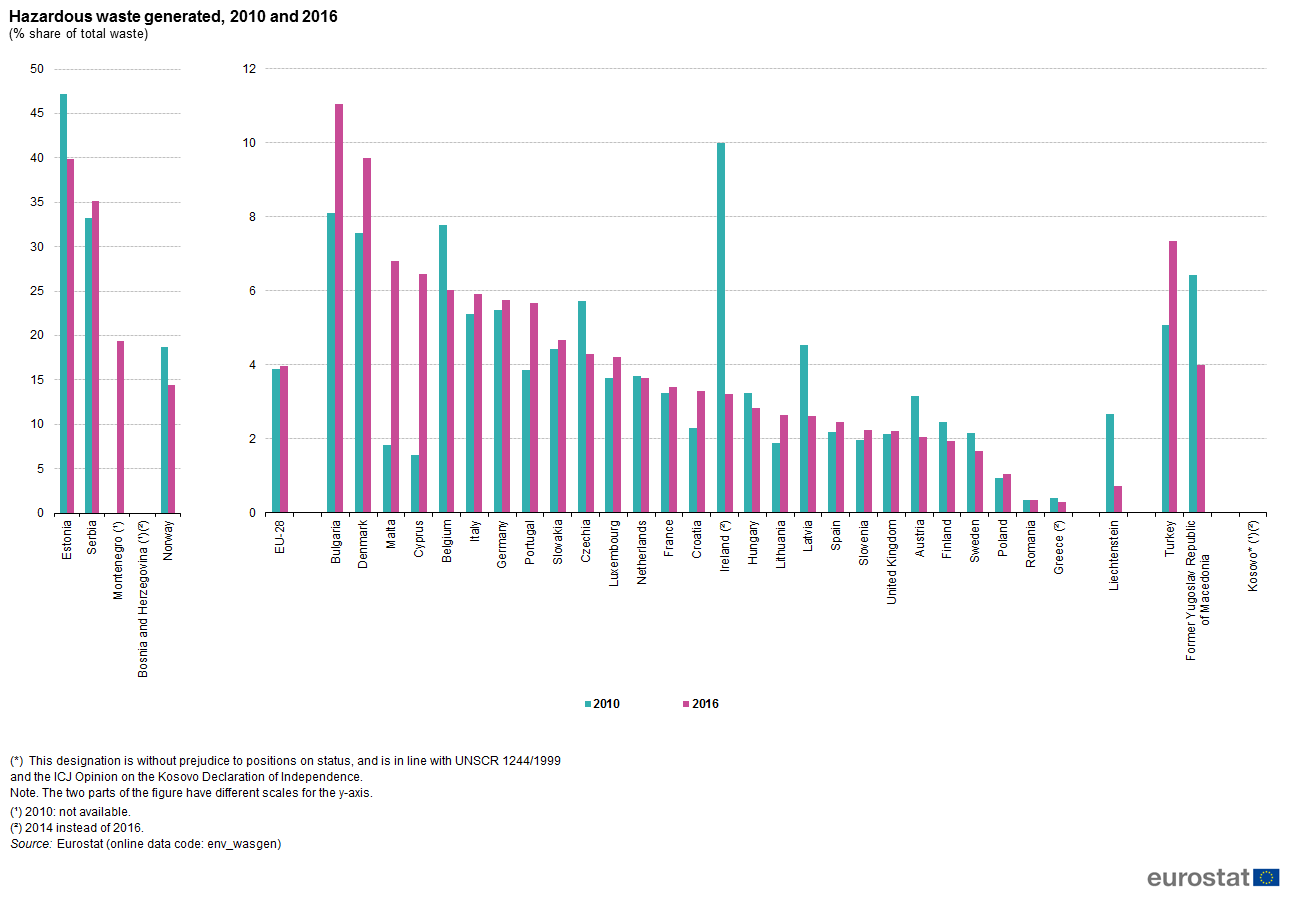
Hazardous waste generated, 2010 and 2016 (% share of total waste).png
(
file
)
67 KB
1
18:46, 20 November 2018
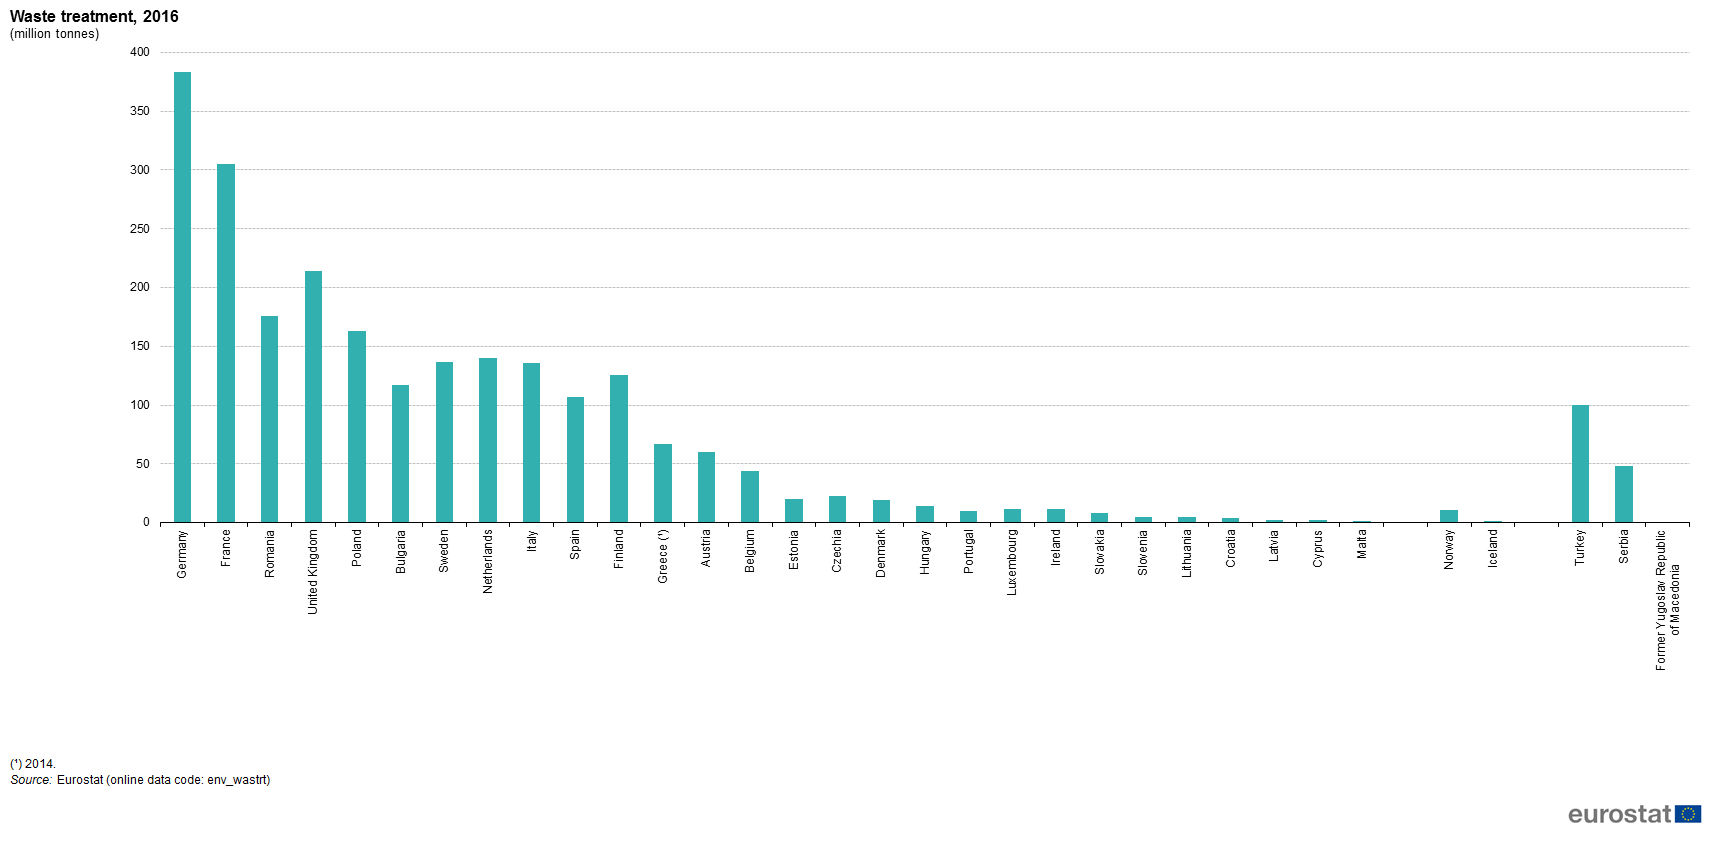
Waste treatment, 2016 (million tonnes).png
(
file
)
37 KB
1
19:31, 20 November 2018
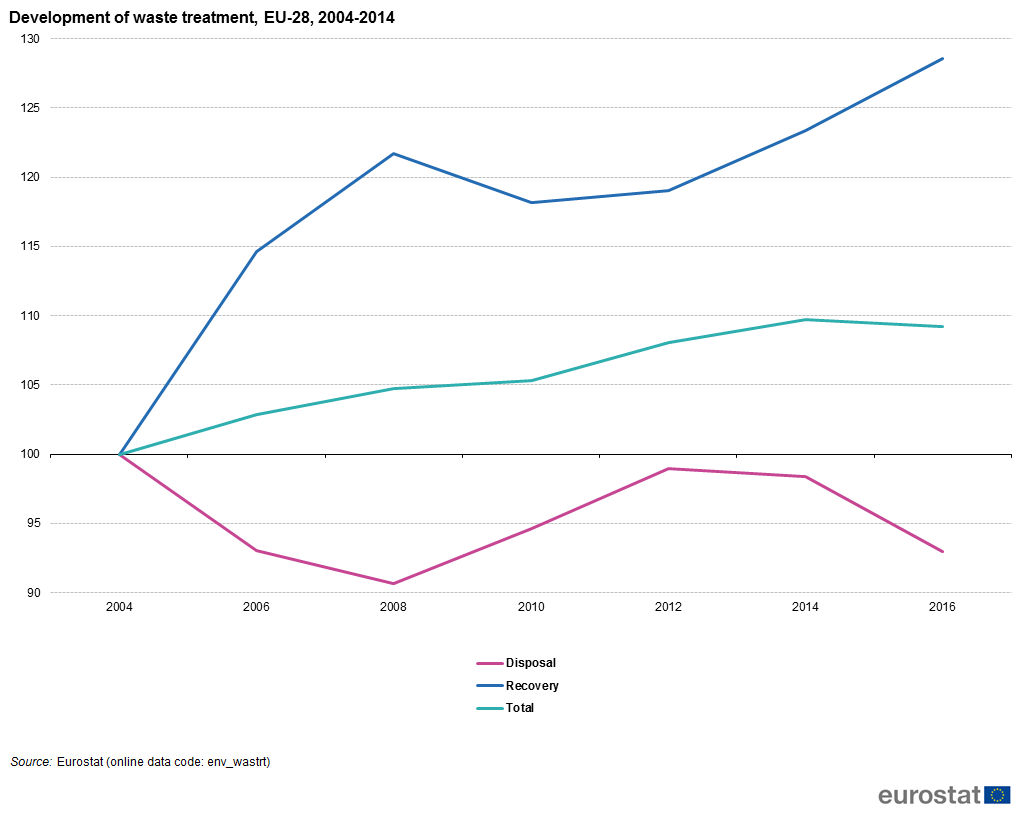
Development of waste treatment, EU-28, 2004-2014.png
(
file
)
29 KB
1
19:37, 20 November 2018
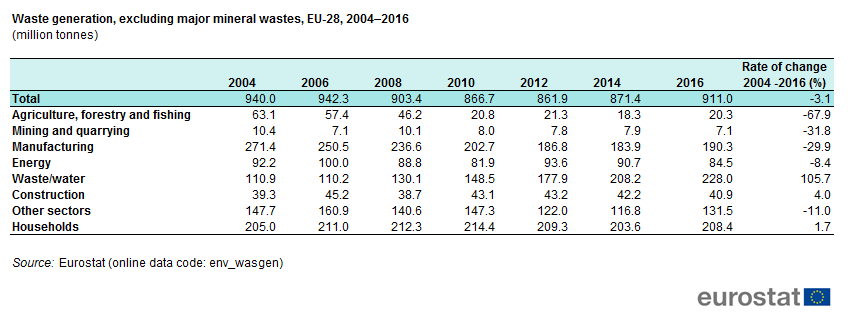
Waste generation, excluding major mineral wastes, EU-28, 2004–2016 (million tonnes).png
(
file
)
23 KB
1
19:49, 20 November 2018
Development of waste treatment, EU-28, 2004-2016 (2004 = 100).png
(
file
)
29 KB
1
09:48, 21 November 2018
Development of waste treatment, EU-28, 2004-2016 (2004 = 100) .png
(
file
)
29 KB
4
16:09, 21 November 2018
Waste statistics ref year 2016.xlsx
(
file
)
144 KB
1
14:15, 22 January 2019
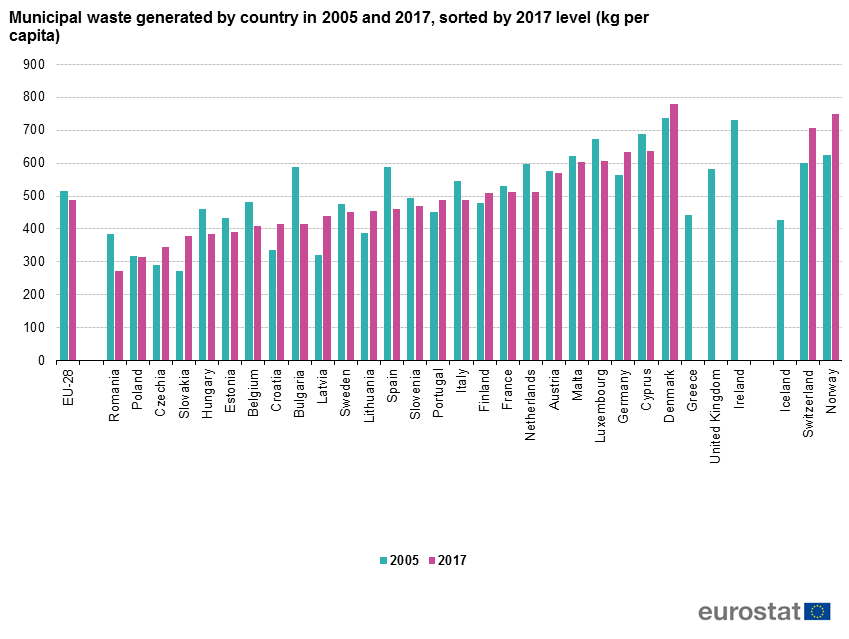
Municipal waste generated by country in 2005 and 2017, sorted by 2017 level (kg per capita).png
(
file
)
49 KB
1
14:16, 22 January 2019
Municipal waste generated by country in selected years (kg per capita).png
(
file
)
43 KB
16
14:20, 22 January 2019
Municipal waste treatment, EU-28, (kg per capita)1995 to 2017.png
(
file
)
28 KB
1
14:43, 22 January 2019
MW EU 28 20190121.xlsx
(
file
)
54 KB
1
14:56, 22 January 2019
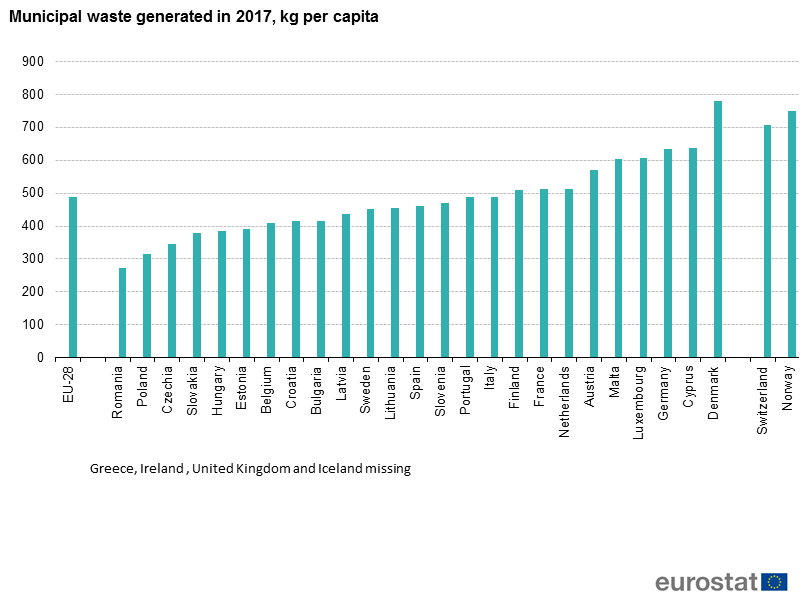
Municipal waste generated in 2017, kg per capita .png
(
file
)
34 KB
1
14:25, 26 June 2019
Copy of Waste statistics 2019-06.xlsx
(
file
)
135 KB
1
13:44, 23 January 2020
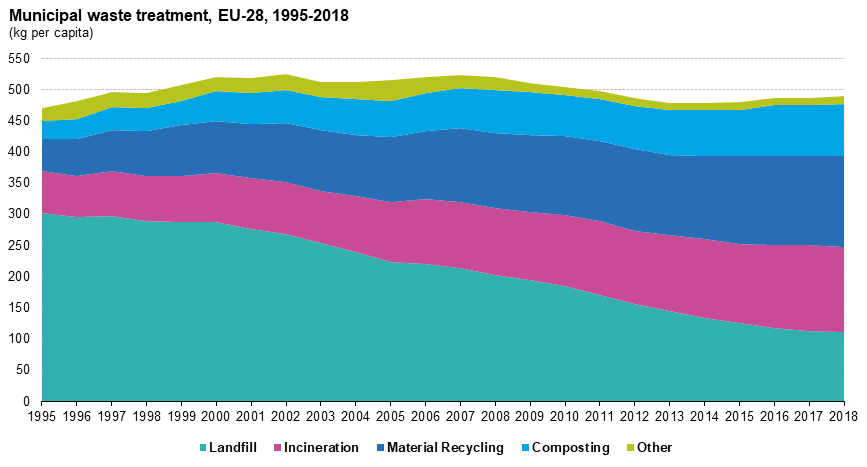
Municipal waste treatment, EU-28, 1995-2018 (kg per capita).png
(
file
)
28 KB
1
15:30, 23 January 2020
Municipal Waste 2020-01-23.xlsx
(
file
)
49 KB
1
First page
Previous page
Next page
Last page
Special page
ISSN 2443-8219
nw1.png)
_new1.png)


_.png)


_1.png)
_1.png)
_1.png)
,_2015.png)
,_2015.png)


.png)

.png)
_.png)
_.png)

.png)
.png)
.png)

.png)
.png)
_.png)
.png)
.png)
1995_to_2017.png)

.png)