Data extracted in March 2025
Planned article update: March 2026
Highlights
In 2023, life expectancy at birth in the EU was 81.4 years, up from 80.6 in 2022.
In 2023, the EU region with the highest life expectancy at birth was the Spanish region of Comunidad de Madrid (86.1 years).
For women, life expectancy at birth in the EU was 84.0 years in 2023, while for men it was 78.7 years.

This article provides information relating to mortality and life expectancy in the European Union (EU) based on official statistics up until 2023.
Life expectancy at birth has risen rapidly during the past century due to a number of factors. These include a reduction in infant mortality, rising living standards, improved lifestyles and better education, as well as advances in healthcare and medicine. Official statistics reveal that life expectancy has risen, on average, by more than two years per decade since the 1960s. In 2020, however, after the outbreak of the COVID-19 pandemic, this indicator declined in 25 EU countries compared to 2019, the exceptions being Denmark and Cyprus. In 2023, life expectancy at birth was equal to or higher than in 2019 in 21 EU countries. By contrast life expectancy fell in 6 EU countries: Finland (-0.5 years), the Netherlands (-0.3 years), Germany (-0.2 years) to Italy, Latvia and Austria (all -0.1 years).
Number of deaths
Over the last 4 decades, the number of deaths in the EU oscillated between 4.18 and 4.37 million until 2011, when the number started to increase, reaching 4.69 million in 2018. Then, with the outbreak of the COVID-19 pandemic, in 2020 a total of 5.18 million deaths was recorded in the EU, increasing to 5.30 million in 2021. In 2023, 4.86 million persons died in the EU (see Figure 1). In the EU the crude death rate, which is the number of deaths per 1 000 persons, increased from 10.4 in 2019 to 11.9 in 2021, and was estimated at 10.8 in 2023.
Life expectancy at birth
The most commonly used indicator for analysing mortality is life expectancy at birth, i.e. the mean number of years that a person can expect to live at birth if subjected to current mortality conditions throughout the rest of their life. It is a simple but powerful way of illustrating the developments in mortality.
Life expectancy at birth in the EU was estimated at 81.4 years in 2023 (0.8 years higher than in 2022), reaching 84.0 years for women (0.7 higher than in 2022) and 78.7 years for men (0.8 higher than in 2022). As shown in Figure 2, between 2002 (the first year for which life expectancy data became available for all EU EU countries) and 2019, life expectancy at birth in the EU increased by 3.7 years, from 77.6 to 81.3 years; the increase was 3.1 years for women and 4.2 years for men. With the outbreak of the COVID-19 pandemic in 2020, life expectancy at birth in the EU decreased by 0.9 years to 80.4; the decrease was -1.0 year for men and -0.8 years for women. Life expectancy at birth further decreased in 2021 to 80.1 and increased in 2022 to 80.6 years.
In 2023 there was a significant increase in life expectancy in all EU countries (see Table 1 and Table 2) compared with 2022. The largest increases in total life expectancy at birth (males and females) were recorded in Lithuania (+1.8 years), Bulgaria (+ 1.6 years) and Romania (+1.3 years) compared with 2022. With that increase, life expectancy at birth was the same as in 2019, before the outbreak of the COVID-19 pandemic.
Across the EU regions, in 2023, the highest life expectancy at birth was in the Comunidad de Madrid (86.1) in Spain, followed by Provincia Autonoma di Trento in Italy and Åland in Finland (both 85.1). The EU region with the lowest life expectancy at birth was in Bulgaria: Severozapaden (73.9), followed by Észak-Magyarország in Hungary and Mayotte (France), both at 74.9. (See Map 1) Compared with 2022, La Réunion in France recorded the highest increase in life expectancy at birth (+2.3 years), followed by Åland in Finland and Severen tsentralen in Bulgaria (+2.0 years). On the other side, life expectancy at birth decreased between 2022 and 2023 in only 2 regions: Groningen (Netherlands) and Ciudad de Melilla (Spain) (both -0.1 years).
Life expectancy at age 65
Table 2 shows that in 2023 life expectancy at age 65 in the EU was estimated at 20.2 years, an increase by 0.7 years compared with 2022. For women, it reached 21.8 years (up by 0.7 years from 2022), while for men it was 18.3 years (up by 0.6 years). In 2023, life expectancy at age 65 increased in all EU countries for both men and women. The highest value was observed in Spain (22.0 years) and the lowest in Hungary (16.8 years). For women, the highest figure was in Spain (23.9 years) and the lowest in Hungary (18.6 years) while for men the highest was in France and Luxembourg (both at 19.9 years) and the lowest was in Latvia (14.4 years). The highest increase between 2022 and 2023 was observed in Bulgaria (+1.5 years for women and +1.4 years for men) while the smallest increases were recorded in Luxembourg (0.2 years for women and 0.3 years for men), the Netherlands (0.2 years for both women and men) and Sweden (0.3 years for women and 0.2 years for men).
Looking at the EU regions, in 2023, the region Comunidad de Madrid in Spain recorded the highest life expectancy at age 65 (23.6 years), followed by Ile de France in France (23.3 years) and Castilla y Leon in Spain (22.8 years) (Map 2). By contrast, the lowest life expectancy at regional level at age 65 was observed in Severozapaden in Bulgaria (15.9 years), followed by Észak-Magyarország (Hungary) and Mayotte (France) (both at 16.1 years).
Gender gap in life expectancy
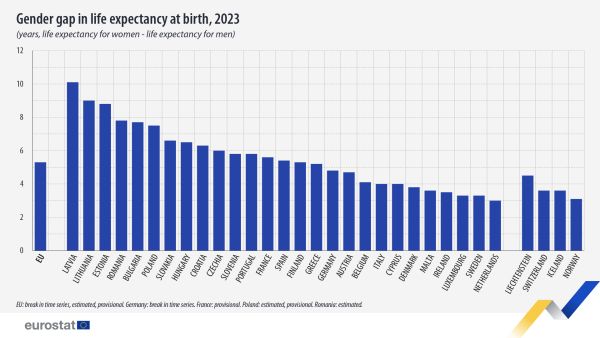
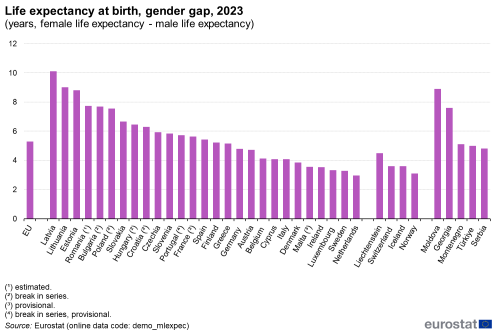
There are major differences between countries when looking at the life expectancy of men and women. In 2023, life expectancy for women was higher than life expectancy for men as in previous years. With a gender gap of 5.3 years in 2023, newly born girls in the EU could generally expect to outlive boys. Furthermore, this gender gap in life expectancy varied substantially between EU countries. The largest difference between the sexes was found in Latvia (10.1 years) and the smallest in the Netherlands (3.0 years). In 14 countries this gender gap in life expectancy was above the EU average — see Figure 3. As in the previous years the gender gap narrowed in the EU in 2023 (from 5.4 years in 2022 to 5.3 in 2023), as well as in 9 countries.

Source: Eurostat (demo_mlexpec)
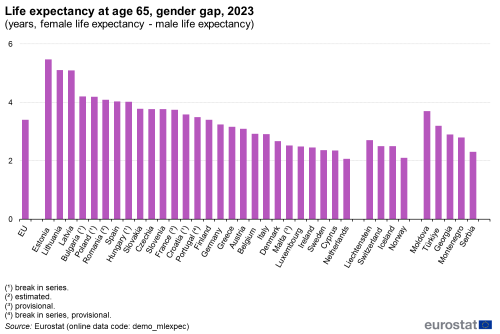
When looking at life expectancy at age 65, the gap between the sexes is smaller than the gap at birth. In 2023, women aged 65 in the EU could generally expect to outlive men by 3.5 years. The largest difference between the sexes in 2023 was found in Estonia (5.5 years) and the smallest in the Netherlands (2.1 years) — see Figure 4.

(years, female life expectancy - male life expectancy)
Source: Eurostat (demo_mlexpec)
Infant mortality
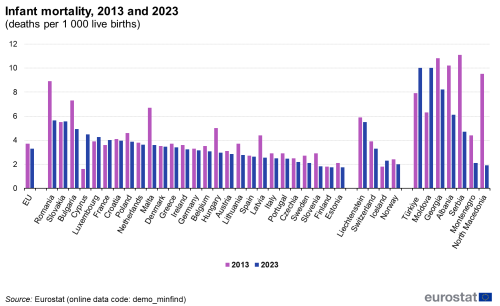
Around 12 280 children died before reaching one year of age in the EU in 2023 (594 fewer infant deaths than in the previous year, down by -4.6 %); this was equivalent to an infant mortality rate of 3.3 deaths per 1 000 live births. Compared with 2019, the last year before COVID-19, the infant death toll dropped by 1819 deaths in 2023 (down by 12.9 %).

(deaths per 1 000 live births)
Source: Eurostat (demo_minfind)
One of the reasons for the increase in life expectancy at birth in the EU has been the decrease in infant mortality rates. Between 2013 and 2023, the infant mortality rate in the EU fell from 3.7 deaths per 1 000 live births to 3.3 deaths per 1 000 live births. When extending the analysis to the last 24 years, the infant mortality rate has almost halved (6.2 deaths per 1 000 in 1999). The most significant reductions in infant mortality were generally recorded within those EU countries that tended to record higher levels of infant mortality in earlier years when compared with the EU average. Overall, the decrease in infant mortality rates was one of the factors contributing to higher life expectancies at birth over the same period.
In 2023, the highest infant mortality rates in the EU were registered in Romania and Slovakia (both at 5.6 deaths per 1 000 live births) and the lowest was recorded in Estonia (1.7 deaths per 1 000 live births).
Source data for tables and graphs
Data sources
Eurostat provides information on a wide range of demographic data, including statistics on the number of deaths by sex, by age, by year of birth, as well as according to citizenship, country of birth and educational attainment; statistics are also collected for infant mortality and late foetal deaths. A series of mortality indicators are produced, which can be used to derive a range of information on subjects such as crude death rates or life expectancy measures by age, sex or educational attainment.
Context
For over two decades, the gradual increase in life expectancy in the EU has been one of the main factors contributing to the ageing of the EU population — alongside relatively low levels of fertility that have persisted for decades (see the articles on population structure and ageing and fertility statistics).
The outbreak of the COVID-19 pandemic, in 2020, will have a lasting impact on the way we live and work together. The outbreak came at a time when Europe had already been going through a period of profound demographic and societal change. On 17 January 2023, the European Commission published the Staff Working Document on The impact of demographic change in a changing environment that provides further analysis of the demographic consequences of the COVID-19 pandemic. More information of the work of the European Commission 2024-2029 can be found in the European Commission dedicated pages.
Explore further
Other articles
Thematic section
Publications
- All publications in demography, population stock and balance
- Demography of Europe - 2024 edition
- Key figures on the EU in the world - 2023 edition
- The impact of demographic change in a changing environment
- The life of women and men in Europe - 2022 interactive edition
- Regions in Europe - 2024 edition
- Ageing Europe - 2021 interactive edition
- 2020 Report on the impact of demographic change
Visualisation
Methodology
- Mortality (ESMS metadata file - demo_mor_esms)
- Population (ESMS metadata file — demo_pop_esms)


