Data extracted in March 2025
Planned article update: 27 February 2026
Highlights
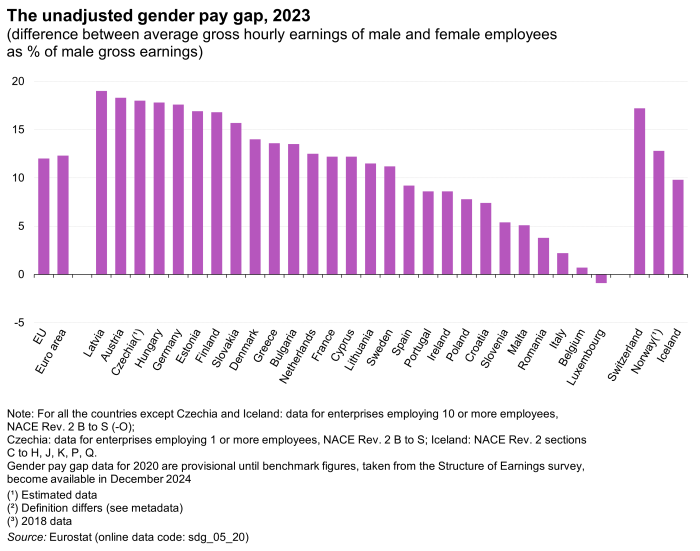
In 2023, women's gross hourly earnings were on average 12.0% below those of men in the EU.
In 2023, the highest gender pay gap in the EU was recorded in Latvia (19.0%) and the lowest in Luxembourg (-0.9%).
The unadjusted gender pay gap, 2023 (difference between average gross hourly earnings of male and female employees as % of male gross earnings)
This article provides a brief overview of gender pay gap (GPG) statistics, including the unadjusted gender pay gap used to monitor imbalances in earnings between men and women. The unadjusted gender pay gap is defined as the difference between the average gross hourly earnings of men and women expressed as a percentage of the average gross hourly earnings of men. It is calculated for enterprises with 10 or more employees.
Gender pay gap levels vary significantly across EU
For the economy as a whole[1], in 2023, women's gross hourly earnings were on average 12.0% below those of men in the European Union (EU) and 12.3% in the euro area. Across EU countries, the gender pay gap varied by 20.0 percentage points, ranging from -0.9% in Luxembourg to 19.0% in Latvia (Figure 1).
Source: Eurostat (sdg_05_20)
Part-time versus full-time employment
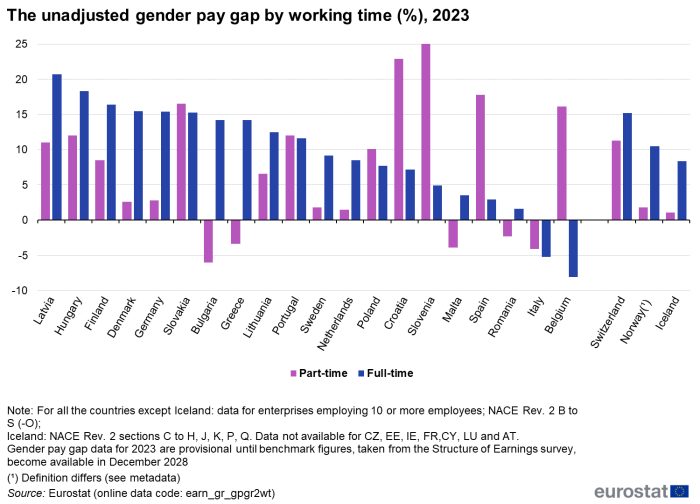
Pay gaps can also be analysed from the perspective of part-time or full-time employment (Figure 2). However, information at this level of detail is not available for all EU countries.In 2023, the gender pay gap for part-time workers varied from -6.0% in Bulgaria to 27.3% in Slovenia. A negative gender pay gap means that, on average, women's gross hourly earnings are higher than those of men. This is often due to a selection bias, especially when the employment rate is lower for women than for men: women engaging in the labour market may have comparatively higher skills and education levels than men. For full-time workers, pay gaps varied also widely in the EU countries, ranging from -8.1% in Belgium to 20.7% in Latvia.
Source: Eurostat (earn_gr_gpgr2wt); see Country codes
Gender pay gap much lower for young employees
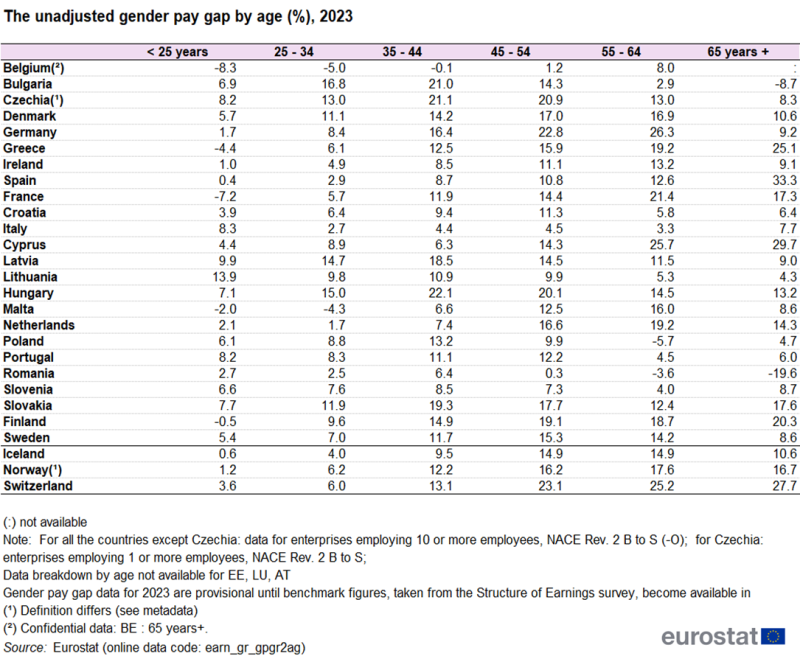
The gender pay gap is generally much lower for new labour market entrants and tends to widen with age. However, those differences over age groups can have different patterns across the EU countries (Table 1). The gender pay gap might increase with age as a result of the career interruptions women may experience during their working life. Information at this level of detail is not available, however, for all EU countries.
Source: Eurostat (earn_gr_gpgr2ag); see Country codes
Highest gender pay gap in financial and insurance activities
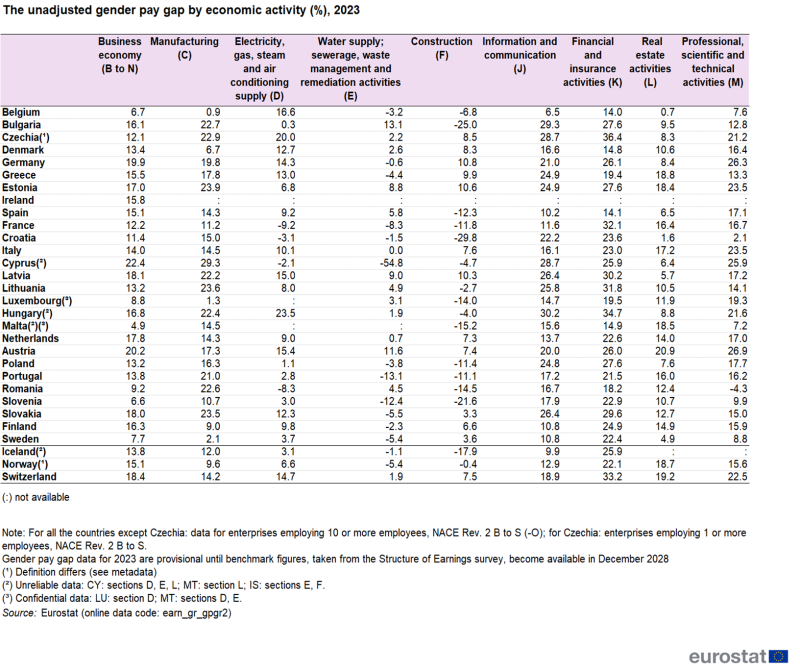
A breakdown for the different sectors of the economy also reveals interesting patterns (Table 2). However, information at this level of detail is not available for all EU countries. In the EU countries where data is available except Spain, the gender pay gap in financial and insurance activities (NACE Rev. 2 section K) is higher than in the business economy as a whole (NACE Rev. 2 aggregate B to N). In 2023, the gender pay gap in financial and insurance activities varied from 14.0% in Belgium to 36.4% in Czechia. Within the business economy as a whole, the lowest gender pay gap was recorded in Malta (4.9%) and the highest in Cyprus (22.4%).
Source: Eurostat (earn_gr_gpgr2); see Country codes
It is also interesting to note the economic sectors for which a significant number of EU countries recorded negative gender gaps. In particular, 12 EU countries registered negative gender pay gaps in the water supply, sewerage, waste management and remediation activities (NACE Rev. 2 section E) and fourteen in the construction sector (NACE Rev. 2 section F).
Gender pay gap higher in the private sector
In 2023, all EU countries (for which data are available) except Hungary and Slovenia recorded a higher gender pay gap (in absolute terms) in the private sector than in the public sector (Table 3). This might be due to the fact that, in most EU countries, pay in the public sector is determined by transparent wage grids that apply equally to men and women. The gender pay gap varied in the private sector from 6.1% in Belgium to 21.6% in Cyprus, and in the public sector from -4.1% in Cyprus to 19.7% in Hungary.
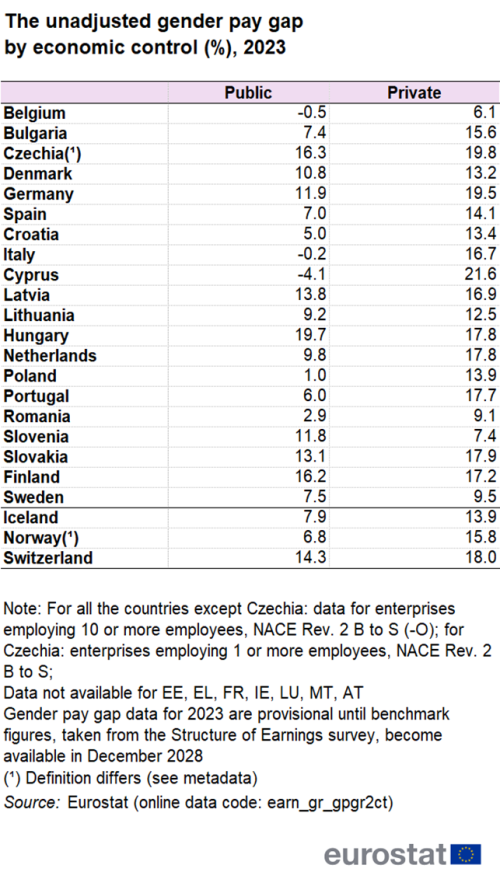
Source: Eurostat (earn_gr_gpgr2ct); see Country codes
Possible causes of the unadjusted gender pay gap
As an unadjusted indicator, the gender pay gap gives an overall picture of the differences between men and women in terms of earnings and measures – a concept which is broader than discrimination in the sense of "equal pay for work of equal value". Indeed, parts of the difference in earnings of men and women can be explained by (1) differences in the average characteristics of male and female employees and (2) differences in the financial returns for the same characteristics. In the methodological study: Gender pay gaps in the European Union – 2025 edition, both drivers of the unadjusted gender pay gap are analysed based on the 2022 edition of the four-yearly Structure of Earnings Survey (SES).
Data sources
From reference year 2006 onwards, the unadjusted gender pay gap is based on the methodology of the Structure of earnings survey (SES) according to Regulation (EC) No 530/1999. The SES is carried out with a four-yearly periodicity. The most recent reference years available for the SES are 2018 and 2022. Eurostat computed the gender pay gap for these years on this basis. For the intermediate years, EU Member States provide Eurostat gender pay gap estimates benchmarked on the SES results.
Source data for tables and graphs
Context
Reducing the gender pay gap is one of the key priorities of gender policies at both EU and national levels. At EU level, the European Commission prioritised "reducing the gender pay, earnings and pension gaps and thus fighting poverty among women" as one of the key areas in the framework of the A Union of Equality: Gender Equality Strategy 2020-2025. The unadjusted gender pay gap indicator is used to monitor imbalances in earnings between men and women.
Footnotes
Explore further
Database
- Earnings
- Gender pay gap in unadjusted form (earn_grgpg)
- Gender pay gap in unadjusted form - Nace rev.2 (earn_grgpg2)
- Gender pay gap in unadjusted form - Nace rev.1.1 (earn_grgpg1)
- Gender pay gap in unadjusted form (earn_grgpg)
Thematic section
Publications
Methodology
- Gender pay gap in unadjusted form - Nace Rev. 2 (ESMS metadata file - earn_grgpg2_esms)
- Structure of earnings survey (ESMS metadata file - main indicators)
- A decomposition of the unadjusted gender pay gap using Structure of Earnings Survey data (Collection: Statistical working papers)
Legislation
External links
- Equal Pay - the gender pay gap in the EU, how the EU fights pay discrimination, actions for improving pay equality.
- European Commission - Justice
- Eurofound
- European Institute for Gender Equality (EIGE)
Selected datasets
- Gender pay gap in unadjusted form (sdg_05_20)
