How to manage tables
In the data display part of the Data Browser, choose the table display option:

Limitations
When viewing data in the table display, the following limitations apply:
- maximum amount of columns (including breakdown if used) is 2 000
- maximum amount of rows (including breakdown if used) is 2 000
- maximum amount of cells is 120 000
If these limits are exceeded, an error message will appear.
This limitation adds up to the interactivity limit (see this page)
Special value and flags
The following can appear in the table display:
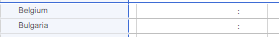
- special value: this is a value that can be present in data cells. It does not represent a statistical data value, but replace them. The only existing special values is a colon (:), which means that there is no data available in this cell. For example: In this example below, no data is available for Belgium and Bulgaria
- flags: provide additional information about a specific statistical data. When present, the flag is visible behind the data value in the cell of the table. Please consult the table providing the meaning for each available flags. An explanation of those flags used in the current selection of a table is available below the table display

Please note: Flags can also be combined, for example a data value in a cell can be marked with (ep), meaning the value should be understood as being an estimate (flag 'e') and provisional (flag 'p').
Display settings
The display settings button is located on the upper right-hand side of the data display section of the Data Browser.

Clicking on 'Display settings’ will open a pop-up. Using the options displayed, you can customise many display features to get to the desired result. There are 2 kind of format options:
- general settings: these options apply to all the data display options (table, line, bar and map)
- table-specific settings: each data display option has specific formatting possibilities
These can be distinguished by their headings displayed in the pop-up:

General settings
For more information on the general options and their settings, please refer to our section on how to use the display settings.
Table-specific settings
In the table display, you have the following specific options, as presented in the left side tabs of the pop-up:

Show empty rows and columns
Toggles the display of empty rows and columns on or off.
When you are done, please either move on the next tab in the left-side menu or click on the button 'Apply' located at the bottom right-hand side of the pop-up.
Once this setting is active, an information pop-up appears to inform you that this change has been applied in your table display:

In the table view, these rows and / or columns have now been hidden:

Colour palette
You can change this to mono-colour or contrasted colour.
Data displayed
Under this tab, you can set the following options:

Highlighted
The first option in the list called 'highlighted' allows the table to display the positions currently highlighted, based on highlighting done by you in another display mode or in the current table display.
In the table view, this mode is applied only to positions of the dimension which is displayed in the row. It is not possible to highlight positions in the column. To change the dimensions set in the row, please consult our chapter on how to customise the layout.
In order to highlight positions in the table view, you need to close the format options and click on the 'Highlight' button located on the top right-hand side of the table display.

This will open a box which shows the positions of the dimension which is displayed in the row of the table layout. Then you can select the positions that you wish to highlight. In the example below, for the 'Geopolitical entity', which is the dimension located in the row of the table layout, the European Union and Belgium have been selected to be highlighted:

This results in these countries being highlighted in the table view by adding a thicker line behind the cells in that row.

In case, you selected the format option 'Highlighted', but did not define any positions that you wish to highlight, an information box will appear:

The following rules will apply, depending on which dimension you have selected to be displayed in the row of the table:
- geopolitical entity (GEO) dimension (or with a related dimension): if aggregates for the EU and euro area (EA) have been selected, the current EU and EA aggregates are highlighted.
- GEO dimension (or with a related dimension): if no aggregates for the EU and EA have been selected, the data series with the highest value of the most recent time period is taken, first among the EU member states or then on the full selection. We do not recommend to apply this, but to go into the highlighting option and choose a more meaningful approach.
- non-GEO dimension: the series having the highest value of the most recent time period is taken.
Summary
The second option in the list called 'summary' allows the table to display a summarised version of the selected data.
The summary is built on the following principles:
- Among the selected positions, the following positions are the only ones displayed in the table, on the basis of the last available statistical data for each row:
- top 8 rows
- 8 average middle rows
- Bottom 8 rows
- In this mode, all the other rows are hidden.
- Rows corresponding to positions for which no statistical data is available at all will not be taken into account into this calculation.
The amount of positions selected does not change. However, only the rows corresponding to the "Top 8 - Middle 8 - Bottom 8" rule exposed above will be displayed. All the other rows are masked. A warning message is also displayed above the table.
Selected
The third and default option in the list called 'selected' allows to display all the positions you selected in the table.
Rows are displayed:
- with a white background if they are not highlighted
- with a background with a small coloured line if they are highlighted
Other layout actions
The following options are available:
- resize the column width: Position the cursor of the mouse on any boundary of the columns headings to make the resize icon appear. Move the boundary to adjust the column width. Double click on the boundary to minimise the column width.
- sort entries: click on the arrows
 displayed next to the label or code in the row or column to change the sorting of the positions:

Available sorting orders for the rows are:- default sorting order, for example, the default sorting order for the geopolitical entity (GEO) dimension is the protocol order
- descending (9→0) / reversed alphabetical (Z → A) sorting order
- ascending (0→9) / Alphabetical (A→Z) sorting order
Available sorting orders for the columns are:- no sorting based on this column (default)
- descending (9→0) sorting order
- ascending (0→9)sorting order
Please note that when sorting, the absence of a value (represented by the colon symbol) is considered greater than any other real data values.