
Identifying indicators of progress for cities and sustainable urban development.

date: 08/03/2017
Why urban data?
More than half of the world’s population and three quarters of Europeans live in an urban area. Cities are nuclei for socio-economic and cultural activity, but they also present acute risks to society, from poverty and social exclusion, to excessive air pollution and flooding. Therefore, cities provide an important scale of analysis, presenting both challenges and opportunities for sustainable development. City indicators offer an instrument for policy makers to support urban sustainability. While public authorities already use a variety of data sources, the emergence of new metrics, and the increasing use of data by citizens, suggests that urban data is more relevant than ever.
A global agenda for sustainable urban development
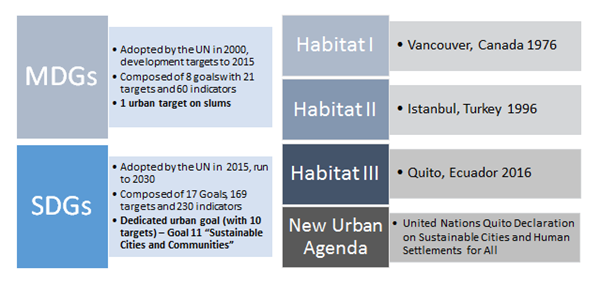
The 2030 Agenda Sustainable Development Goals (SDGs) provide a global framework for sustainable development. Many of the 169 targets in the agenda, and specifically Goal 11 “Make cities inclusive, safe, resilient and sustainable" have an urban dimension. The UN Statistical Commission has agreed on the global indicator framework for the SDGs, a list of 230 indicators that will be adopted by the General Assembly.
Parallel to the SDGs, the most recent United Nations Conference on Housing and Sustainable Urban Development (Habitat III) launched the New Urban Agenda. It provides an agenda for sustainable urban development. As highlighted in the UN’s World Cities Report 2016, in order to achieve their objectives, the New Urban Agenda and the SDGs will have to implement complementary monitoring frameworks. Indicators for the New Urban Agenda are yet to be defined, but it is likely to integrate metrics from the UN-Habitat’s City Prosperity Initiative, which is already being applied in more than 300 cities.
Data for the EU’s urban agenda
The Urban Agenda for the EU was adopted in June 2016, with the aim to increase the cooperation between Member States and the European Commission in order to boost growth, quality of life, and innovation in Europe’s cities. Indeed, the European Union has a number of initiatives that operationalise urban data in order to support its strategic objectives:
- "Making the Union's cities more sustainable" is among the objectives of the EU 7th Environmental Action Programme "Living well within the limits of our planet" (7th EAP), which aims to incentivise policies that prioritise urban sustainability, planning and design;
- The State of European Cities Report 2016 is the outcome of a collaboration between Directorate-General for Regional and Urban Policy (DG REGIO) of the European Commission and the United Nations Human Settlements Programme (UN-Habitat). It analyses the performance of European cities across the themes of the EU’s Urban Agenda with a range of indicators;
- Similarly, the Eurostat report Urban Europe – statistics on cities, towns, and suburbs describes the current state of urban developments and urban life in Europe. The Directorate-General for Regional and Urban Policy report Quality of Life in European Cities 2015 provides an impression of subjective wellbeing based on 40,000 interviews in 79 cities;
- The EU’s Green Capital Award - and the Green Leaf for smaller cities - rely on indicator-based criteria, which inform how winners of the award are chosen (see the Good Practice Report for 2018);
- The Urban Data Platform, a joint initiative of Joint Research Centre and DG REGIO, gathers information on the status of EU cities and regions providing analyses and data for policy-makers;
- Finally, the Science for Environment Report from DG Environment, Indicators for Sustainable Cities, provides a useful summary of a number of urban data frameworks.
Wider initiatives on city data
For the most part, the generation of official-UN and EU-city data is the responsibility of national statistical institutes of EU Member States, often with the cooperation of municipal or subnational authorities. However, beyond legislated responsibilities, city indicator tools are also being developed and published by a range of wider and often private organisations. For example, the Global Green Economy Index published their 2016 results for 50 cities in addition to 80 countries for the first time.
City indicator tools can be based on a single indicator or composite indices with multiple indicators. Additionally, they might blend data from different sources, or be based on primary data such as telephone interviews. This is the case of the ARUP City Resilience Index, which mixes qualitative and quantitative data across 52 indicators. Existing city indicator initiatives often provide a particular focus that will determine the design of the tool, including indicator choice or weighting, as well as audience.
Table 1 – Recent examples of urban indicators frameworks
|
Name |
Year |
Organization |
Coverage |
Indicators |
|
2012 |
Siemens/EIU |
129 cities |
8 dimensions, 30 indicators |
|
|
2015 |
Arup |
27 cities |
4 dimensions,12 goals, 52 indicators |
|
|
2016 |
WCCD |
30 cities |
17 dimensions,100 indicators |
|
|
2016 |
Happy City |
9 largest UK cities |
3 dimensions, 5 well-being domains, 60+ indicators |
|
|
2016 |
Dual Citizens LLC |
80 countries, 50 cities |
4 dimensions, 32 quantitative and qualitative indicators |
|
|
2016 |
Arcadis |
100 cities |
3 dimensions, 32 indicators |
|
|
2016 |
Mercer |
230 cities |
10 dimensions, 39 domains |
|
|
2016 |
UNHABITAT |
400 cities |
6 dimensions, 72 indicators |
A common format for city indexes is to provide a ranking of cities according to a given criteria. The results presented in such frameworks might help to illustrate the successes and failures of cities in a given area, and reflect the growing (and often transboundary) competition which exists amongst cities. The majority of city ranking initiatives focus on economic performance, however, there are an increasing number of tools which rank cities according to their environmental performance (e.g. The Green City Index by Siemens/Economist Intelligence Unit), or for quality of life (e.g. 2016 Happy City Index), as well as a combination of several elements, such as the WCCD Open City Portal. Table 1 provides a non-exhaustive summary of city indicator initiatives from a range of organisations.
Challenges and innovations in measuring urban sustainability
Access to city data provides new opportunities for citizens and decision makers. The ranking and benchmarking of cities, based on their performance, provides a tool for measuring policy effectiveness and can facilitate the exchange of good practice. However, such indicators are not without their limitations. Composite indices summarise the complexity of a city in a single figure, with the risk of excluding their unique geographic, historical and socio-economic situation. Moreover, rankings often fail to create incentives for the least performing cities, while celebrating already successful ones. Anonymous self-assessment methods represent a potential tool to address such limitations.
Many cities are also exploring how they can use sub-city level data, with increasing resolution, to facilitate the delivery of services to their citizens. City ambitions, such as becoming smart, sustainable or global cities, are promoting innovative accounting techniques. These include new data sources such as big data, social media platforms and smart grids. This data can then feed directly into public services, such as public transport management systems, or can be made public through open data initiatives and platforms. Demands for transparency, accountability and citizen participation are closely connected with data services.