Unemployment statistics at regional level
Data extracted in April 2022.
No planned article update.
Highlights
This article provides an overview of regional unemployment rates across the 242 NUTS 2 regions of the EU Member States in 2022. Eurostat compiles these rates based on data from the EU Labour Force Survey. It also presents unemployment rates for the NUTS 2 regions of Norway, Switzerland and Iceland in the maps.
The article also analyses regional male and female unemployment rates for people aged 15-74 years as well as the regional unemployment rates for young people aged 15-29 years. It also examines the long-term unemployment share for each region.
Full article
Regional unemployment rates
Unemployment rates in the EU regions ranged from 1.2 % to 28.4 % in 2022
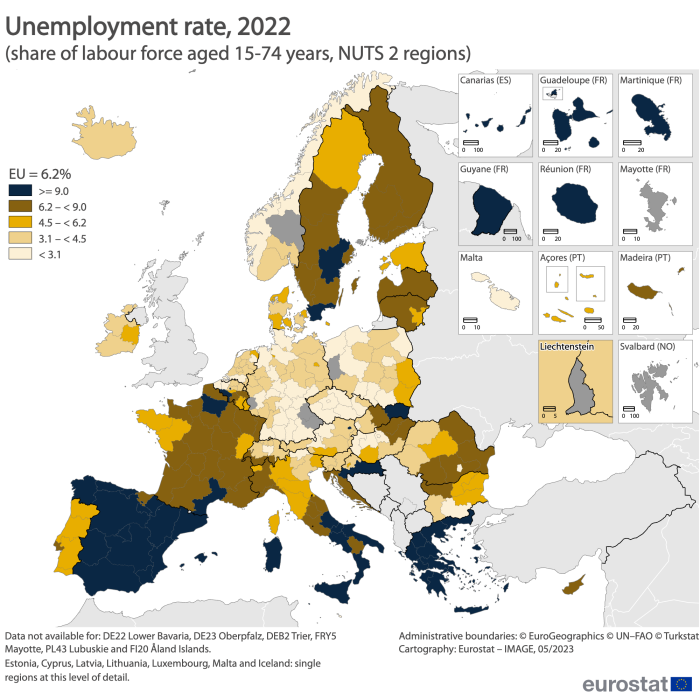
In 2022, when measures to control the COVID-19 pandemic were being lifted across the EU, the unemployment rate of people aged 15-74 years continued to vary widely across the EU's NUTS 2 regions. The lowest unemployment rate was recorded in the Czech regions of Central Bohemia (1.2 %), followed by the region of Prague (1.6 %), the Hungarian region of Central Transdanubia, and the Czech South-East and South-West regions (all three 1.7 %).
(in % of the labour force)
Source: Eurostat (lfst_r_lfu3rt)
At the other end of the scale, the highest unemployment rates were registered in the Spanish regions of Ceuta (28.4 %), Melilla (21.6 %) and Andalusia (19 %), followed by the French outermost regions of Guadeloupe (18.6 %) and of La Réunion (18.1 %).
Around four out of 10 EU regions had an unemployment rate higher than the EU average
In 2022, among the 236 EU regions for which data are available, 94 had an unemployment rate (for people aged 15-74 years) higher than the EU average (6.2 %), and 25 regions had an unemployment rate double than the average (12.4 %); of these, nine regions were in Greece and in Spain, four in France and three in Italy (see Map 1).
By contrast, 50 regions had an unemployment rate of at most 3.1 %, half that of the EU: 19 regions were in Germany, eight in Poland, six in Czechia, four in Hungary, three in the Netherlands, two in Belgium, Romania and Austria each, and one in Bulgaria, Slovakia, Malta and Italy.
Regional unemployment rates differ between men and women
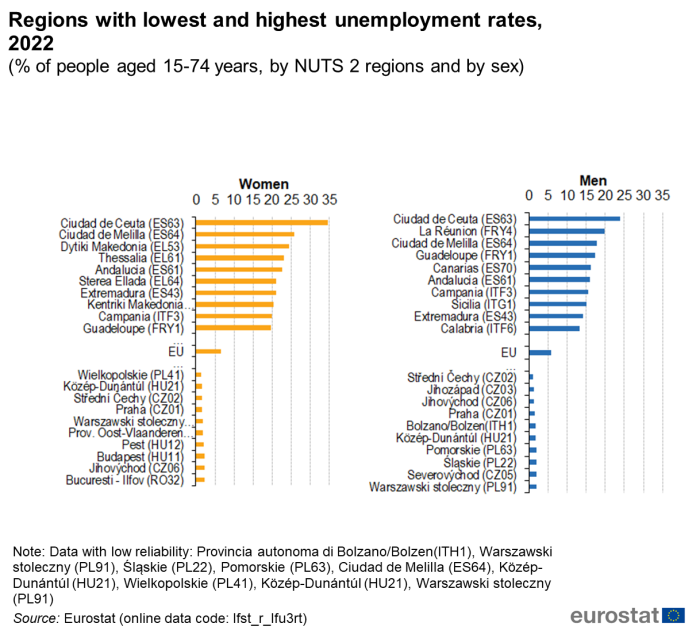
Regions with the highest and lowest unemployment rates vary across sex. In 2022, the 10 highest male unemployment rates were in Spanish, French (outermost) and Italian regions and the three regions with the highest male unemployment rates were the Spanish regions of Ceuta (23.9 %) and Melilla (17.7 %), as well as the French outermost region of Réunion (19.9 %) (see Figure 1). The highest female unemployment rates were mostly in Spanish and Greek regions, and the three with the highest female unemployment rates were the Spanish regions of Ceuta (34.6 %) and Melilla (25.8 %) as well as the Greek West Macedonia (24.4 %).
(in % of the labour force)
Source: Eurostat (lfst_r_lfu3rt)
By contrast, the lowest unemployment rates were mostly recorded in Poland, Hungary, Czechia, and Belgium for women, and in Czechia, Italy, Hungary and Poland for men. The Czech regions of Central Bohemia (1 %), South-West (1.3 %) and South-East (1.4 %) had the lowest male unemployment rates in 2022. The lowest female unemployment rates were recorded in the Polish region of Wielkopolskie (1.4 %), followed by the Hungarian region of Central Transdanubia (1.5 %) as well as the Central Bohemia region and Prague both with 1.6 % in Czechia. By way of comparison, the EU unemployment rate was 5.9 % for men and 6.5 % for women in 2022.
Regional differences more pronounced in Spain, Italy and France
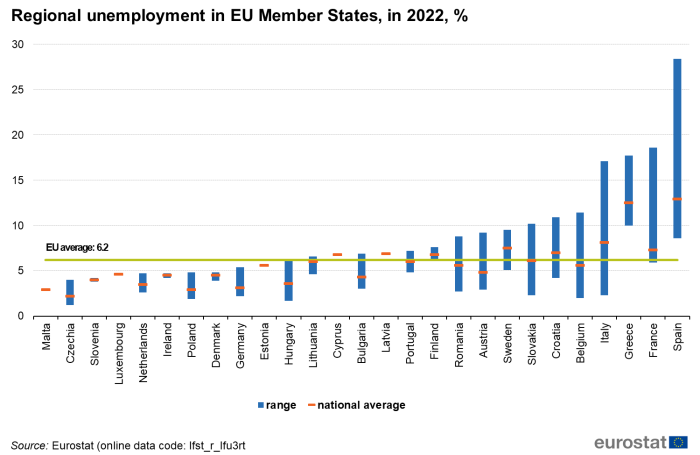
When comparing the unemployment rates across regions in each country (see Figure 2), Spain has the largest gap among its regions, the difference between the highest and lowest unemployment rates in 2022 was 19.8 percentage point (pp). Italy and France followed with gaps of 14.8 pp and 12.7 pp respectively.
(in % of the labour force)
Source: Eurostat (lfst_r_lfu3rt)
Figure 2 also shows that all Spanish and Greek regions had an unemployment rate above the EU average (6.2 %), together with those of Finland as well as Cyprus and Latvia (both only one region in the country). By contrast, unemployment was below the EU average for all regions in Malta (one region), Czechia, Slovenia, Luxembourg (one region), the Netherlands, Ireland, Poland, Denmark, Germany and Estonia.
Decrease in unemployment after recovery from COVID-19
EU unemployment fell from 7.0 % in 2021 to 6.2 % in 2022 – a decrease of 0.8 pp After the COVID-19 outbreak, EU unemployment started to decrease after having increased in the majority of the EU NUTS 2 regions in 2020 compared with 2019 due to COVID-19.
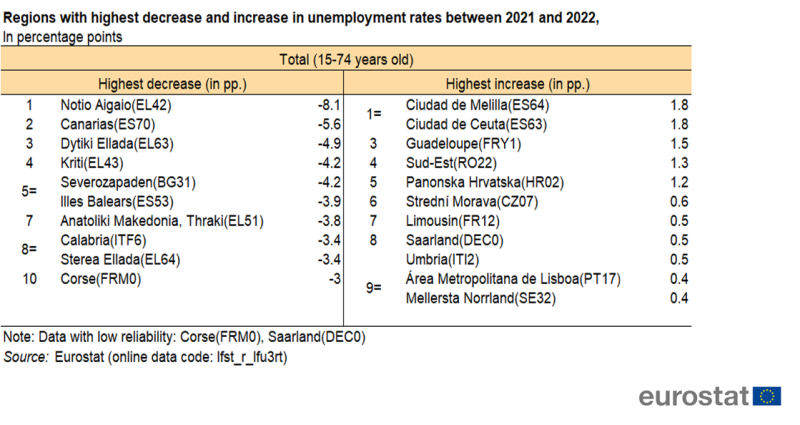
(in percentage points)
Source: Eurostat (lfst_r_lfu3rt)
Compared with 2021, the highest decreases in the unemployment rate were recorded in the Greek regions of Notio Aigaio (-8.1 pp), in the Spanish Canary Island (-5.6 pp), and Greek Dytiki Ellada region (-4.9 pp) On the other hand, the three highest increases in the last year were in the Spanish regions of Melilla and Ceuta (both 1.8 pp), and in the French outermost region of Guadeloupe (1.5 pp) (Table 1).
Regional variations in youth unemployment
Youth unemployment rates lowest in Czech and Polish regions
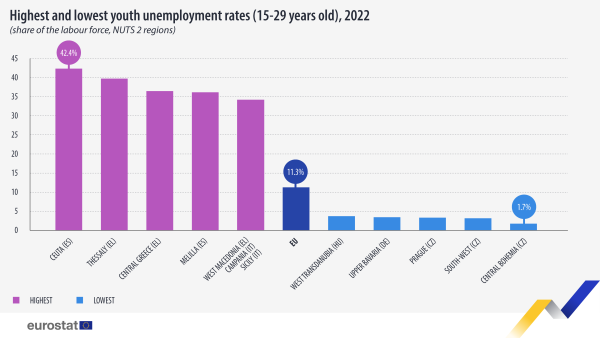
In 2022, the average unemployment rate for young people aged 15-29 years in the EU was 11.3 %, a 1.7 pp decrease over 2021. However, there are marked regional differences in the unemployment rates for young people (see Map 2), ranging from 1.7 % to 42.4 % in 2022.
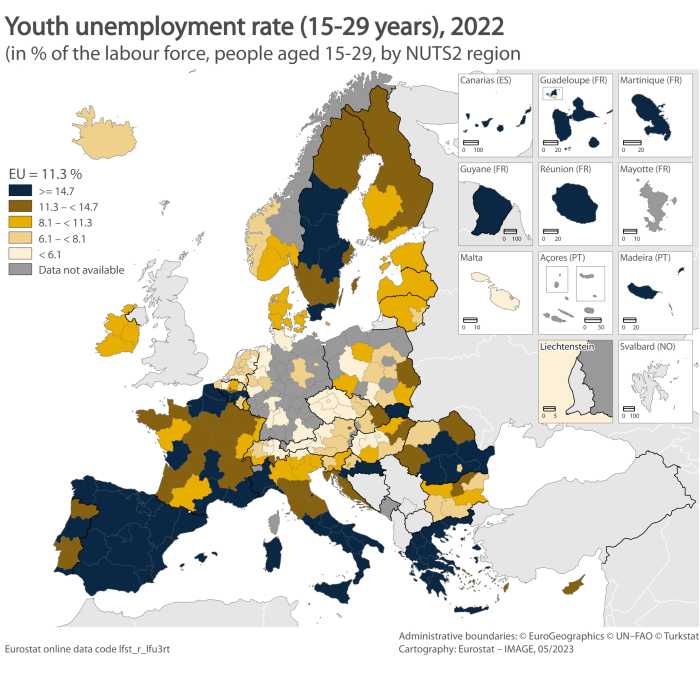
(in % of the labour force)
Source: Eurostat (lfst_r_lfu3rt)
The lowest youth unemployment rates were recorded in the Czech regions of Central Bohemia (1.7 %), South-West (3.1 %) and Prague (3.2 %), the German region of Upper Bavaria (3.3 %) and the Polish region of West Transdanubia (3.6 %).
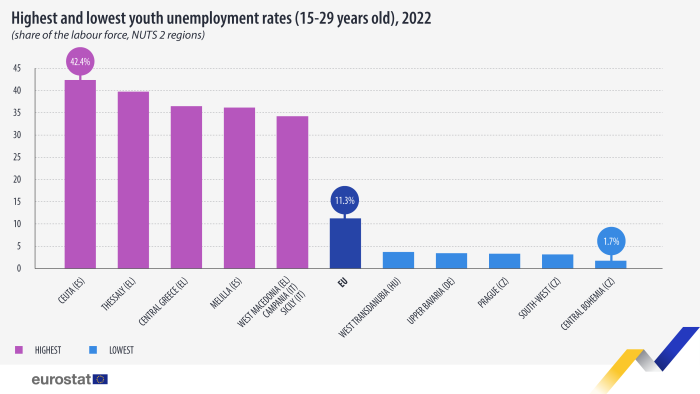
(in % of the labour force)
Source: Eurostat (lfst_r_lfu3rt)
By contrast, the highest youth unemployment rate was recorded in the Spanish region of Ceuta (42.4 %), followed by the two Greek regions Tessaly (39.8 %), Central Greece (36.5 %) and the Spanish region of Melilla (36.1 %). The Greek region of West Macedonia, and the Italian regions of Campania and Sicilia, also had a high youth unemployment rate with 34.3 % each(see Figure 3).
Compared with 2021, unemployment for people aged 15-29 years in 2022 decreased the most in the Greek and Spanish regions
The top five regions with the highest decreases in the unemployment rate for young people aged 15-29 years between 2021 and 2022 are in Greece and Spain: the Greek regions of South Aegean (-17.9 pp) and East Macedonia, Thrace (-15.4 pp), the Spanish regions of Ceuta (-13.6 pp) and Canary Islands (-10.3 pp), and the Greek Peloponnese (-8.4 pp) (see Table 2).
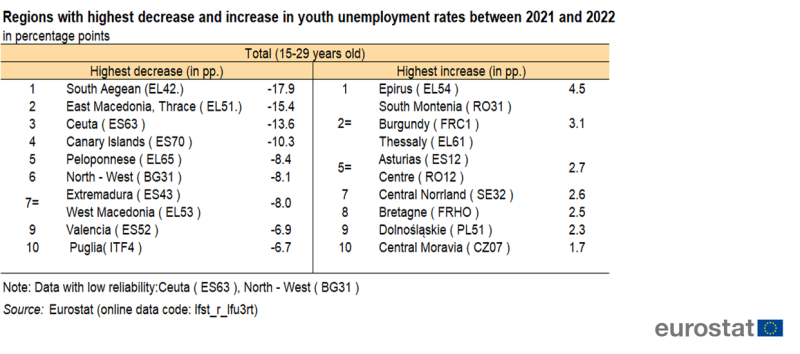
(in percentage points)
Source: Eurostat (lfst_r_lfu3rt)
On the other hand, the highest increases were in the Greek region of Epirus (+4.5 pp), the Romanian region of South-Muntenia, the French region of Burgundy and the Greek Thessaly, all with +3.1 pp increase. Following are the Spanish region of Asturias and the Romanian Centre region, both with 2.7 pp increase.
Long term unemployment in the EU regions
South Europe has higher shares of long-term unemployment than EU average
The long-term unemployment share, defined as the percentage of unemployed people who have been unemployed for 12 months or more, stood at 38.5 % on average in the EU (for people aged 15-74 years) in 2022, 0.7 pp lower than the year before (39.2 %).
The EU regions with the highest shares of long-term unemployment in 2022 were in Greece, Bulgaria, Italy, Slovakia and Romania – almost all countries from South Europe (see Map 3).
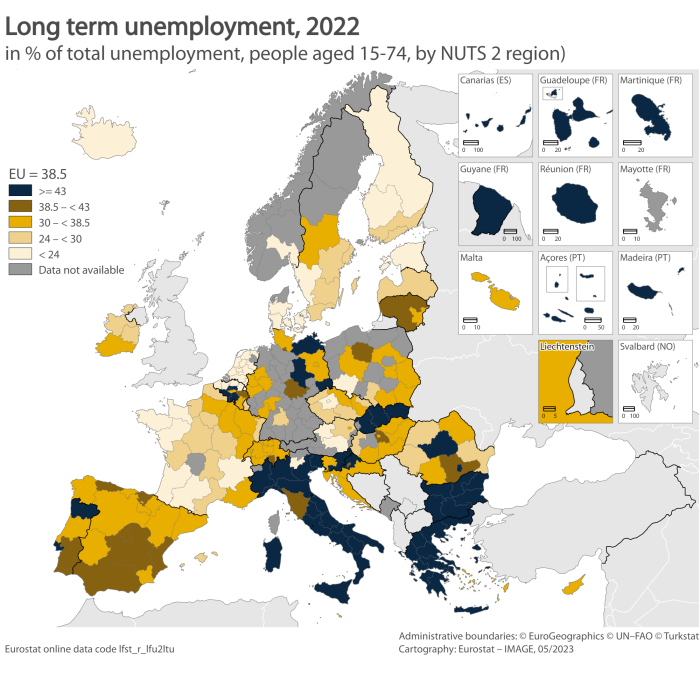
(in % of total unemployment)
Source: Eurostat (lfst_r_lfu2ltu)
In the detailed ranking, the highest shares were recorded by Central Greece (Sterea Ellada) (81.2 %), North-West region (75.6 %) in Bulgaria, East Macedonia, Thrace (71.8 %) and Central Macedonia (71.3 %) in Greece, as well as East Slovakia (70.8 %) in Slovakia (see Figure 4).
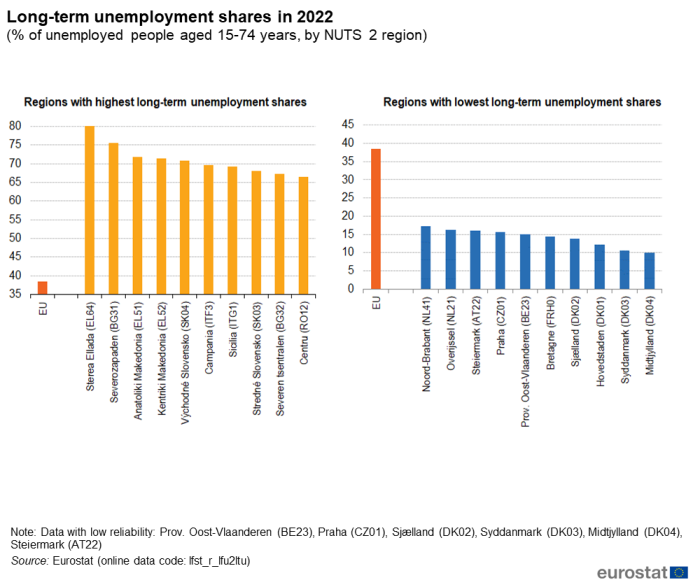
(in % of total unemployment)
Source: Eurostat (lfst_r_lfu2ltu)
The EU regions with the lowest shares of long-term unemployment were, North Brabant (17.3 %) and Overijssel (16.2 %) in the Netherlands, Styria (16.0 %) in Austria, Prague (15.6 %) in Czechia and East Flanders (15.0 %) in Belgium.
Source data for tables and graphs
Methods and definitions
Data sources
All figures in this article are based on annual results from the EU European Union Labour Force Survey (EU-LFS).
The EU-LFS is the largest European household sample survey providing quarterly and annual results on labour participation of people aged 15 years and over as well as on persons outside the labour force. It covers residents in private households. Conscripts in military or community service are not included in the results. The EU-LFS is based on the same target population and uses the same definitions in all countries, which means that the results are comparable between countries.
With regard to the European aggregates, EU refers to the sum of the 27 EU Member States.
Definitions
The concepts and definitions used in the Labour Force Survey follow the guidelines of the International Labour Organisation (ILO).
The unemployment rate is defined as the percentage of unemployed persons aged 15-74 years in the labour force population (which comprises the employed and unemployed persons, but excludes the persons outside the labour force).
According to the ILO recommendations, a person is deemed to be unemployed if all three of the following conditions are met:
- he or she is without work during the survey reference week;
- he or she is available for work, being able to take up employment within two weeks;
- he or she has actively sought work over the past four weeks.
In this article, the youth unemployment rate is defined as the number of people aged 15-29 years unemployed as a percentage of the labour force of the same age.
Being expressed as a percentage of the labour force (and not of the total population) of the same age, the youth unemployment rate should not be interpreted as the share of jobless people in the overall youth population. Youths outside the labour market (for example studying) are neither in the numerator nor the denominator.
Nomenclature of Territorial Units for Statistics (NUTS)
These data are based on the 2021 version of the Nomenclature of Territorial Units for Statistics (NUTS) as set out in the amending Commission Delegated Regulation 2019/1755 of 08 August 2019. NUTS provides a uniform, consistent breakdown of territorial units for the production of European regional statistics. NUTS 2021 applies since 1 January 2021.
NUTS 2021 level 2 has 242 regions in EU Member States: Belgium (11), Bulgaria (6), Czechia (8), Denmark (5), Germany (38), Ireland (3), Greece (13), Spain (19), France (27), Croatia (4), Italy (21), Lithuania (2), Hungary (8), the Netherlands (12), Austria (9), Poland (17), Portugal (7), Romania (8), Slovenia (2), Slovakia (4), Finland (5) and Sweden (8). Estonia, Cyprus, Latvia, Luxembourg and Malta are all considered as single regions at NUTS 2 level.
The statistical regions in the candidate and EFTA countries follow the principles of the NUTS classification. However, there is no legal base. The data covers NUTS 2021 level 2 regions in Norway (7), Switzerland (7), Serbia (4) and Türkiye (26). Iceland, Montenegro and North Macedonia are considered as single regions at NUTS level 2.
The European Union (EU) includes Belgium, Bulgaria, Czechia, Denmark, Germany, Estonia, Ireland, Greece, Spain, France, Croatia, Italy, Cyprus, Latvia, Lithuania, Luxembourg, Hungary, Malta, the Netherlands, Austria, Poland, Portugal, Romania, Slovenia, Slovakia, Finland and Sweden.
In the text of this article, the names of the regions are in English, while the detailed tables which can be downloaded below list regions in the national language as set out in the NUTS.
For 2022, data for the outermost region of Mayotte (FRY5) are not available.
Notes on regional data reliability
• Unemployment rate 15-74 with low reliability in 2022: Tübingen (DE14), Oberfranken (DE24), Unterfranken (DE26), Swabia (DE27), Bremen (DE50), Giessen (DE72), Kassel (DE73), Lüneburg (DE93), Koblenz (DEB1), Saarland (DEC0), Chemnitz (DED4), Leipzig (DED5), Corsica (FRM0), Valle d'Aosta (ITC2), Zachodniopomorskie (PL42), Opolskie (PL52), Warmińsko-mazurskie (PL62), Podlaskie (PL84), Azores (PT20) and Bratislava (SK01).
• Unemployment rate 15-74 not available in 2022 because of very low reliability: Lower Bavaria (DE22), Oberpfalz (DE23), Trier (DEB2), Lubuskie (PL43) and Åland Islands (FI20).
• Unemployment rate 15-29 with low reliability in 2022: Walloon Brabant (BE31), Luxembourg (BE34), North-West (BG31), North-Central (BG32), North-East (BG33), South-East (BG34), South-Central (BG42), Prague (CZ01), Central Bohemia (CZ02), South-West (CZ03), Stuttgart (DE11), Karlsruhe (DE12), Upper Bavaria (DE21), Brandenburg (DE40), Hamburg (DE60), Weser-Ems (DE94), Cologne (DEA2), Münster (DEA3), Arnsberg (DEA5), Saxony-Anhalt (DEE0), Schleswig-Holstein (DEF0), North Aegean (EL41), South Aegean (EL42), Ionian Islands (EL62), Rioja (ES23), Ceuta (ES63), Melilla (ES64), Limousin (FRI2), French Guiana (FRY3), Grad Zagreb (HR05), Sjeverna Hrvatska (HR06), Autonomous Province of Bolzano (ITH1), Pest (HU12), Central Transdanubia (HU21), West Transdanubia (HU22), Zeeland (NL34), Carinthia (AT21), Salzburg (AT32), The Tyrol (AT33), Małopolskie (PL21), Śląskie (PL22), Wielkopolskie (PL41), Kujawsko-pomorskie (PL61), Łódzkie (PL71), Lubelskie (PL81), Podkarpackie (PL82), Mazowieckie-Regional (PL92), Algarve (PT15), Alentejo (PT18), Madeira (PT30), Bucharest-Ilfov (RO32) and West (RO42).
• Unemployment rate 15-29 not available in 2022 because of very low reliability: Freiburg (DE13), Tübingen (DE14), Lower Bavaria (DE22), Oberpfalz (DE23), Oberfranken (DE24), Mittelfranken (DE25), Unterfranken (DE26), Swabia (DE27), Bremen (DE50), Giessen (DE72), Kassel (DE73), Mecklenburg-Western Pomerania (DE80), Braunschweig (DE91), Hannover (DE92), Lüneburg (DE93), Detmold (DEA4), Koblenz (DEB1), Trier (DEB2), Rheinhessen-Pfalz (DEB3), Saarland (DEC0), Dresden (DED2), Chemnitz (DED4), Leipzig (DED5), Thuringia (DEG0), Corsica (FRM0), Mayotte (FRY5), Valle d'Aosta (ITC2), Burgenland (AT11), Vorarlberg (AT34), Zachodniopomorskie (PL42), Lubuskie (PL43), Opolskie (PL52), Warmińsko-mazurskie (PL62), Pomorskie (PL63), Świętokrzyskie (PL72), Podlaskie (PL84), Warsaw-Capital (PL91), Azores (PT20), Bratislava (SK01) and Åland Islands (FI20).
• Long-term unemployment rate with low reliability in 2022: Limburg (BE22), East Flanders (BE23), West Flanders (BE25), Walloon Brabant (BE31), Luxembourg (BE34), Prague (CZ01), Central Bohemia (CZ02), South-West (CZ03), Zealand (DK02), South Denmark (DK03), Central Jutland (DK04), Stuttgart (DE11), Brandenburg (DE40), Hamburg (DE60), Mecklenburg-Western Pomerania (DE80), Cologne (DEA2), Münster (DEA3), Arnsberg (DEA5), Rheinhessen-Pfalz (DEB3), Dresden (DED2), Saxony-Anhalt (DEE0), Schleswig-Holstein (DEF0), Thuringia (DEG0), Northern and Western (IE04), Melilla (ES64), Lower Normandy (FRD1), Grad Zagreb (HR05), Sjeverna Hrvatska (HR06), Autonomous Province of Trento (ITH2), West Transdanubia (HU22), South Holland (NL23), Styria (AT22), Upper Austria (AT31), Małopolskie (PL21), Śląskie (PL22), Wielkopolskie (PL41), Dolnośląskie (PL51), Kujawsko-pomorskie (PL61), Lubelskie (PL81), Podkarpackie (PL82), Mazowieckie-Regional (PL92), Algarve (PT15), Alentejo (PT18), Azores (PT20), Madeira (PT30), North-East (RO11) and West (RO42).
• Long-term unemployment rate not available because of very low reliability in 2022: North Jutland (DK05), Karlsruhe (DE12), Freiburg (DE13), Tübingen (DE14), Upper Bavaria (DE21), Lower Bavaria (DE22), Oberpfalz (DE23), Oberfranken (DE24), Mittelfranken (DE25), Unterfranken (DE26), Swabia (DE27), Bremen (DE50), Giessen (DE72), Kassel (DE73), Braunschweig (DE91), Hannover (DE92), Lüneburg (DE93), Weser-Ems (DE94), Detmold (DEA4), Koblenz (DEB1), Trier (DEB2), Saarland (DEC0), Chemnitz (DED4), Leipzig (DED5), Limousin (FRI2), Corsica (FRM0), Valle d'Aosta (ITC2), Autonomous Province of Bolzano (ITH1), Central Transdanubia (HU21), Drenthe (NL13), Zeeland (NL34), Burgenland (AT11), Carinthia (AT21), Salzburg (AT32), The Tyrol (AT33), Vorarlberg (AT34), Zachodniopomorskie (PL42), Lubuskie (PL43), Opolskie (PL52), Warmińsko-mazurskie (PL62), Pomorskie (PL63), Łódzkie (PL71), Świętokrzyskie (PL72), Podlaskie (PL84), Warsaw-Capital (PL91), Bratislava (SK01), Åland Islands (FI20), Central Norrland (SE32) and Upper Norrland (SE33).
Country notes
• In Germany, from the first quarter of 2020 onwards, the Labour Force Survey is part of a new system of integrated household surveys. In this context, technical issues and the COVID-19 crisis has had a large impact on data collection processes resulting in low response rates and a biased sample. The published German data therefore show (very) low reliability in some regions. For more information, see here.
• In the Netherlands, the 2021 LFS data remain collected using a rolling reference week instead of a fixed reference week, i.e. interviewed persons are asked about the situation of the week before the interview rather than a pre-selected week.
• France: Mayotte (FRY5) is covered by a specific annual survey. As a result, data for this region should be treated with caution.
Additional methodological information
More information on the EU-LFS can be found via the online publication EU Labour Force Survey, which includes eight articles on the technical and methodological aspects of the survey. The EU-LFS methodology in force from the 2021 data collection onwards is described in methodology from 2021 onwards. Detailed information on coding lists, explanatory notes and classifications used over time can be found under documentation.
Context
The unemployment rate is an important indicator with both social and economic dimensions. Rising unemployment results in a loss of income for individuals, increased pressure with respect to government spending on social benefits and a reduction in tax revenue. From an economic perspective, unemployment may be viewed as unused labour capacity.
The International Labour Organisation (ILO) definition of the unemployment rate is the most widely used labour market indicator because of its international comparability and relatively timely availability. Besides the unemployment rate, indicators such as employment and job vacancies also give useful insights into labour market developments.
The unemployment rate is considered to be a lagging indicator. When there is an economic downturn, it usually takes several months before the unemployment rate begins to rise. Once the economy starts to pick up again, employers usually remain cautious about hiring new staff and it may take several months before unemployment rates start to fall.
Male, youth and long-term unemployment appear to be more susceptible to cyclical economic changes than overall unemployment. Indeed, social policymakers often face the challenge of remedying these situations by designing ways to increase employment opportunities for various groups of society, those working in particular economic activities, or those living in specific regions.
Moreover, youth unemployment is one of the most pressing concerns in the area of social and employment policymaking. The performance of youth labour markets is closely linked to education and training systems and reflects, at least to some degree, a mismatch between the skills obtained by young people and the skills that are required by employers (to fill job vacancies). In recent years, several EU Member States have enacted new employment laws with the goal of liberalising labour markets, for example, by providing a wider range of possibilities for hiring staff through temporary, fixed-term or zero hours contracts. In some cases this has resulted in a division between permanent, full-time employees and those with more precarious employment contracts. The latter are often young people and people with relatively low levels of educational attainment. This may explain, at least to some degree, why young people in the labour market generally fare worse during economic downturns such as the global financial and economic crisis or the COVID-19 pandemic. During a downturn, employers are also less likely to recruit new workers (young people coming into the labour market) or to replace older workers who retire.
In order to ensure a better recovery from the COVID-19 pandemic, the EU has launched the Recovery and Resilience Facility (RRF), which is the key instrument at the heart of NextGenerationEU to help the EU emerge stronger and more resilient from the current crisis. One of the six pillars of the RRF is dedicated to “Policies for the next generation, children and the youth, such as education and skills“. Reforms and investments in children and the youth are essential to ensure that the next generation of Europeans is not permanently affected by the impact of the COVID-19 crisis and that the generational gap is not further deepened. Going into the detail of the national recovery and resilience plans submitted so far allows identifying many relevant measures for the youth, mostly related to education and the labour market. EU Member States have shown a strong commitment to supporting and advancing policies for the next generation. The Commission has flagged in total 310 measures put forward by EU Member States whose main objective is to support children and the youth. The majority of the measures will focus on access to, and quality and inclusiveness of general, vocational, and higher education, while other measures will cover youth employment support, and most EU Member States have dedicated measures in these fields.
Direct access to
- Labour force survey in the EU, EFTA and candidate countries — Main characteristics of national surveys, 2020, 2022 edition
- Quality report of the European Union Labour Force Survey 2020, 2022 edition
- EU labour force survey — online publication
- European Union Labour force survey - selection of articles (Statistics Explained)
- Regions, see:
- Regional labour market statistics (t_reg_lmk)
- LFS main indicators (t_lfsi)
- Unemployment - LFS adjusted series (t_une)
- LFS series - detailed annual survey results (t_lfsa)
- Unemployment rates of the population aged 25-64 by level of education (tps00066)
- Regions, see:
- Regional labour market statistics (reg_lmk)
- LFS main indicators (lfsi)
- Unemployment - LFS adjusted series (une)
- LFS series - detailed quarterly survey results (from 1998)
- Total unemployment - LFS series (lfsq_unemp)
- LFS series - Detailed annual survey results (lfsa)
- Total unemployment - LFS series (lfsa_unemp)
- My region - select a region on the map to see its key statistics on regional indicators.
- Regions and Cities Illustrated - select statistical domain 'Labour market' (top right)
- The "My region" app gives mobile access to a selection of annual regional indicators. Available for iPhone and Android.
- Methodology - Employment and unemployment (LFS)
- EU labour force survey — online publication
- Labour force survey in the EU, EFTA and candidate countries — Main characteristics of national surveys, 2020, 2022 edition
- Quality report of the European Union Labour Force Survey 2020, 2022 edition
ESMS metadata files
- Regional labour market statistics (ESMS metadata file - reg_lmk_esms)
- Employment and unemployment (Labour Force Survey) (ESMS metadata file — employ_esms)
- LFS main indicators (ESMS metadata file — lfsi_esms)
- LFS series - detailed quarterly survey results (from 1998 onwards) (ESMS metadata file — lfsq_esms)
- LFS series - Detailed annual survey results (ESMS metadata file — lfsa_esms)
- Council Decision 2010/707/EU of 21 October 2010 on guidelines for the employment policies of the EU Member States
- Summaries of EU Legislation: Guidelines for employment policies