Tourism statistics - expenditure
Data extracted in November 2023.
Planned article update: 04 December 2024.
Highlights
In 2022, EU residents spent an estimated €474 billion on tourism trips, mostly on trips abroad (53%).
EU residents spent 88% of their tourism expenditure on trips inside Europe (82% inside the EU).
Europeans spent on average €275 on a domestic trip and €952 on a foreign trip in 2022.
This article is part of the Eurostat online publication Tourism trips of Europeans. The publication provides recent statistics on tourism demand in the European Union (EU) and EFTA countries.
The other articles in this online publication analyse physical flows of tourists. This one adds a monetary dimension by taking a closer look at the expenditure of EU residents during tourism trips made in 2022. In the context of the article, all expenditure for a given trip refers to individual expenditure (not household expenditure or the expenditure of a travel party). The expenditure is allocated to the main country of destination, no matter in which country the service provider is based or where the turnover or added value was created. For example, if an individual uses an airline carrier, travel agency or tour operator based in a country other than that of the main destination, this expenditure will be allocated to the main country of destination, not to the country of the airline carrier, travel agency or tour operator.
Full article
Nearly half of Europeans' tourism expenditure is spent by German and French tourists
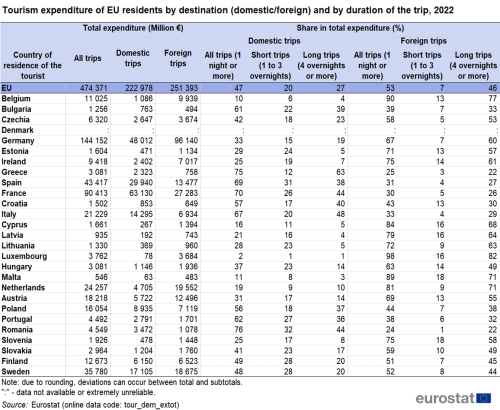
In 2022, EU residents spent an estimated €474 billion on tourism trips (see Table 1). Of this, they spent 47 % on trips within their own country of residence (domestic tourism) and 53 % on trips abroad (outbound tourism). However, domestic trips represented much more of the total number of trips (75 %), while trips abroad represented 25% - see the article on the characteristics of tourism trips.
Source: Eurostat (tour_dem_extot)
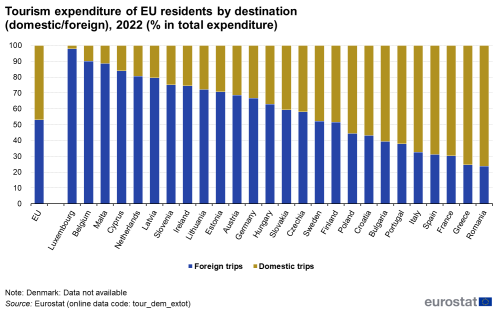
In 17 of the 26 EU countries with available data, residents spent more than half of the tourism expenditure during 2022 on trips abroad (see Figure 1). The highest shares for foreign expenditure were observed for Luxembourg (98 %), followed by Belgium (90 %), Malta (89 %), Cyprus (84 %) and the Netherlands (81 %). The residents of Romania, Greece and France have spent more than 70 % of their total tourism expenditure on domestic trips.
Source: Eurostat (tour_dem_extot)
In all countries, most tourism expenditure occurred during longer trips of four or more nights (EU average: 73 %), with residents of Greece, Luxembourg, the Netherlands and Belgium having spent more than 80 % of their tourism expenditure for long trips.
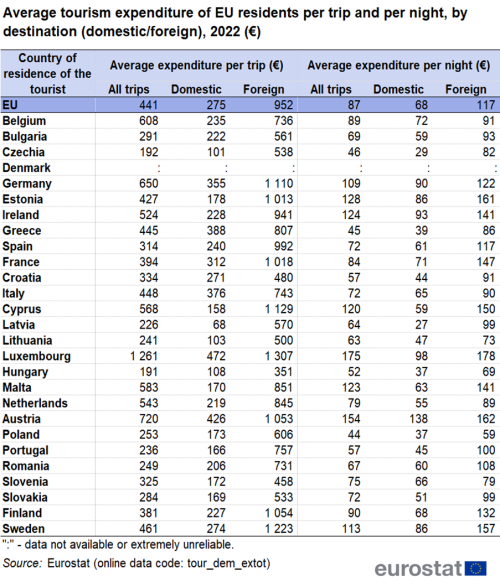
For each tourism trip, Europeans spent on average €441 per person (see Table 2). Broken down by destination, they spent €275 on average on a domestic trip and €952 on a foreign trip. The average spent per night was €87 (€68 on average for each domestic tourism night and €117 a night on average for trips abroad).
Source: Eurostat (tour_dem_extot)
Per trip, tourists from Luxembourg spent the most (€1261), followed by Austrian tourists (€720), while less than €200 per trip was spent by residents of Czechia and Hungary (see Figure 2). Domestic tourism expenditure per trip was highest in Luxembourg (€472), followed by Austria (€426). The biggest spenders per foreign tourism trip (€1 100 or more) were tourists from Luxembourg, Sweden, Cyprus and Germany.
Residents of Luxembourg, Austria, Estonia, Ireland, Malta and Cyprus spent at least €120 per night on average during their tourism trips, while residents of Czechia, Greece and Poland spent less than €50 (see Figure 3).
German and French tourists were the biggest spenders in absolute terms. Their expenditure accounted for nearly half (49 %) of the tourism expenditure of all EU residents. This share is more than the proportion of German and French tourists in the total number of trips (42 %) or overnight stays (44 %) – see the article on the characteristics of tourism trips.
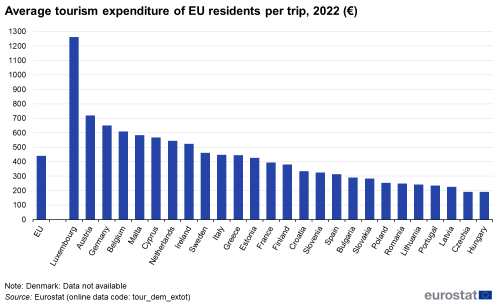
Source: Eurostat (tour_dem_extot)
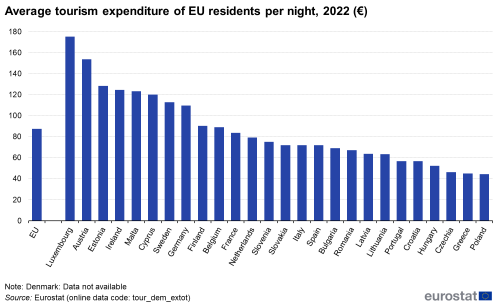
Source: Eurostat (tour_dem_extot)
Europeans spend 82 % of their total tourism expenditure on trips inside the EU
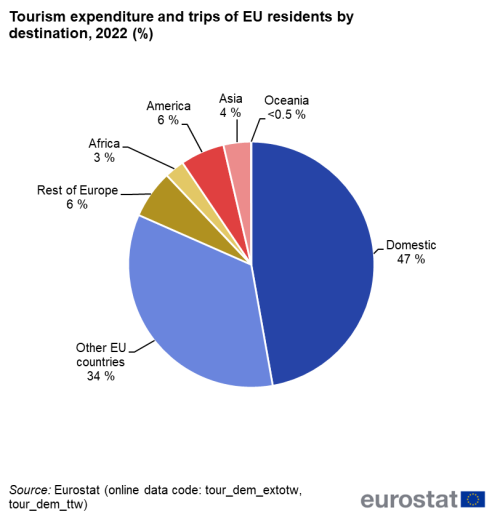
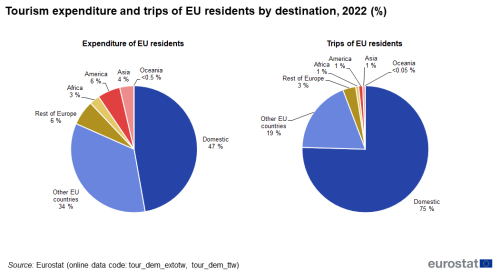
In 2022, intra-EU tourism accounted for 94 % of all tourism trips (75 % of which were domestic trips and 19 % trips to another Member State). In terms of expenditure, however, domestic trips accounted for 47 % of total tourism expenditure (see Figure 4), all EU destinations (including domestic) for 82 % and destinations outside the EU for 18 % (compared with only 6 % of the number of tourism trips).
Source: Eurostat (tour_dem_extotw), (tour_dem_ttw)
Europeans travelling to foreign continents spent most on trips to America (6 % of total expenditure by EU residents on tourism trips), followed by Asia (4 %) and Africa (3 %). European destinations outside the EU accounted for around 6 % of all of the tourism expenditure of EU residents.
Expenditure on accommodation accounts for one third of the tourism budget of EU residents
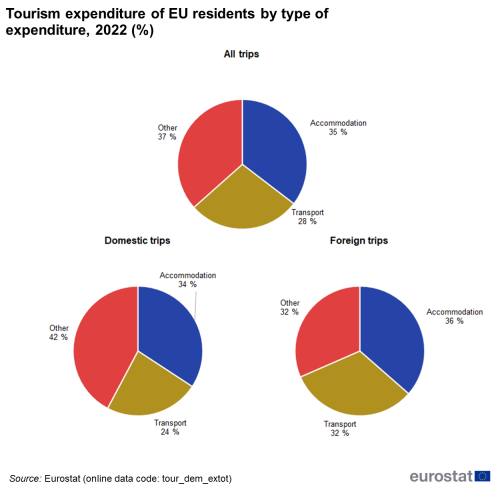
Accommodation took up 35 % of tourism expenditure, while transport accounted for 28 % and miscellaneous other costs for 37 % (see Figure 5). Looking at domestic and foreign trips separately, the share of transport expenditure was higher by 8 percentage points for foreign trips than for domestic trips. The difference in the share of accommodation expenditure was less significant (+2 percentage points for foreign trips).
Source: Eurostat (tour_dem_extot)
On average, expenditure per trip was higher for trips for which the main accommodation was rented (see Figure 6). The average cost of trips spent at hotels was €681 (as compared with the overall average of €441), while trips spent at an own holiday home cost €244 on average and those spent at accommodation provided free of charge by friends or relatives cost €189.
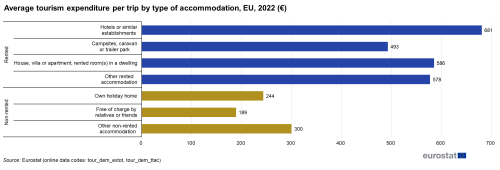
Source: Eurostat (tour_dem_extot) (tour_dem_ttac)
For trips where the main means of accommodation was rented accommodation, the average expenditure per night per person on accommodation was €53 – ranging from €25 per night for trips spent mainly at campsites to €68 for trips spent mainly at hotels (see Figure 7).

Source: Eurostat (tour_dem_exac)
Age makes a slight difference to the average expenditure per trip
Tourists under 45 years old accounted for less tourism expenditure (42 % of expenditure made by all age groups) than tourism trips in 2022 (44 %). On average tourists of this age group spent €421 per trip, while the youngest (15-24 years old) spent the least (€401) (see Figure 8 and Figure 9). The rest (and older) of the age groups spent €457 on average per trip, while tourists aged from 55 to 64 years spent the most (€472).
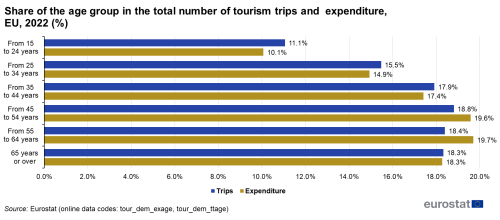
Source: Eurostat (tour_dem_exage) (tour_dem_ttage)
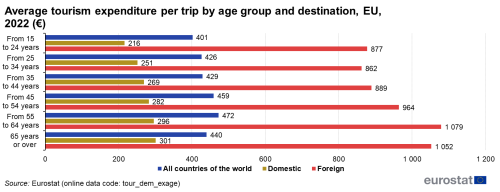
Source: Eurostat (tour_dem_exage)
Business travel accounts for 13 % of total tourism expenditure in 2022
Holiday, leisure and recreation trips accounted for the majority of tourism expenditure (66 %) in 2022 (see Figure 10). Visits to relatives and friends accounted for only 16 % of all tourism expenditure, but they represented 32 % of all tourism trips (accommodation is more likely to be offered for free on such trips). A typical visit to relatives and friends costs just over half the average tourism trip for personal reasons (€223 compared to €425) (see Figure 11).
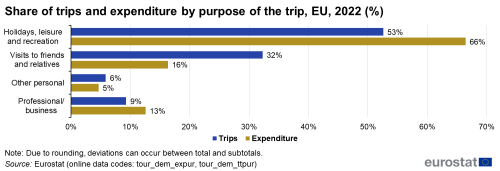
Source: Eurostat (tour_dem_expur) (tour_dem_ttpur)

Source: Eurostat (tour_dem_expur)
Business trips accounted for 13 % of tourism expenditure in 2022. At €597, they recorded the highest average expenditure per trip, while the expenditure per night (see Figure 12) was 2.1 times higher for business trips than for trips for personal purposes (€174 per night versus €81 per night).

Source: Eurostat (tour_dem_expur)
Source data for tables and graphs
Data sources
Collection of annual data on trips of EU residents
The collection consists of harmonised data collected by the Member States in the frame of the Regulation (EU) No 692/2011 of the European Parliament and of the Council concerning European statistics on tourism.
The scope of observation for data on tourism trips are all tourism trips with at least one overnight stay, made by the resident population aged 15 and over. It includes trips made for private or professional purpose, outside the usual environment.
Context
The EU is a major tourist destination, with four Member States among the world’s top ten destinations for holidaymakers, according to UNWTO[1] data. Tourism is an important activity in the EU which contributes to employment and economic growth, as well as to the development of rural, peripheral or less-developed areas. These characteristics drive the demand for reliable and harmonised statistics on this activity, as well as within the wider context of regional policy and sustainable development policy areas.
Direct access to
- Tourism trips of Europeans (online publication)
- All articles on tourism statistics
- Tourism (t_tour), see:
- Tourism (tour), see:
- Trips of EU residents - annual data
- Tourism trips (tour_dem_tt)
- Tourism nights (tour_dem_tn)
- Expenditure on tourism trips (tour_dem_ex)
- Trips of EU residents - annual data (ESMS metadata file — tour_dem_esms)
- With 2012 as reference year:
- Regulation (EU) No 692/2011 of 6 July 2011 concerning European statistics on tourism and repealing Council Directive 95/57/EC. (Summary)
- Regulation (EU) No 1051/2011 of 20 October 2011 implementing Regulation 692/2011 concerning European statistics on tourism, as regards the structure of the quality reports and the transmission of the data.
- Previous legal acts (concerning reference periods before 2012):
- Directive 95/57/EC of 23 November 1995 on the collection of statistical information in the field of tourism.
- Commission Decision 1999/35/CE of 9 December 1998 on the procedures for implementing Council Directive 95/57/EC on the collection of statistical information in the field of tourism.
- Commission Decision 2004/883/CE of 10 December 2004 adjusting the Annex to Council Directive 95/57/EC on the collection of statistical information in the field of tourism as regards country lists.
- Directive 2006/110/EC of 20 November 2006 adapting Directives 95/57/EC and 2001/109/EC in the field of statistics, by reason of the accession of Bulgaria and Romania.
- Agenda for a sustainable and competitive European tourism (Communication from the European Commission, October 2007)
- European Commission - Directorate-General for Internal Market, Industry, Entrepreneurship and SMEs - Tourism
