Tutorials
Log in
Statistics Explained
menu
search
search
Navigation
Main page
Statistical themes
Glossary
Categories
Statistics 4 beginners
Tutorials
Help
Eurostat home
Education corner
Online publications
Regional yearbook
Sustainable development
Full list
Tools
User contributions
Logs
View user groups
Special pages
search
Navigation
Main page
Statistical themes
Glossary
Categories
Statistics 4 beginners
Tutorials
Help
Eurostat home
Education corner
Online publications
Regional yearbook
Sustainable development
Full list
Tools
User contributions
Logs
View user groups
Special pages
Navigation
Main page
Statistical themes
Glossary
Categories
Statistics 4 beginners
Tutorials
Help
Eurostat home
Education corner
Online publications
Regional yearbook
Sustainable development
Full list
Tools
User contributions
Logs
View user groups
Special pages
Uploads by Somesmo
This special page shows all uploaded files.
File list
Items per page:
20
50
100
250
500
Search for media name:
Username:
Include old versions of files
Go
First page
Previous page
Next page
Last page
Date
Name
Thumbnail
Size
Description
Versions
16:50, 10 May 2017
Natural gas prices 2016s2.xlsx
(
file
)
179 KB
1
16:49, 10 May 2017
Conversion rates table gas article 2016 semester 2.xlsx
(
file
)
17 KB
1
16:46, 10 May 2017
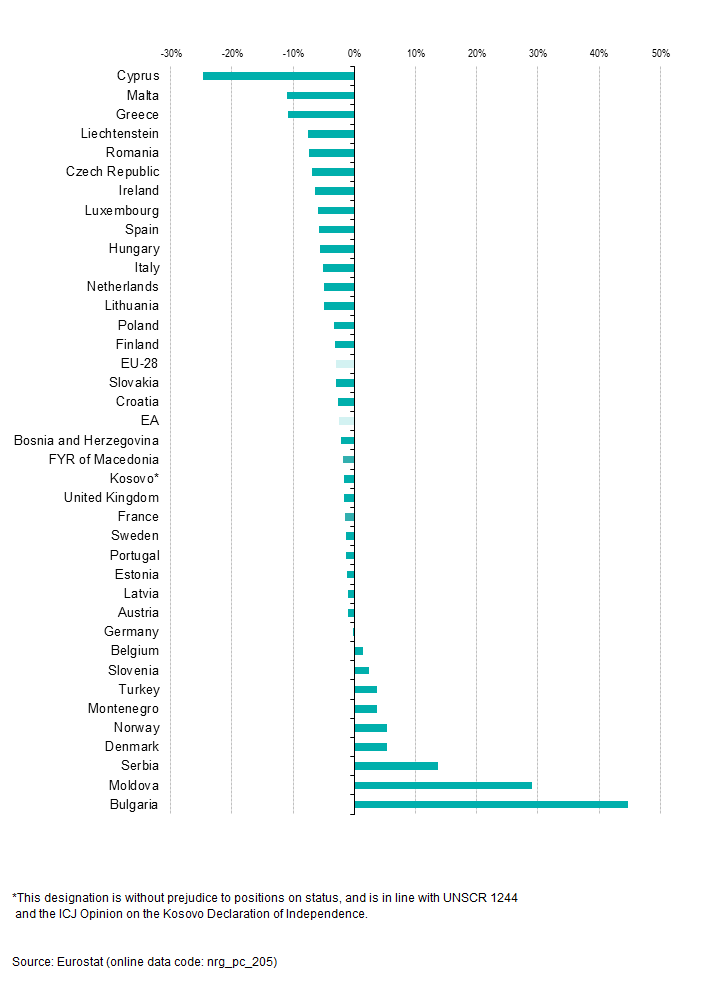
Percentage change in natural gas prices for industrial consumers, 2016s2-2015s2.png
(
file
)
29 KB
1
16:45, 10 May 2017
Evolution of EU-28 and EA natural gas prices for industrial consumers in EUR kWh.png
(
file
)
22 KB
2
16:44, 10 May 2017
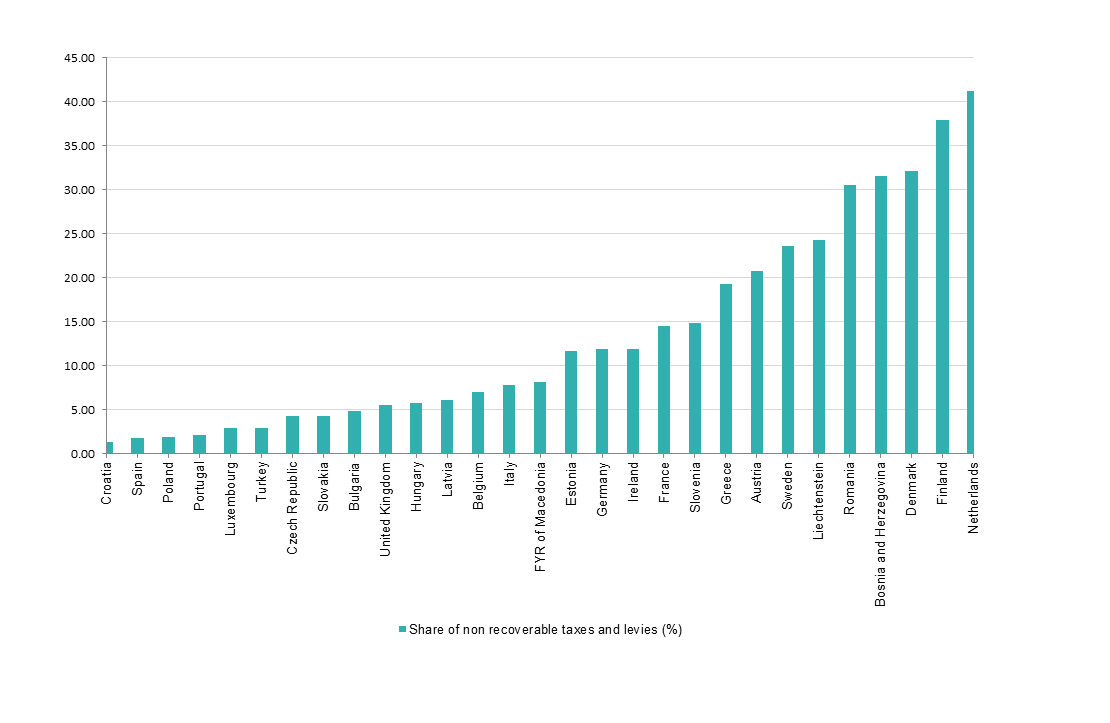
Natural gas - share of taxes and levies paid by industrial consumers, 2016s2 (in %).png
(
file
)
28 KB
1
16:43, 10 May 2017
Natural gas prices for industrial consumers, 2016s2 (EUR kWh).png
(
file
)
36 KB
1
16:42, 10 May 2017
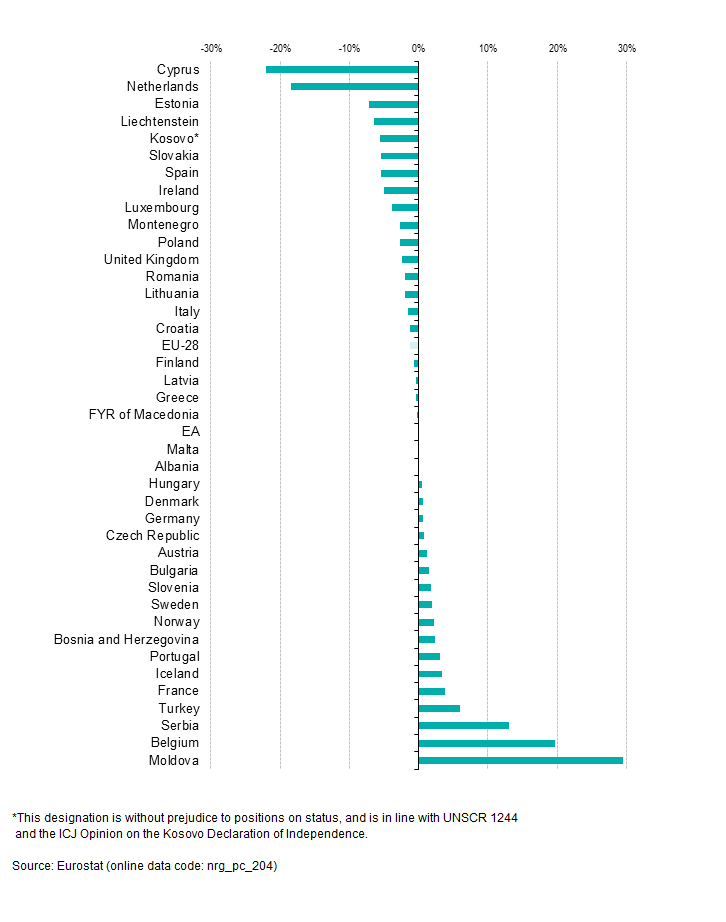
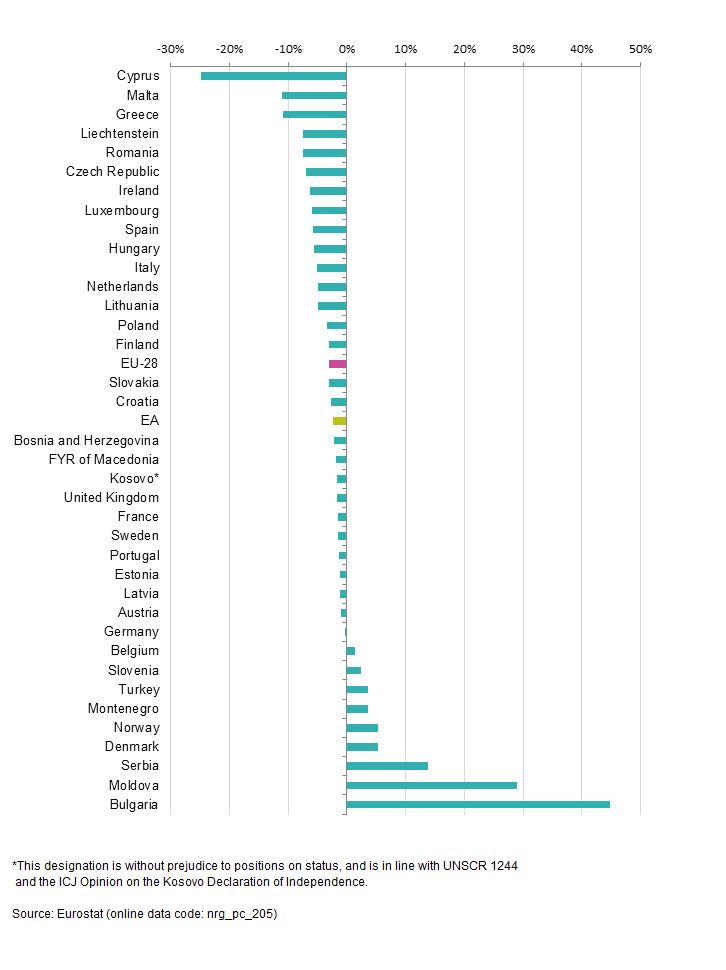
Percentage change in natural gas prices for household consumers, 2016s2-2015s2.png
(
file
)
33 KB
1
16:40, 10 May 2017
Natural gas - share of taxes and levies paid by household consumers, 2016s2 (in %).png
(
file
)
32 KB
1
16:39, 10 May 2017
Natural gas prices for household consumers, 2016s2 (EUR kWh).png
(
file
)
39 KB
1
16:37, 10 May 2017
Half-yearly gas prices (EUR).png
(
file
)
52 KB
3
16:33, 10 May 2017
Electricity prices 2016s2.xlsx
(
file
)
180 KB
1
16:31, 10 May 2017
Conversion rates table electricity article 2016 semester 2.xlsx
(
file
)
17 KB
1
16:30, 10 May 2017
Share in electricity price for industrial consumers, without taxes and levies, 2016s2 (in %).png
(
file
)
61 KB
1
16:29, 10 May 2017
Disaggregated price data for industrial consumers, 2016s2 (in EUR kWh).png
(
file
)
58 KB
1
16:28, 10 May 2017
Percentage change in electricity prices for industrial consumers, 2016s2-2015s2.png
(
file
)
41 KB
1
16:26, 10 May 2017
Electricity - share of taxes and levies paid by industrial consumers, 2016s2(%).png
(
file
)
33 KB
1
16:25, 10 May 2017
Evolution of EU-28 and EA electricity prices for industrial consumers in EUR kWh.png
(
file
)
23 KB
2
16:23, 10 May 2017
Electricity prices for industrial consumers, 2016s2 (EUR kWh).png
(
file
)
47 KB
1
16:22, 10 May 2017
Share in electricity price for household consumers, without taxes and levies, 2016s2 (in %).png
(
file
)
66 KB
1
16:21, 10 May 2017
Disaggregated price data for household consumers, 2016s2 (in EUR kWh).png
(
file
)
60 KB
1
16:20, 10 May 2017
Percentage change in electricity prices for household consumers, 2016s2-2015s2.png
(
file
)
40 KB
1
16:19, 10 May 2017
Electricity - share of taxes and levies paid by household consumers, 2016s2 (%).png
(
file
)
35 KB
1
16:15, 10 May 2017
Evolution of EU-28 and EA electricity prices for household consumers (EUR kWh).png
(
file
)
21 KB
3
17:43, 15 February 2017
Electricity market indicators 2017 01 25.xlsx
(
file
)
91 KB
1
17:42, 15 February 2017
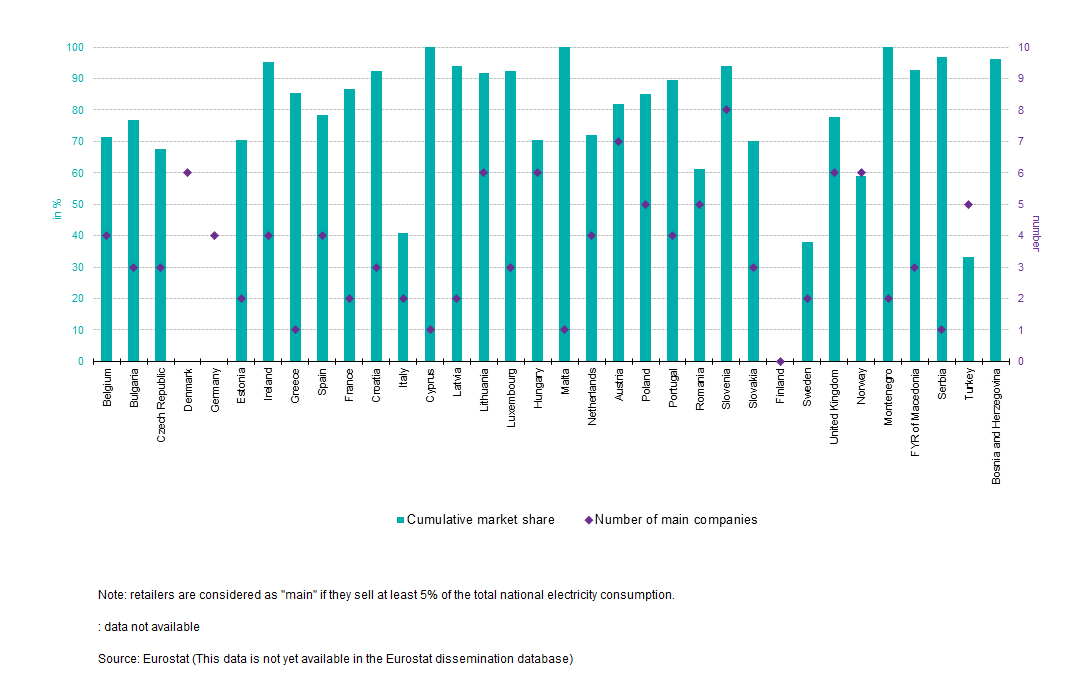
Number of main electricity retailers and their cumulative market share, 2015.png
(
file
)
50 KB
1
17:41, 15 February 2017
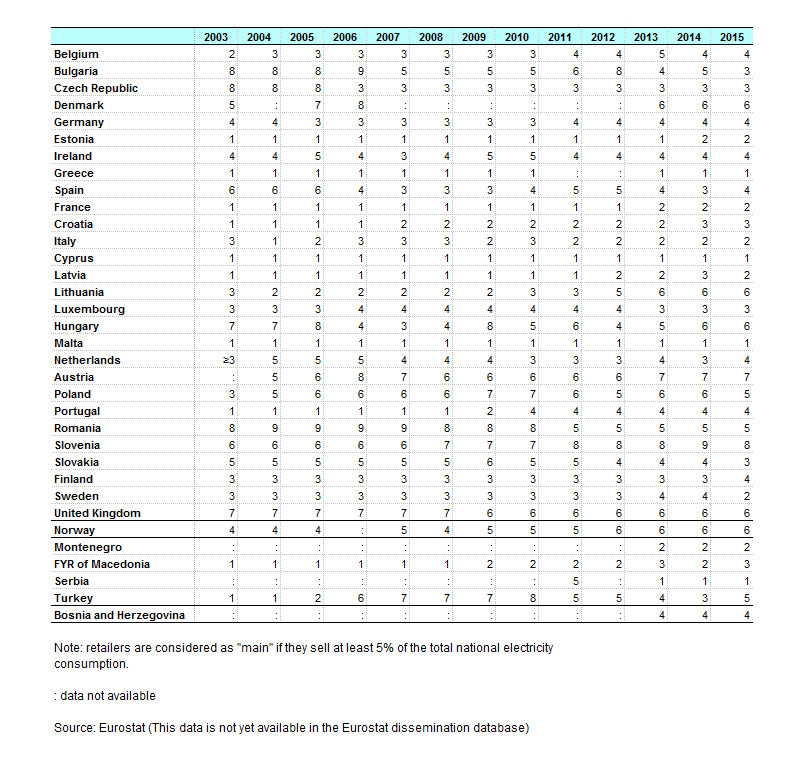
Number of main electricity retailers year 2015.png
(
file
)
36 KB
1
17:40, 15 February 2017
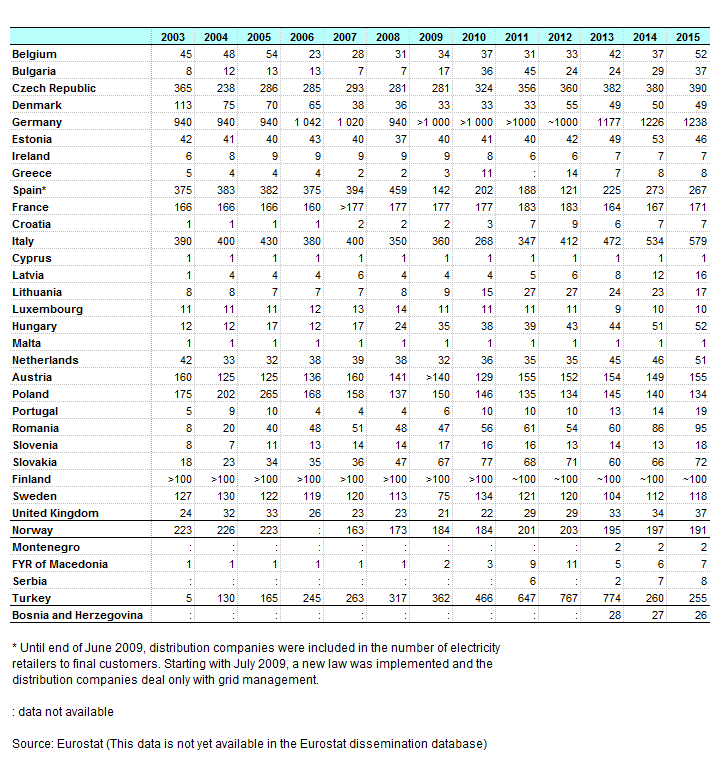
Total number of electricity retailers to final consumers.png
(
file
)
48 KB
1
17:38, 15 February 2017
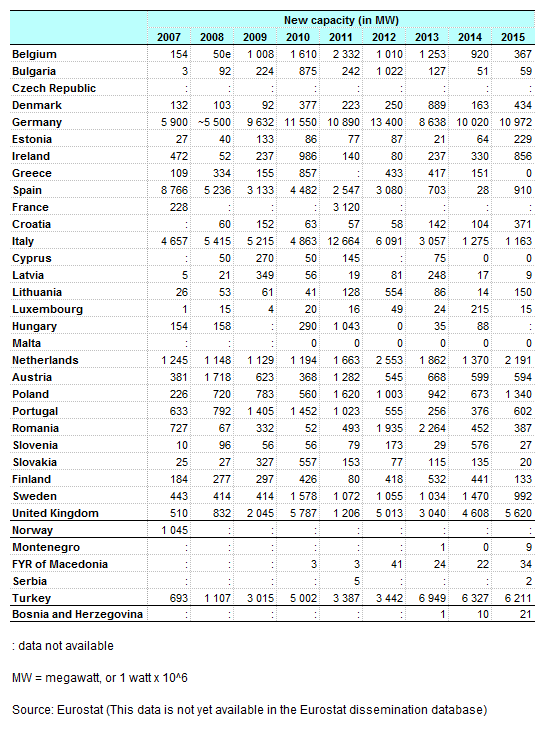
New capacity connected during the year (in MW).png
(
file
)
42 KB
1
17:37, 15 February 2017
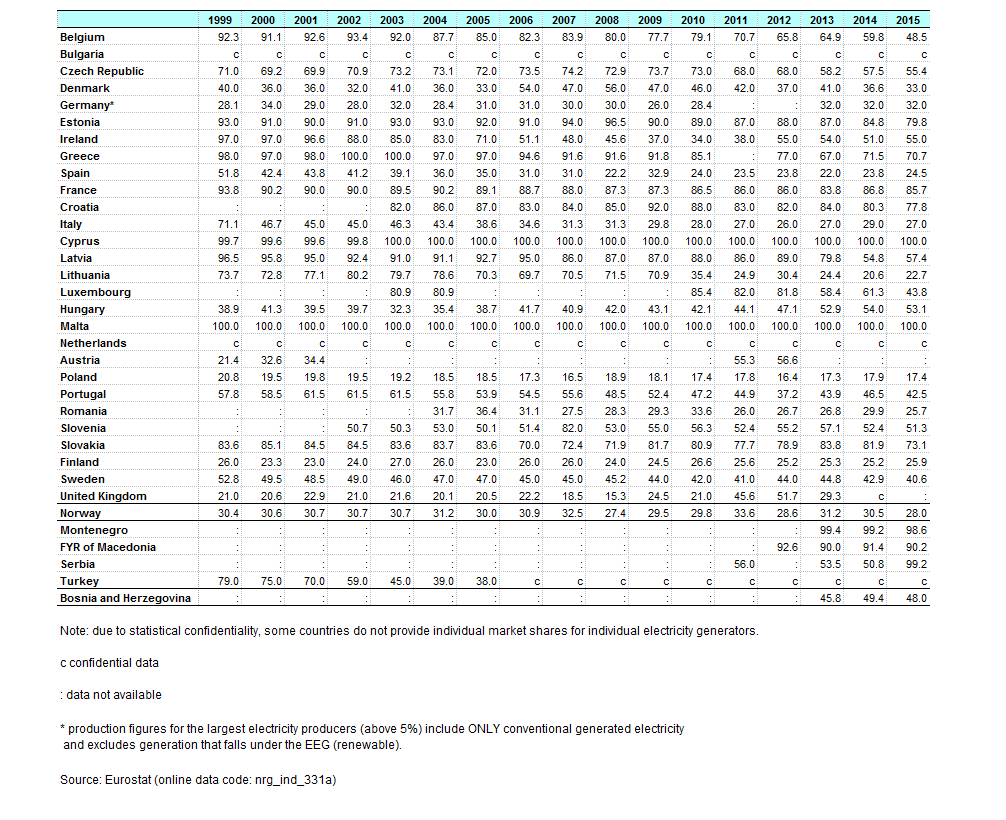
Market share of the largest generator in the electricity market (in %).png
(
file
)
63 KB
1
17:36, 15 February 2017
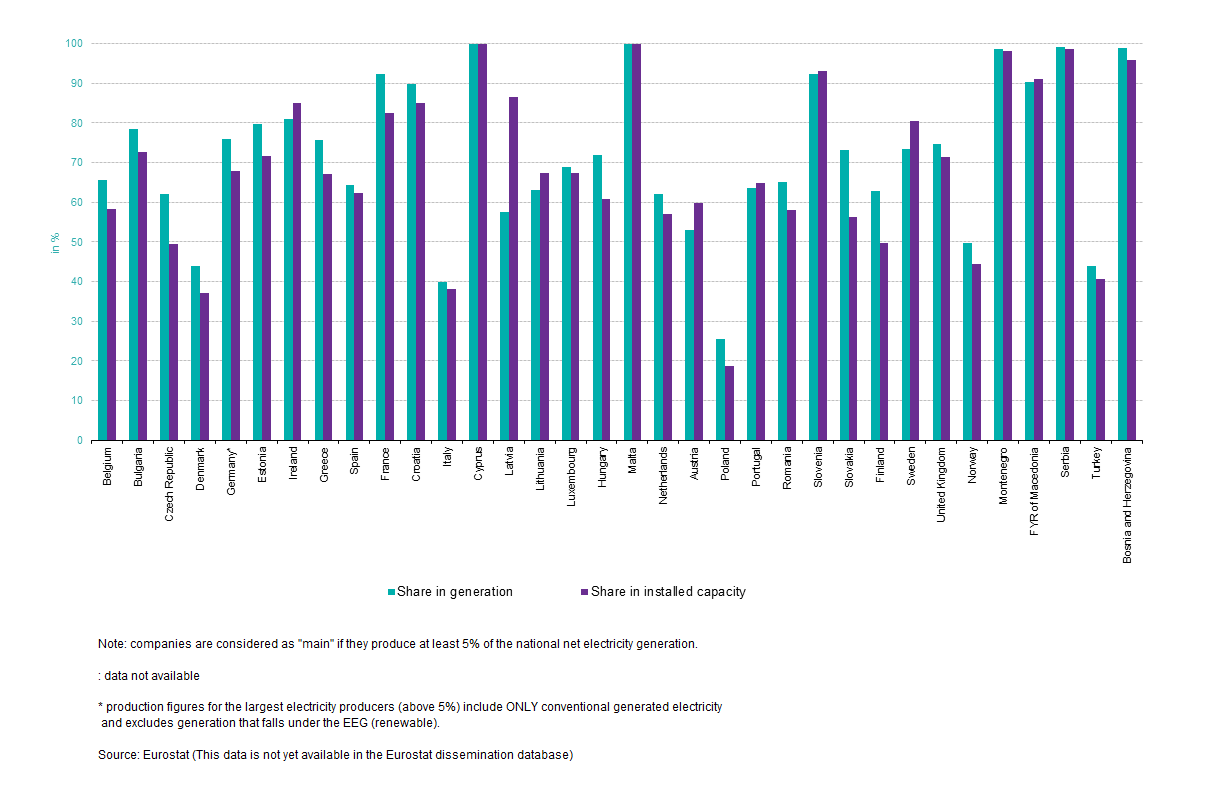
Cumulative market share of the main electricity generating companies and their respective installed capacity share, 2015 (in %).png
(
file
)
78 KB
1
17:13, 15 February 2017
Natural gas market indicators 2017 01 25.xlsx
(
file
)
76 KB
1
17:11, 15 February 2017
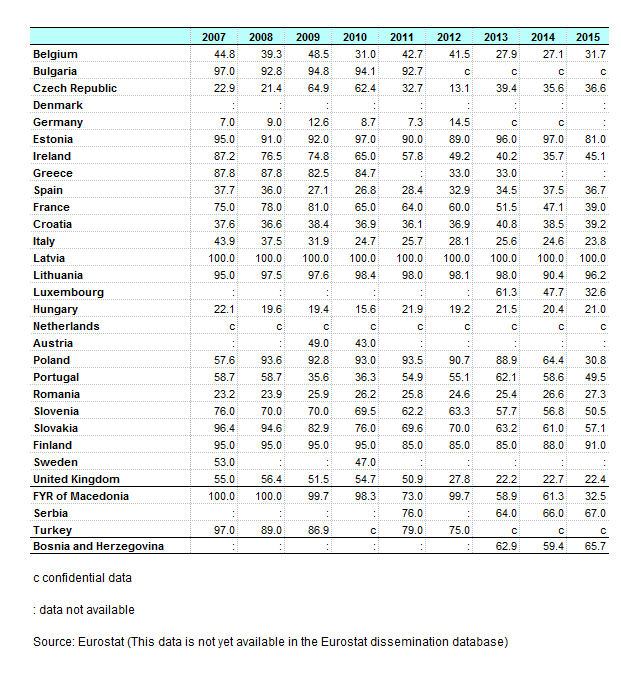
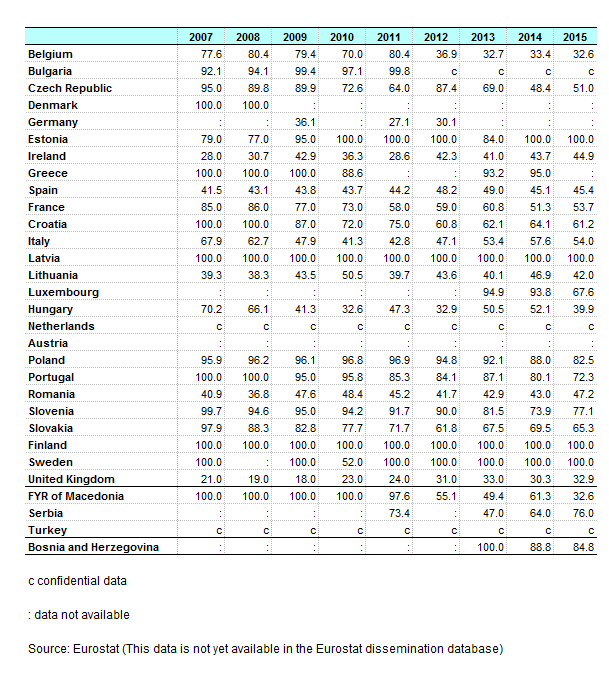
Market share of the largest natural gas retailer (in %).png
(
file
)
37 KB
1
17:10, 15 February 2017
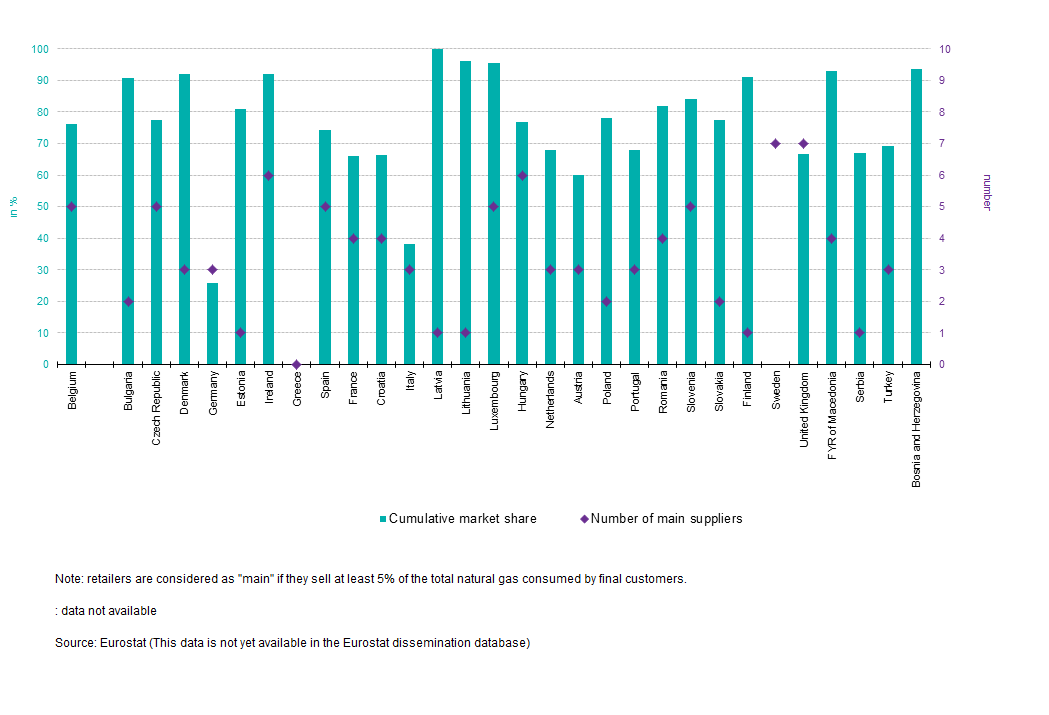
Number of main natural gas retailers to final customers and their cumulative market share, 2015.png
(
file
)
48 KB
1
17:09, 15 February 2017
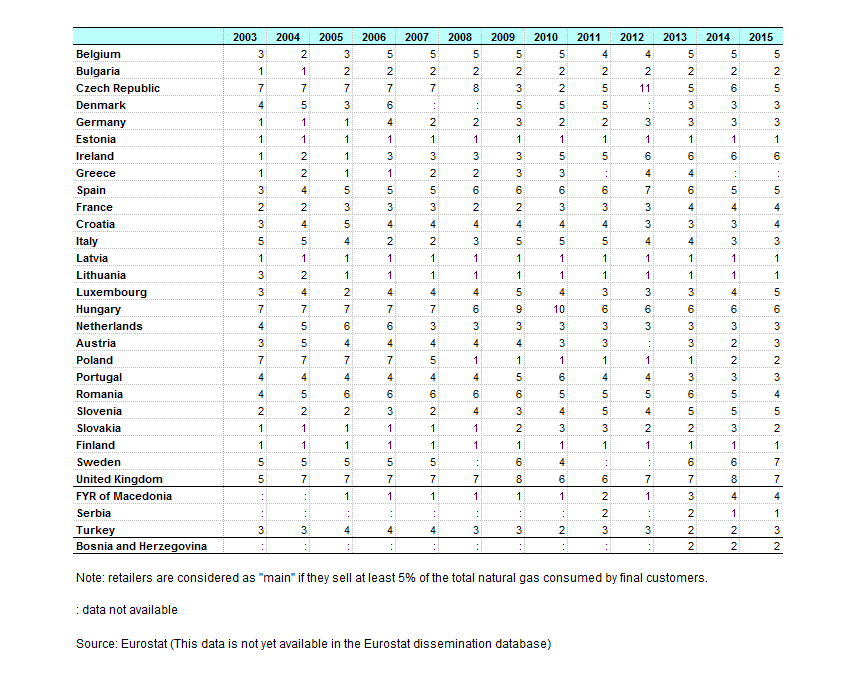
Number of main natural gas retailers.png
(
file
)
34 KB
1
17:08, 15 February 2017
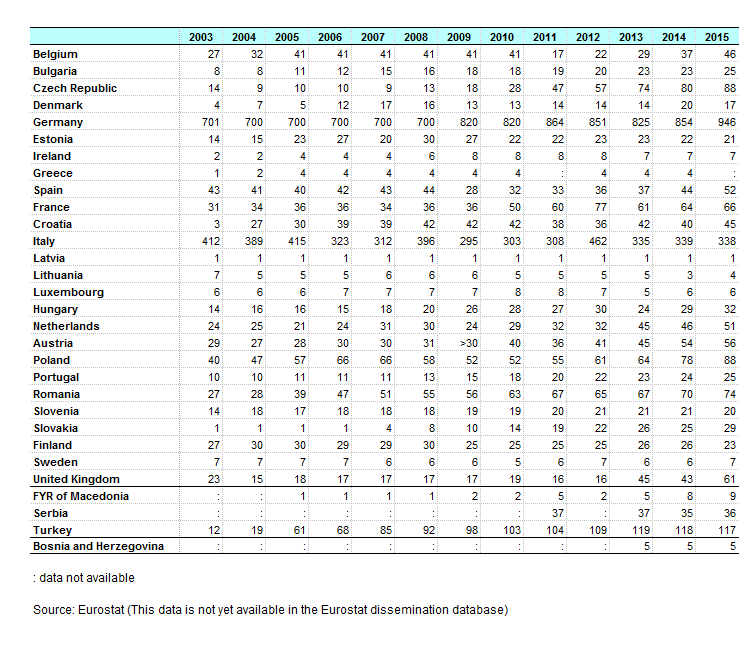
Number of retailers selling natural gas to final customers.png
(
file
)
38 KB
1
17:07, 15 February 2017
Market share of the largest production and import gas company (in %).png
(
file
)
35 KB
1
17:06, 15 February 2017
Number of main entities bringing gas into the country and their cumulative market share, 2015.png
(
file
)
49 KB
1
17:04, 15 February 2017
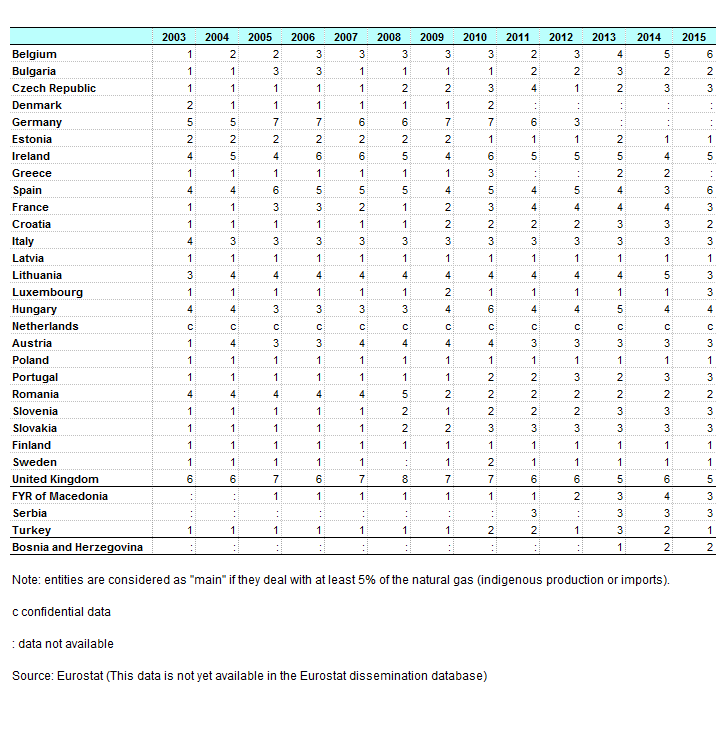
Number of main entities bringing natural gas into the country.png
(
file
)
32 KB
1
17:03, 15 February 2017
Number of entities bringing natural gas into the country 2015.png
(
file
)
34 KB
1
11:20, 18 November 2016
Natural gas prices 2016s1.xlsx
(
file
)
163 KB
3
11:19, 18 November 2016
Natural gas - share of taxes and levies paid by industrial consumers, 2016sem1 (in %).png
(
file
)
30 KB
1
11:18, 18 November 2016
Natural gas - share of taxes and levies paid by household consumers, 2016sem1 (in %).png
(
file
)
31 KB
1
11:59, 15 November 2016
Natural gas - share of taxes and levies paid by household consumers, 2016semester1 (in %).png
(
file
)
31 KB
1
17:32, 14 November 2016
Natural gas - share of taxes and levies paid by industrial consumers, 2016semester1 (in %).png
(
file
)
30 KB
1
15:22, 14 November 2016
Electricity prices 2016s1.xlsx
(
file
)
174 KB
2
14:44, 11 November 2016
Conversion rates table electricity article 2016 semester 1.xlsx
(
file
)
16 KB
1
14:35, 11 November 2016
Percentage change in electricity prices for industrial consumers, between 2016s1-2015s1.png
(
file
)
36 KB
1
14:33, 11 November 2016
Percentage change in electricity prices for household consumers, between 2016s1-2015s1.png
(
file
)
36 KB
1
14:29, 11 November 2016
Percentage change in electricity prices for industrial consumers, 2016s1-2015s1.png
(
file
)
35 KB
2
14:27, 11 November 2016
Share in electricity price for industrial consumers, without taxes and levies, 2015s2 (in %).png
(
file
)
57 KB
2
First page
Previous page
Next page
Last page
Special page
ISSN 2443-8219


.png)
.png)

.png)
.png)
.png)
.png)
.png)

.png)

.png)
.png)
.png)

.png)
.png)


.png)
.png)
.png)
.png)


.png)


.png)
.png)
.png)
.png)


.png)