Tutorials
Log in
Statistics Explained
menu
search
search
Navigation
Main page
Statistical themes
Glossary
Categories
Statistics 4 beginners
Tutorials
Help
Eurostat home
Education corner
Online publications
Regional yearbook
Sustainable development
Full list
Tools
User contributions
Logs
View user groups
Special pages
search
Navigation
Main page
Statistical themes
Glossary
Categories
Statistics 4 beginners
Tutorials
Help
Eurostat home
Education corner
Online publications
Regional yearbook
Sustainable development
Full list
Tools
User contributions
Logs
View user groups
Special pages
Navigation
Main page
Statistical themes
Glossary
Categories
Statistics 4 beginners
Tutorials
Help
Eurostat home
Education corner
Online publications
Regional yearbook
Sustainable development
Full list
Tools
User contributions
Logs
View user groups
Special pages
Uploads by Santoan6
This special page shows all uploaded files.
File list
Items per page:
20
50
100
250
500
Search for media name:
Username:
Include old versions of files
Go
First page
Previous page
Next page
Last page
Date
Name
Thumbnail
Size
Description
Versions
21:44, 29 June 2018
Physical activity statistics Y2018.xlsx
(
file
)
55 KB
1
21:02, 6 June 2018
Preventive services Health2018.xlsx
(
file
)
151 KB
1
19:13, 6 June 2018
Mental wellbeing statistics Y2018.xlsx
(
file
)
90 KB
1
10:24, 6 June 2018
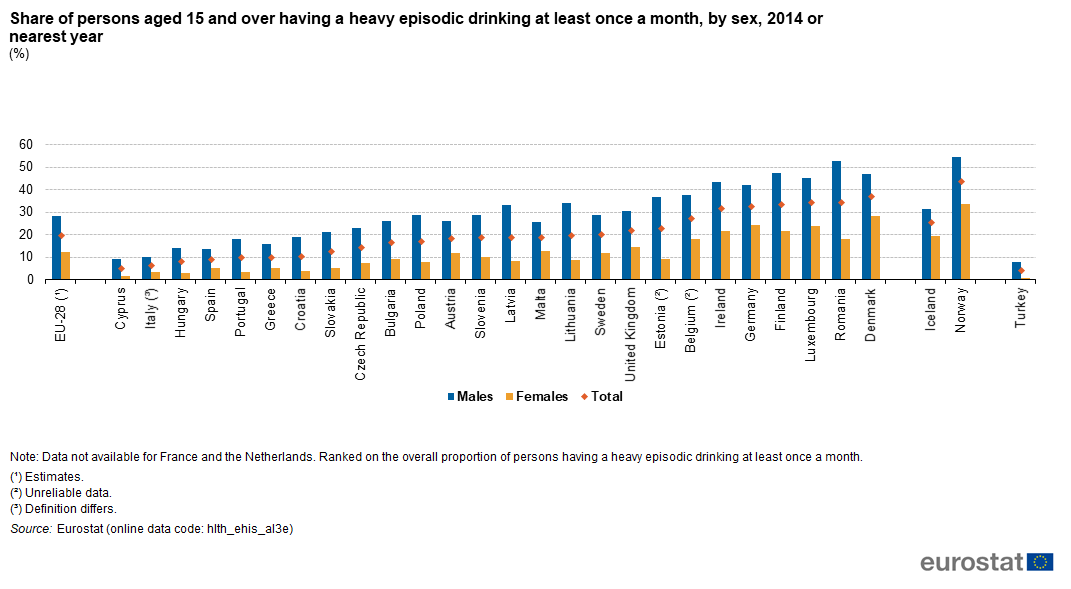
Share of persons aged 15 and over having a heavy episodic drinking at least once a month, by sex, 2014 or nearest year (%) HLTH2018.png
(
file
)
55 KB
1
10:21, 6 June 2018
Share of persons aged 15 and over having a heavy episodic drinking at least once a month, by sex, 2014 or nearest year (%).png
(
file
)
55 KB
Reverted to version as of 08:18, 6 June 2018
5
19:43, 5 June 2018
Fruit Vegatable consumption Y2018.xlsx
(
file
)
105 KB
1
16:22, 5 June 2018
Alcohol consumption statistics Y2018.xlsx
(
file
)
49 KB
2
16:10, 5 June 2018
Share of persons aged 15 and over having a heavy episodic drinking at least once a month, by level of educational attainment, 2014 or nearest year (%) HLTH2018.png
(
file
)
47 KB
1
15:38, 5 June 2018
Distribution of persons aged 15 and over according to the frequency of alcohol consumption, 2014 or nearest year (%).png
(
file
)
56 KB
5
08:54, 5 June 2018
Percentage of persons aged 15 and over with poor perception for social support, by age, 2014 or nearest year (%).png
(
file
)
47 KB
1
08:46, 5 June 2018
Distribution of persons aged 15 and over according to the overall perceived social support, 2014 or nearest year (%).png
(
file
)
55 KB
1
08:42, 5 June 2018
Share of persons aged 15 and over having a heavy episodic drinking at least once a month, by sex and income quantile, 2014 or nearest year (%).png
(
file
)
90 KB
1
08:42, 5 June 2018
Share of persons aged 15 and over having a heavy episodic drinking at least once a month, by level of educational attainment, 2014 or nearest year (%).png
(
file
)
59 KB
1
18:17, 4 June 2018
Mental health and related issues Health2018.xlsx
(
file
)
108 KB
1
18:15, 4 June 2018
Share of the population reporting that they had chronic depression, by degree of urbanisation, 2014 (%) HLTH18.png
(
file
)
46 KB
1
18:15, 4 June 2018
Share of the population reporting that they had chronic depression, by age, 2014 (%) HLTH18.png
(
file
)
89 KB
1
18:14, 4 June 2018
Share of the population aged 15 or over reporting that they had consulted a psychologist, psychotherapist or psychiatrist, by sex, 2014 (%) HLTH18.png
(
file
)
46 KB
1
13:50, 21 March 2018
Unmet health care needs statistics Y2018.xlsx
(
file
)
100 KB
2
13:16, 8 March 2018
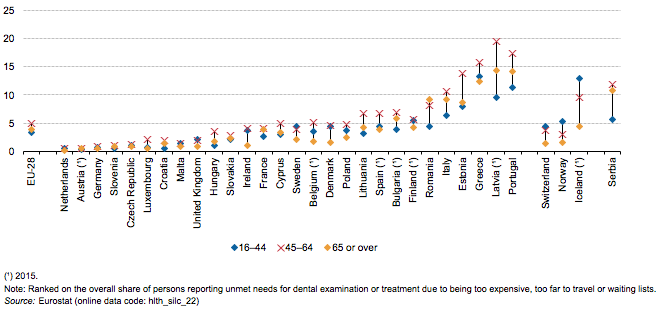
Share of persons aged 16 and over reporting unmet needs for dental examination or treatment, by detailed reason, 2016.png
(
file
)
135 KB
2
13:13, 8 March 2018
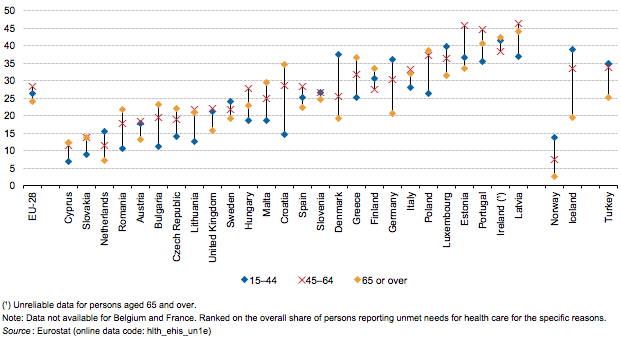
Share of persons aged 15 and over reporting unmet needs for specific health care-related services due to financial reasons, by age, 2014 or nearest year.png
(
file
)
85 KB
1
13:13, 8 March 2018
Share of persons aged 15 and over reporting unmet needs for specific health care-related services due to financial reasons, by level of educational attainment, 2014 or nearest year.png
(
file
)
79 KB
1
13:12, 8 March 2018
Share of persons aged 15 and over reporting unmet needs for specific health care-related services due to financial reasons, 2014 or nearest year.png
(
file
)
67 KB
1
13:12, 8 March 2018
Share of persons aged 16 and over reporting unmet needs for dental examination or treatment due to being too expensive, too far to travel or waiting lists, by age, 2016.png
(
file
)
49 KB
1
13:09, 8 March 2018
Share of persons aged 16 and over reporting unmet needs for dental examination or treatment, 2016.png
(
file
)
40 KB
1
13:07, 8 March 2018
Share of persons aged 16 and over reporting unmet needs for medical examination or treatment due to being too expensive, too far to travel or waiting lists, by educational attainment level, 2016.png
(
file
)
69 KB
1
13:06, 8 March 2018
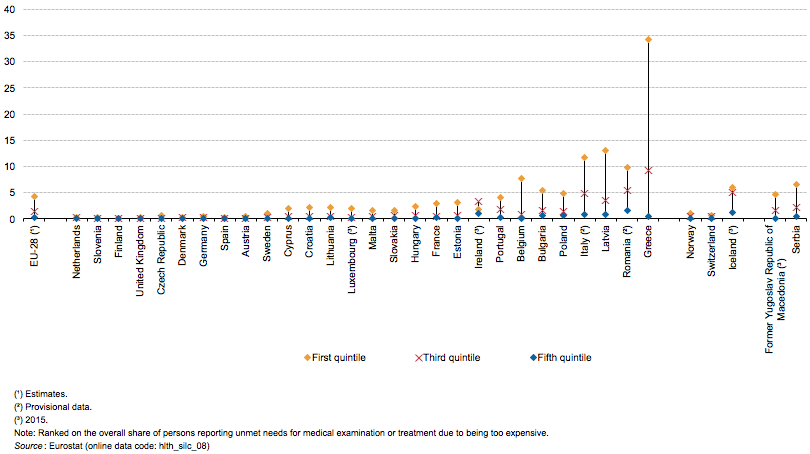
Share of persons aged 16 and over reporting unmet needs for medical examination or treatment due to being too expensive, by income quintile group, 2016.png
(
file
)
60 KB
1
13:05, 8 March 2018
Share of persons aged 16 and over reporting unmet needs for medical examination or treatment due to being too expensive, too far to travel or waiting lists, by age, 2016.png
(
file
)
61 KB
1
13:01, 8 March 2018
Share of persons aged 16 and over reporting unmet needs for medical examination or treatment, by detailed reason, 2016.png
(
file
)
119 KB
1
12:54, 8 March 2018
Share of persons aged 16 and over reporting unmet needs for medical care examination or treatment, 2016.png
(
file
)
51 KB
1
12:49, 8 March 2018
Share of persons aged 15 and over reporting unmet needs for health care due to financial barriers, distance or transportation problems or long waiting lists, by age, 2014 or nearest year.png
(
file
)
48 KB
2
12:48, 8 March 2018
Share of persons aged 15 and over reporting unmet needs for health care, by specific reason, 2014 or nearest year.png
(
file
)
50 KB
1
14:25, 26 February 2018
Functional and activity limitations Health2017.xlsx
(
file
)
136 KB
2
14:00, 26 February 2018
Distribution of persons aged 65 and over with limitations to household activities, by level of educational attainment, 2014 or nearest year (%) Health2017.png.png
(
file
)
53 KB
2
13:30, 26 February 2018
Share of persons aged 16 and over with self-reported long-standing limitations in usual activities due to health problems, by educational attainment level, 2016 (%) Health2017.png
(
file
)
61 KB
1
13:28, 26 February 2018
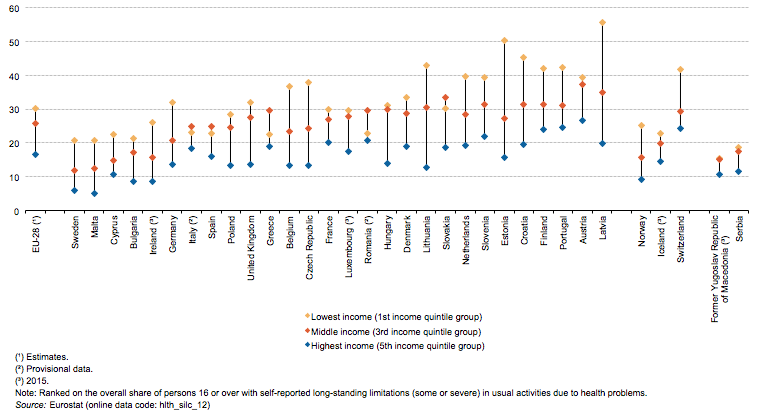
Share of persons aged 16 and over with self-reported long-standing limitations in usual activities due to health problems, by income, 2016 (%) Health2017.png
(
file
)
65 KB
1
13:25, 26 February 2018
Share of persons aged 16 and over with self-reported long-standing limitations in usual activities due to health problems, by sex and age, EU-28, 2016 (%) Health2017.png
(
file
)
29 KB
1
13:20, 26 February 2018
Distribution of persons aged 16 and over by self-reported long-standing limitations in usual activities due to health problems, by sex, 2016 (%) Health2017.png
(
file
)
109 KB
1
13:18, 26 February 2018
Share of persons aged 16 and over with self-reported long-standing limitations in usual activities due to health problems, 2016 (%) Health2017.png
(
file
)
55 KB
1
13:15, 26 February 2018
Share of persons aged 16 and over with self-reported long-standing limitations in usual activities due to health problems, by sex, 2016 (%) Health2017.png
(
file
)
62 KB
1
16:32, 21 February 2018
1.3 Self-perceived health HealthY2017.xlsx
(
file
)
130 KB
4
16:21, 21 February 2018
Share of persons aged 16 and over with very good or good self-perceived health, by educational attainment level, 2016 (%) Health2017.png
(
file
)
59 KB
1
16:21, 21 February 2018
Share of persons aged 16 and over with very good or good self-perceived health, by sex, 2016 (%) Health2017.png
(
file
)
65 KB
1
16:15, 21 February 2018
Share of persons aged 16 and over by self-perceived health status, by sex, 2016 (%) Health2017.png
(
file
)
87 KB
1
16:14, 21 February 2018
Share of persons aged 15 and over declaring moderate, severe or very severe bodily pain, by educational attainment level, 2014 or nearest year (%) Health2017.png
(
file
)
49 KB
1
16:03, 21 February 2018
Share of persons aged 16 and over with very good or good health, by income, 2016 (%) Health2017.png
(
file
)
62 KB
1
16:01, 21 February 2018
Share of persons aged 16 and over with or without long-standing (chronic) health problems, 2016 (%) Health2017.png
(
file
)
103 KB
2
16:00, 21 February 2018
Share of persons aged 16 and over with long-standing (chronic) health problems, by sex, 2016 (%) Health2017.png
(
file
)
53 KB
1
16:00, 21 February 2018
Share of persons aged 16 and over with long-standing (chronic) health problems, by sex and age, EU-28, 2016 (%) Health2017.png
(
file
)
20 KB
1
15:59, 21 February 2018
Share of persons aged 16 and over with long-standing (chronic) health problems, by labour status, 2016 (%) Health2017.png
(
file
)
62 KB
1
15:58, 21 February 2018
Share of persons aged 15 and over declaring moderate, severe or very severe bodily pain, 2014 or nearest year (%) Health2017.png
(
file
)
106 KB
1
First page
Previous page
Next page
Last page
Special page
ISSN 2443-8219
_HLTH2018.png)
.png)
_HLTH2018.png)
.png)
.png)
.png)
.png)
.png)
_HLTH18.png)
_HLTH18.png)
_HLTH18.png)


_Health2017.png.png)
_Health2017.png)
_Health2017.png)
_Health2017.png)
_Health2017.png)
_Health2017.png)
_Health2017.png)
_Health2017.png)
_Health2017.png)
_Health2017.png)
_Health2017.png)
_Health2017.png)
_health_problems,_2016_(%25)_Health2017.png)
_health_problems,_by_sex,_2016_(%25)_Health2017.png)
_health_problems,_by_sex_and_age,_EU-28,_2016_(%25)_Health2017.png)
_health_problems,_by_labour_status,_2016_(%25)_Health2017.png)
_Health2017.png)