Tutorials
Log in
Statistics Explained
menu
search
search
Navigation
Main page
Statistical themes
Glossary
Categories
Statistics 4 beginners
Tutorials
Help
Eurostat home
Education corner
Online publications
Regional yearbook
Sustainable development
Full list
Tools
User contributions
Logs
View user groups
Special pages
search
Navigation
Main page
Statistical themes
Glossary
Categories
Statistics 4 beginners
Tutorials
Help
Eurostat home
Education corner
Online publications
Regional yearbook
Sustainable development
Full list
Tools
User contributions
Logs
View user groups
Special pages
Navigation
Main page
Statistical themes
Glossary
Categories
Statistics 4 beginners
Tutorials
Help
Eurostat home
Education corner
Online publications
Regional yearbook
Sustainable development
Full list
Tools
User contributions
Logs
View user groups
Special pages
Uploads by Heidoch
This special page shows all uploaded files.
File list
Items per page:
20
50
100
250
500
Search for media name:
Username:
Include old versions of files
Go
First page
Previous page
Next page
Last page
Date
Name
Thumbnail
Size
Description
Versions
09:57, 30 September 2011
Chemicals statistics 2010-2011.xls
(
file
)
80 KB
1
09:51, 30 September 2011
Chemical management statistics 2010-2011 rev 1.xls
(
file
)
80 KB
1
09:48, 30 September 2011
Chemical management statistics 2010-2011.xls
(
file
)
80 KB
2
09:45, 30 September 2011
Chemical management statistics 2010-2011 rev1.xls
(
file
)
80 KB
1
09:29, 30 September 2011
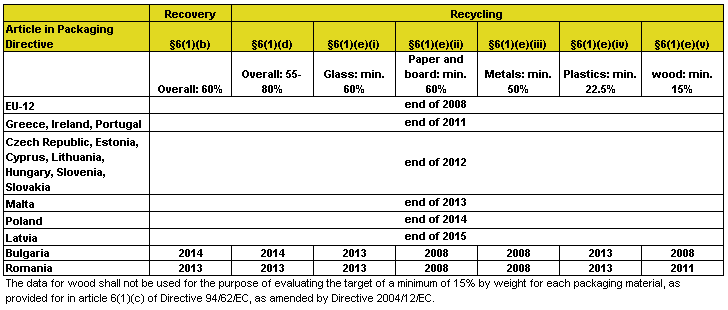
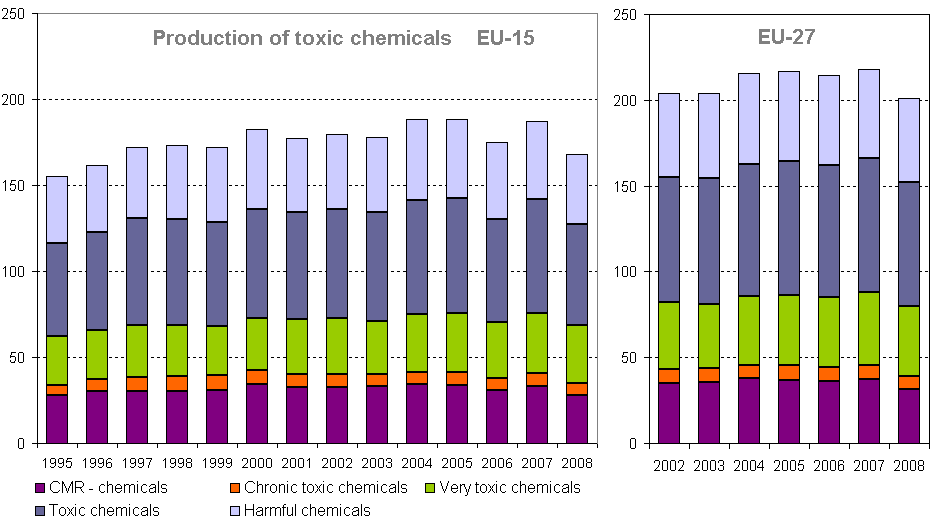
Production of toxic chemicals EU-15 and EU-27 (million tonnes).png
(
file
)
10 KB
2
09:27, 30 September 2011
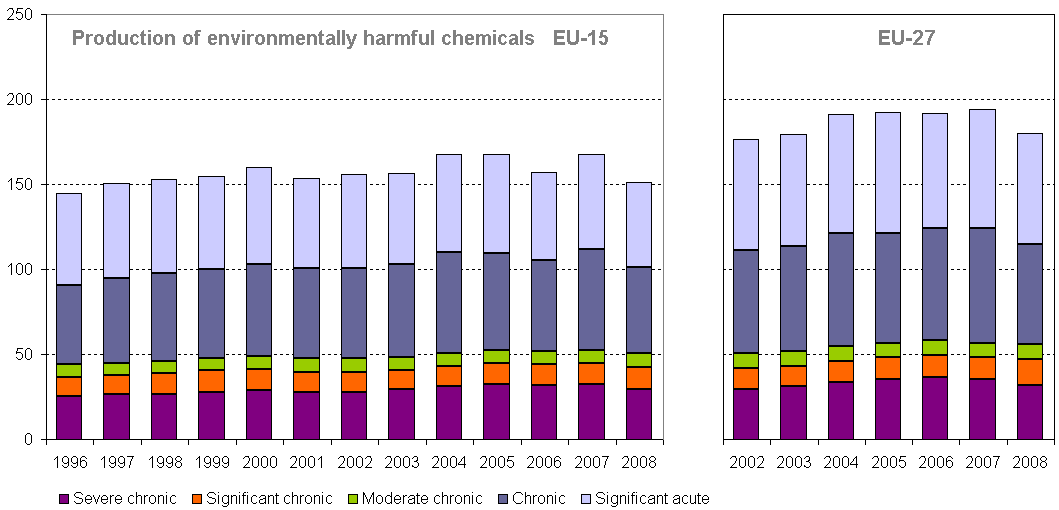
Production of environmentally harmful chemicals EU-15 and EU-27 (million tonnes).png
(
file
)
9 KB
2
16:10, 29 September 2011
Chemicals management statistics 2010-2011.xls
(
file
)
77 KB
1
16:06, 29 September 2011
Chemical management statistics 2010 2011.xls
(
file
)
133 KB
1
11:44, 29 September 2011
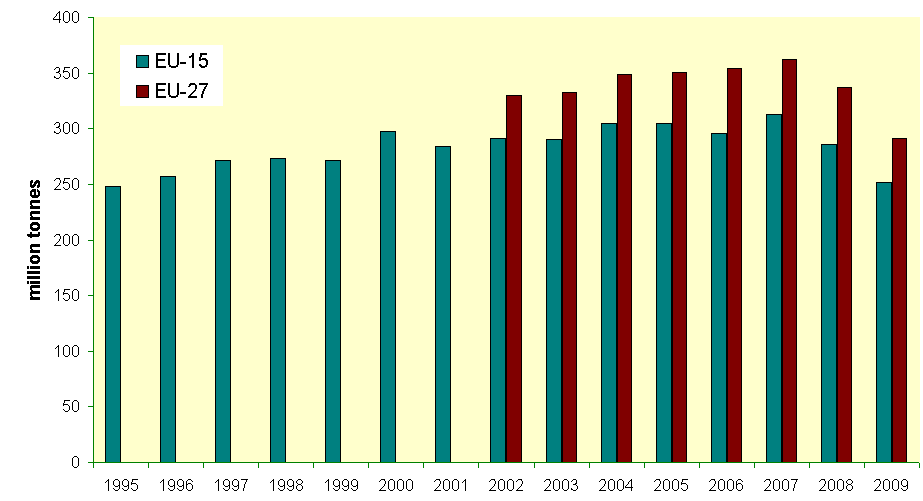
Total production of industrial chemicals (million tonnes).png
(
file
)
10 KB
1
16:30, 28 September 2011
GHG emissions from waste data and tables rev1.xls
(
file
)
83 KB
1
14:50, 28 September 2011
2006 landfilling of biodegradable waste as percentage of the 1995 biodegradable waste generation.PNG
(
file
)
13 KB
1
14:46, 28 September 2011
Per-capita GHG emissions in 2008 landfill.PNG
(
file
)
9 KB
1
13:50, 28 September 2011
Per-capita GHG emissions 1990 and 2008 for landfill.PNG
(
file
)
10 KB
1
11:50, 28 September 2011
GHG emissions in EU-15 and EU-27 for landfill and the sum of incineration without energy recovery and other treatments from 1990 to 2009, in 1000 t.PNG
(
file
)
11 KB
1
11:48, 28 September 2011
GHG emissions in EU-15 and EU-27 for landfill and the sum of incineration without energy recovery and other treatments from 1990 to 2009, in 1000 to.PNG
(
file
)
36 KB
1
15:13, 14 September 2011
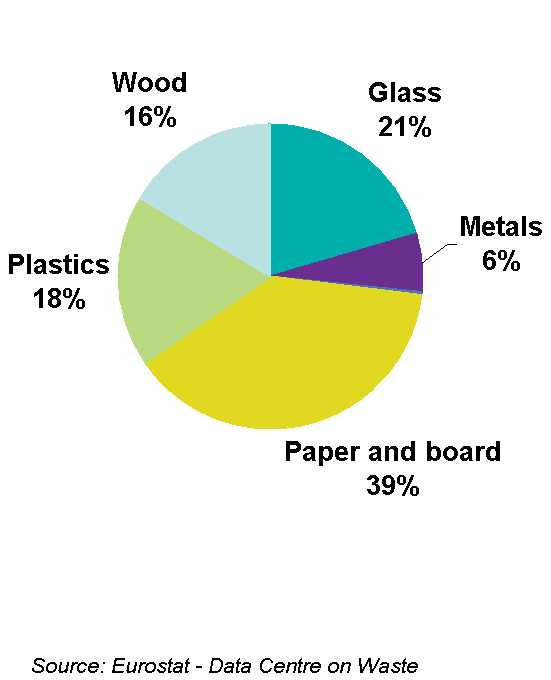
Shares of packaging waste generated by weight, EU-27 2008 (in %).PNG
(
file
)
13 KB
1
15:03, 14 September 2011
Shares of packaging waste generated by weight, EU-27 in 2008 (in %).PNG
(
file
)
6 KB
1
10:44, 31 August 2011
Figure 1 Shares of packaging waste generated by weight EU-27 2008.png
(
file
)
5 KB
1
10:12, 31 August 2011
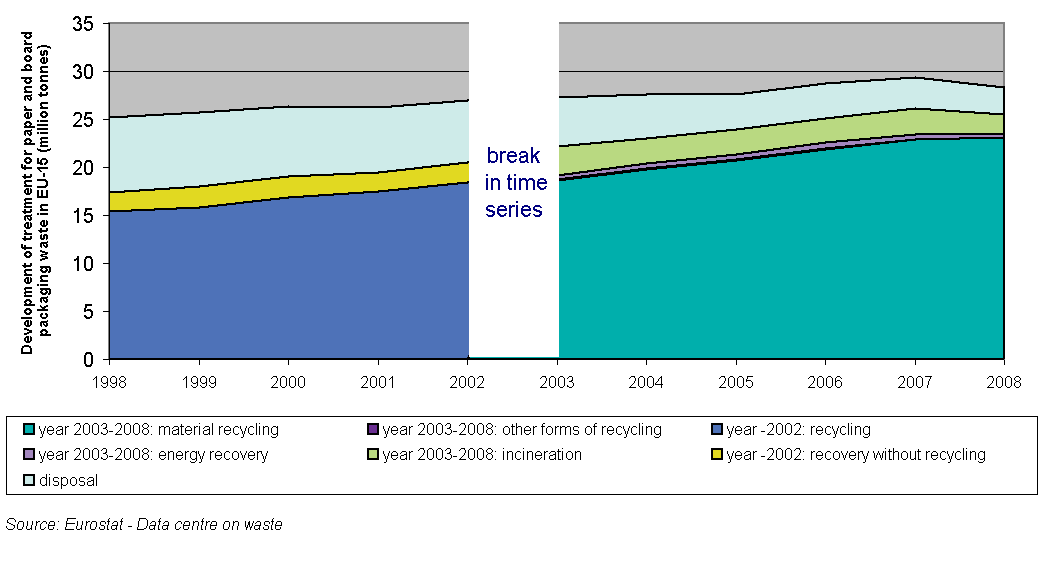
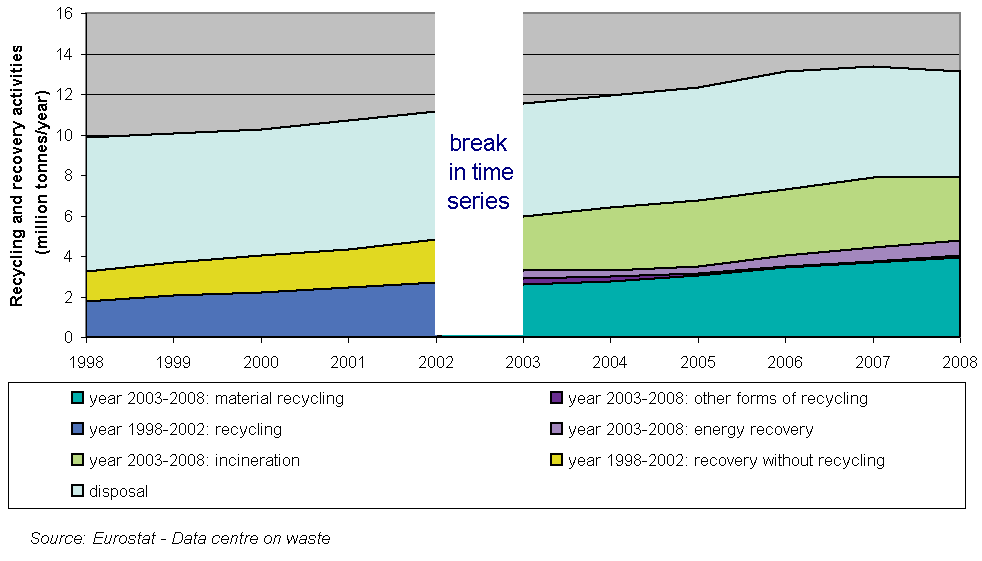
Figure 9 Recycling and recovery operation for paper and board packaging EU-15 1998-2008.PNG
(
file
)
11 KB
1
10:05, 31 August 2011
Figure 12 Recycling and recovery operations for plastics packaging EU-15 1998-2008.PNG
(
file
)
10 KB
1
09:07, 31 August 2011
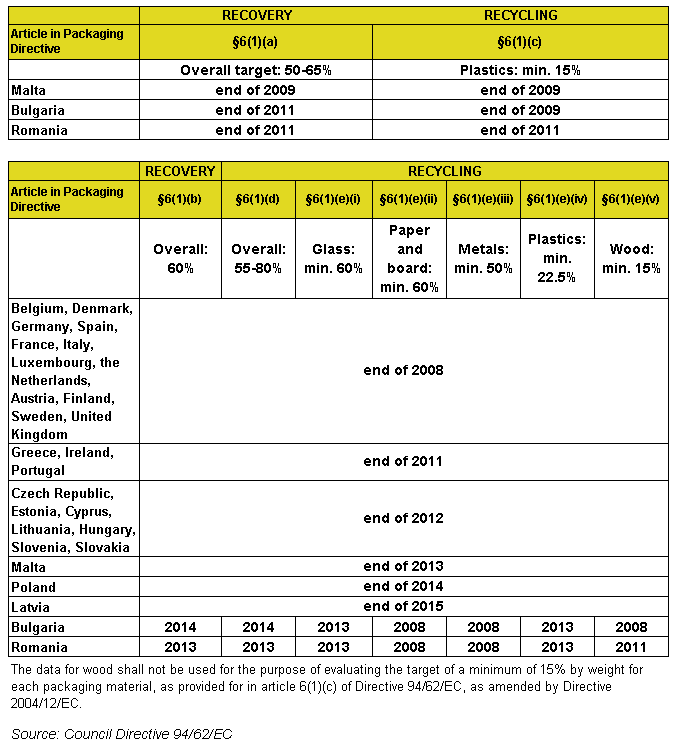
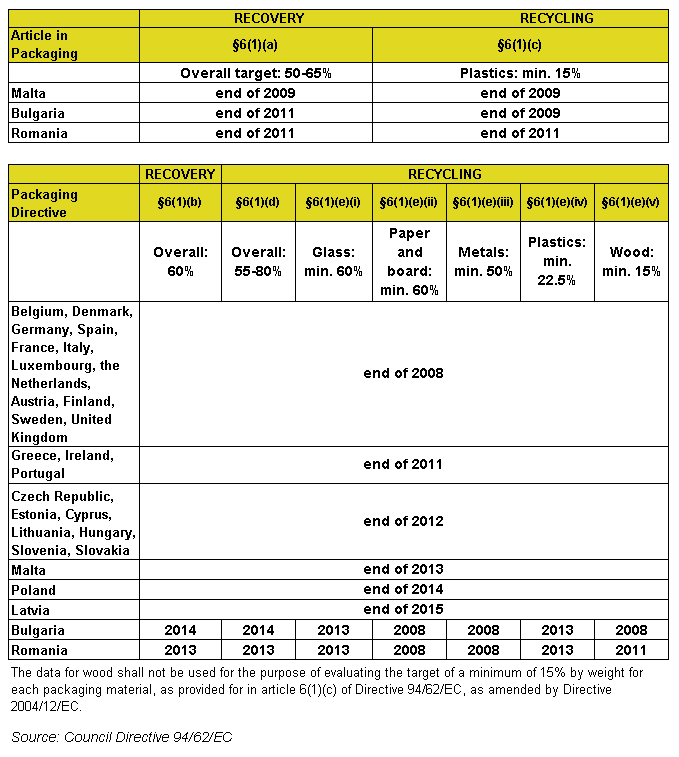
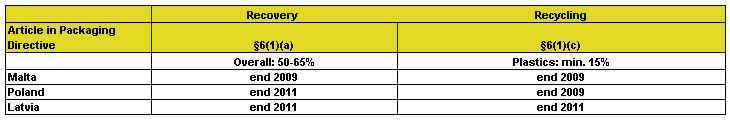
Table First and second stage targets and implementation dates.PNG
(
file
)
15 KB
1
08:58, 31 August 2011
Table 1 First and second stage targets and the dates.PNG
(
file
)
15 KB
1
16:59, 17 August 2011
Packaging SE August 2011 final.xls
(
file
)
188 KB
1
16:47, 17 August 2011
Figure 15 Indicative recycling rate for wood packaging, 2008.PNG
(
file
)
11 KB
2
16:44, 17 August 2011
Figure 14 Recycling rate for plastics packaging, 2008.PNG
(
file
)
12 KB
2
15:35, 17 August 2011
Figure 17 Recovery rates for all packaging, 2008.PNG
(
file
)
12 KB
2
15:31, 17 August 2011
Figure 16 Recycling rate for all packaging, 2008.PNG
(
file
)
13 KB
2
13:43, 17 August 2011
Figure 13 Share of recycling and recovery operations for plastics packaging, EU-15, 2008.PNG
(
file
)
32 KB
2
13:40, 17 August 2011
Figure 12 Recycling and recovery operations for plastics packaging, EU-15, 1998-2008.PNG
(
file
)
10 KB
2
13:31, 17 August 2011
Figure 11 Recycling rate for metal packaging, 2008.PNG
(
file
)
40 KB
1
13:09, 17 August 2011
Figure 13 Recycling and recovery operation for plastic packaging, EU-15, 1998-2008.PNG
(
file
)
10 KB
2
12:59, 17 August 2011
Figure 9 Recycling and recovery operation for paper and board packaging, EU-15, 1998-2008.PNG
(
file
)
11 KB
2
11:36, 17 August 2011
Figure 1 Shares of packaging waste generated by weight, EU-27, 2008.png
(
file
)
15 KB
3
17:44, 16 August 2011
Table 1 First stage targets.PNG
(
file
)
2 KB
2
17:42, 16 August 2011
Table 2 Second stage targets and the dates.PNG
(
file
)
7 KB
2
10:14, 7 October 2010
Chemicals management, table and graph update 2009 2.xls
(
file
)
127 KB
1
14:25, 6 October 2010
Production of toxic chemicals EU15 EU27 2009.png
(
file
)
11 KB
1
14:24, 6 October 2010
Production of environmentally harmful chemicals EU15 EU27 2009.png
(
file
)
11 KB
1
14:16, 6 October 2010
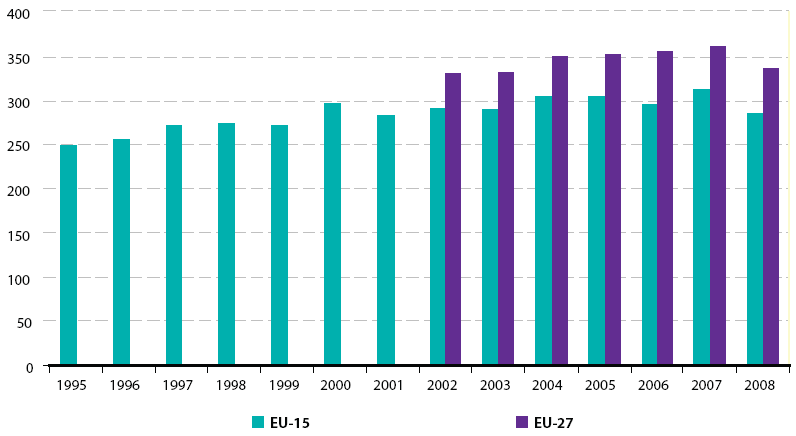
Total production of chemicals EU15 EU27 2009.png
(
file
)
8 KB
1
17:40, 1 October 2010
Chemicals management, table and graph rev 2.xls
(
file
)
154 KB
1
18:03, 23 September 2010
Chemicals management, table and graph.xls
(
file
)
164 KB
1
11:57, 21 September 2010
Production of toxic chemicals EU15 EU27 rev2.png
(
file
)
9 KB
1
11:51, 21 September 2010
Production of toxic chemicals EU15 EU27.png
(
file
)
9 KB
2
11:33, 21 September 2010
Production of environmentally harmful chemicals EU15 EU27.png
(
file
)
11 KB
1
11:03, 21 September 2010
Total production of chemicals in EU15 and EU27.png
(
file
)
9 KB
1
12:03, 31 August 2010
REACH Baseline Cover.PNG
(
file
)
416 KB
2
11:29, 31 August 2010
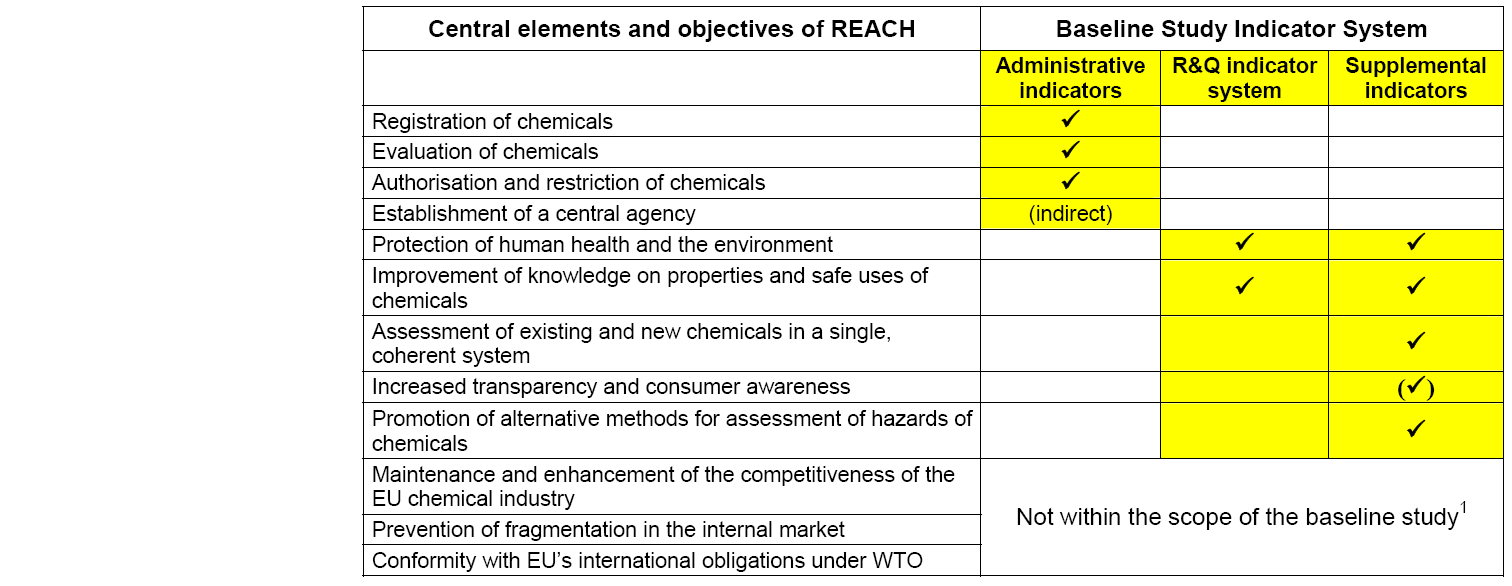
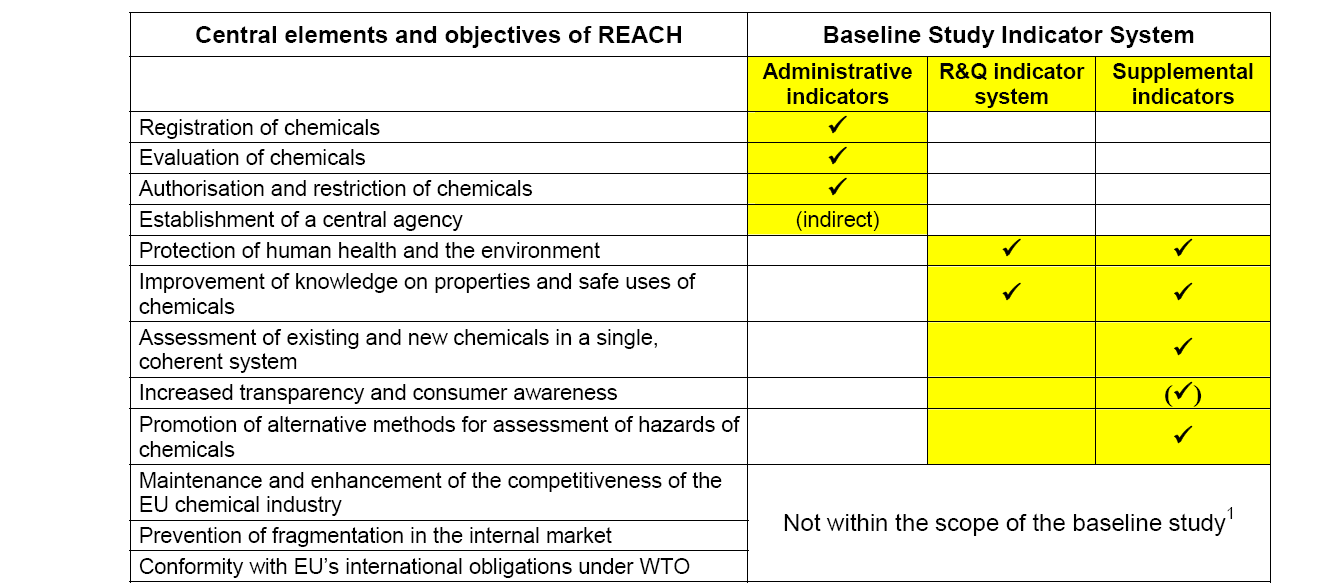
REACH Objectives rev2.PNG
(
file
)
71 KB
1
11:23, 31 August 2010
REACH Objectives rev1.PNG
(
file
)
69 KB
1
11:20, 31 August 2010
REACH Objectives.PNG
(
file
)
69 KB
3
14:26, 30 August 2010
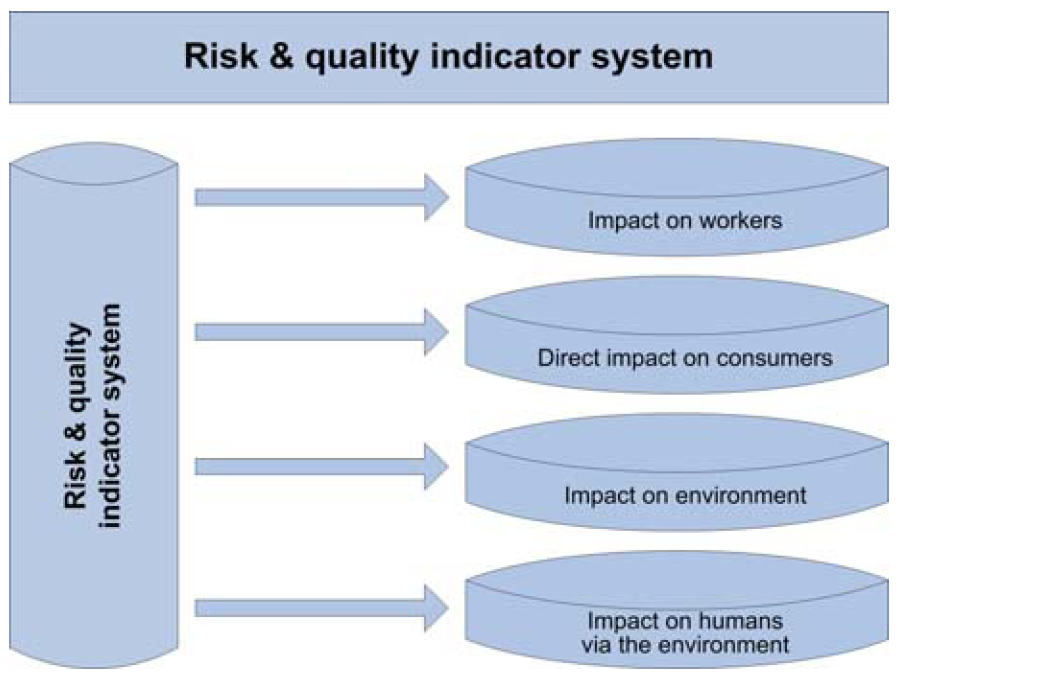
REACH baseline study 4 impact areas.PNG
(
file
)
342 KB
1
First page
Previous page
Next page
Last page
Special page
ISSN 2443-8219
.png)
.png)
.png)


.PNG)
.PNG)


