Tutorials
Log in
Statistics Explained
menu
search
search
Navigation
Main page
Statistical themes
Glossary
Categories
Statistics 4 beginners
Tutorials
Help
Eurostat home
Education corner
Online publications
Regional yearbook
Sustainable development
Full list
Tools
User contributions
Logs
View user groups
Special pages
search
Navigation
Main page
Statistical themes
Glossary
Categories
Statistics 4 beginners
Tutorials
Help
Eurostat home
Education corner
Online publications
Regional yearbook
Sustainable development
Full list
Tools
User contributions
Logs
View user groups
Special pages
Navigation
Main page
Statistical themes
Glossary
Categories
Statistics 4 beginners
Tutorials
Help
Eurostat home
Education corner
Online publications
Regional yearbook
Sustainable development
Full list
Tools
User contributions
Logs
View user groups
Special pages
Uploads by Budekto
This special page shows all uploaded files.
File list
Items per page:
20
50
100
250
500
Search for media name:
Username:
Include old versions of files
Go
First page
Previous page
Next page
Last page
Date
Name
Thumbnail
Size
Description
Versions
18:59, 22 July 2024
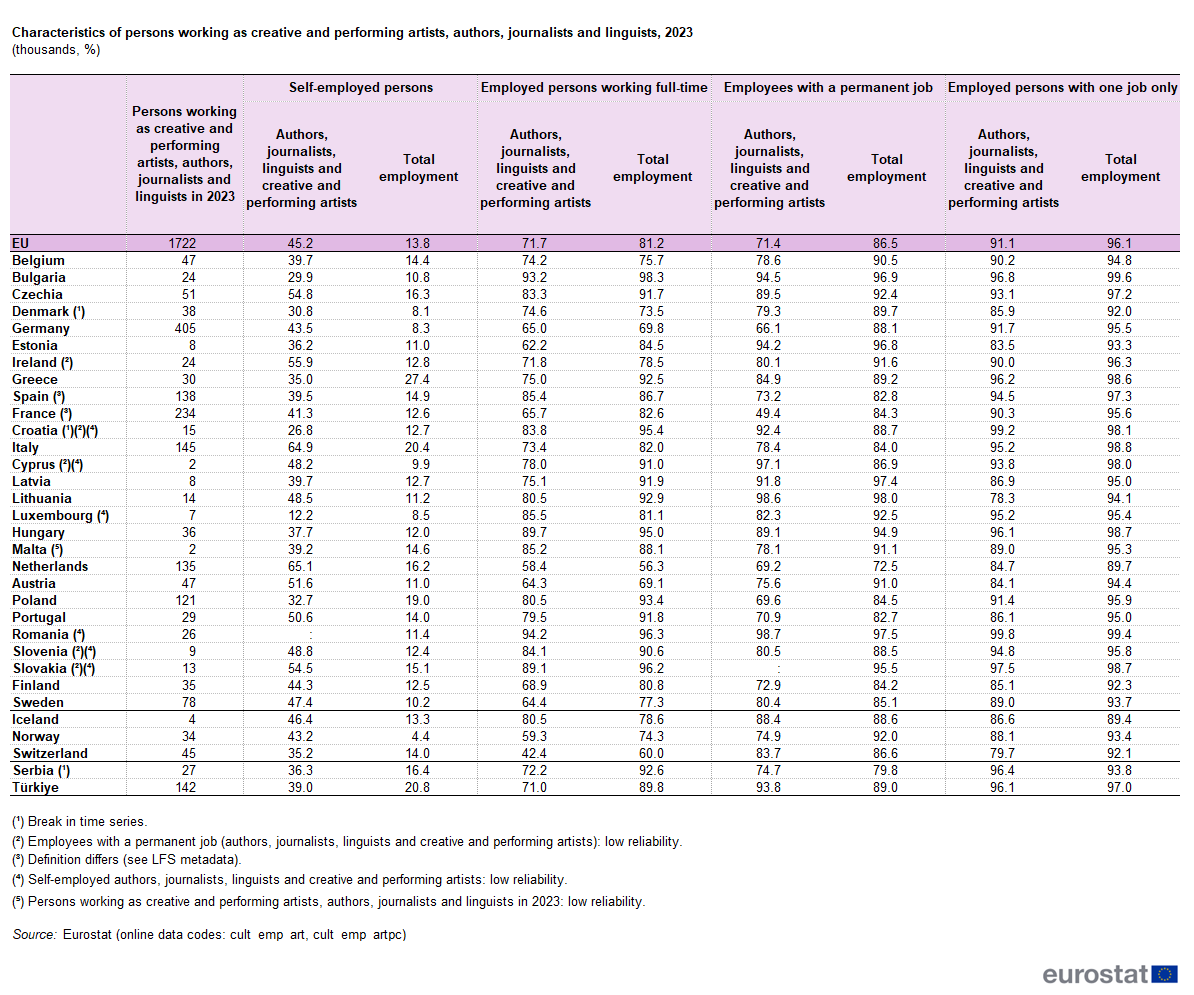
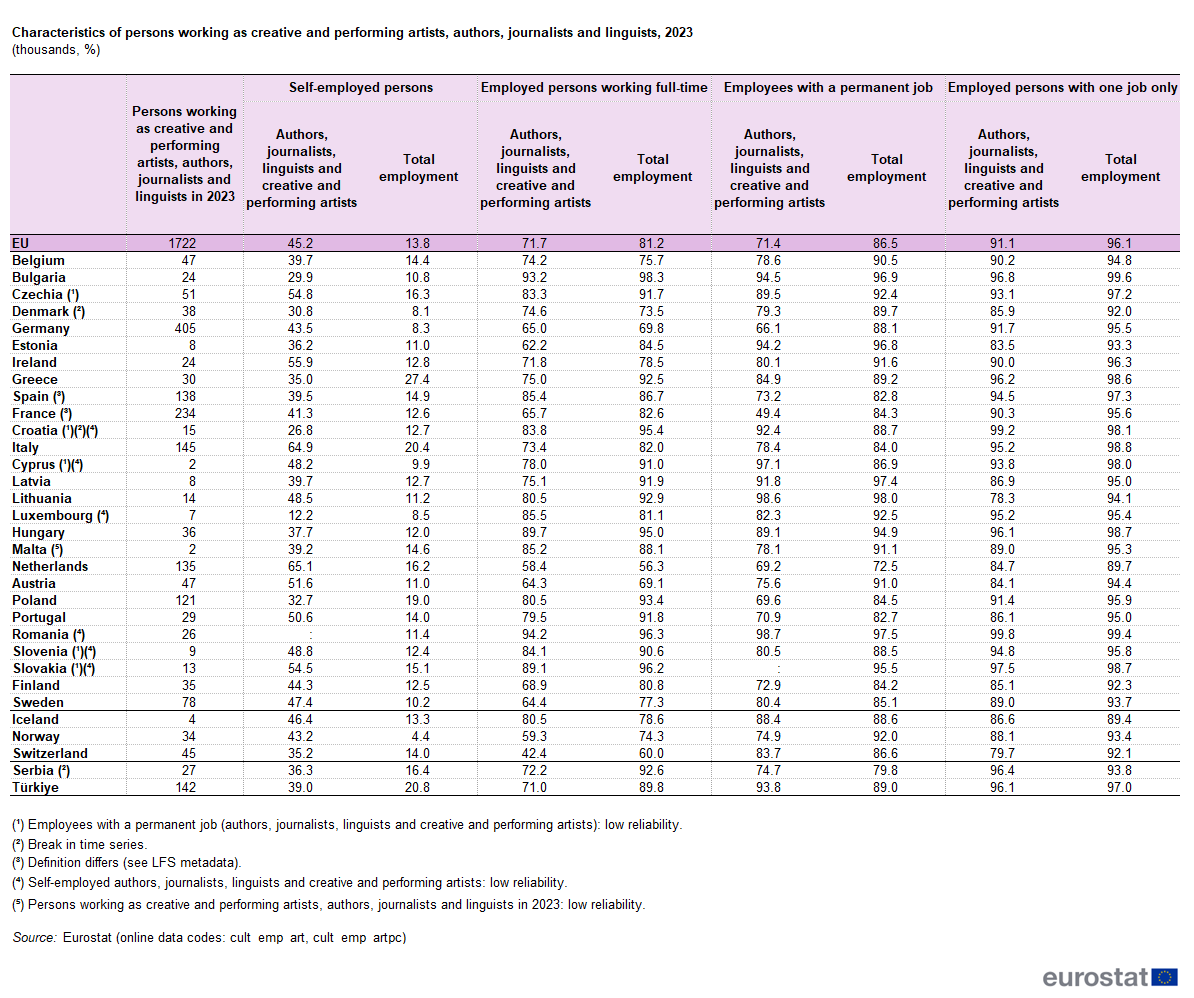
Table 3 - Characteristics of persons working as creative and performing artists, authors, journalists and linguists, 2023.png
(
file
)
87 KB
null
1
18:58, 22 July 2024
Culture statistics - cultural employment (2024).xlsx
(
file
)
859 KB
null
1
18:30, 22 July 2024
Culture statistics - cultural employment 2024.xlsx
(
file
)
859 KB
null
1
18:30, 22 July 2024
Table 3 - Characteristics of persons working as creative and performing artists, authors, journalists and linguists, 2023 (thousands, %).png
(
file
)
87 KB
null
1
18:30, 22 July 2024
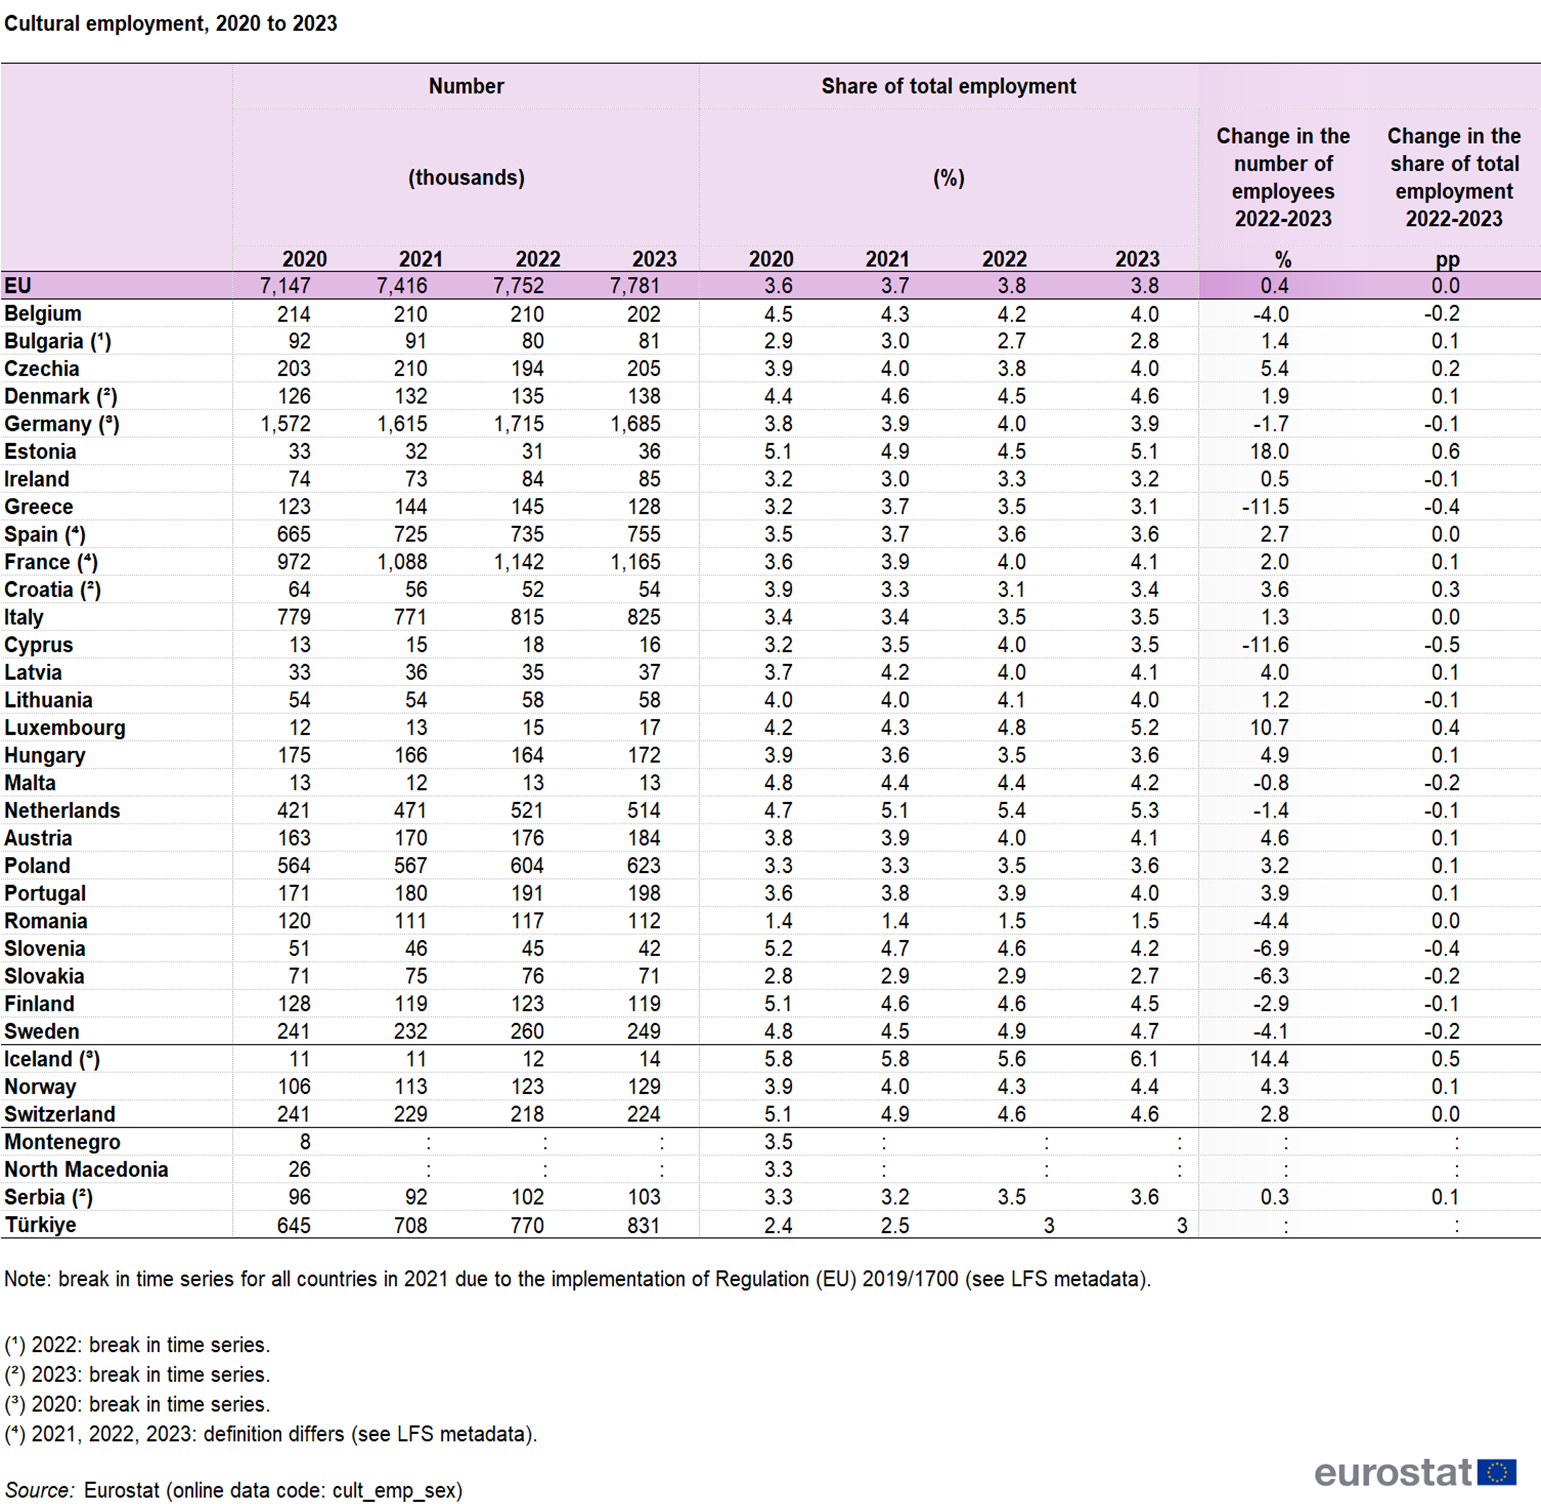
Table 1 - Cultural employment, 2020 to 2023.png
(
file
)
723 KB
null
1
18:30, 22 July 2024
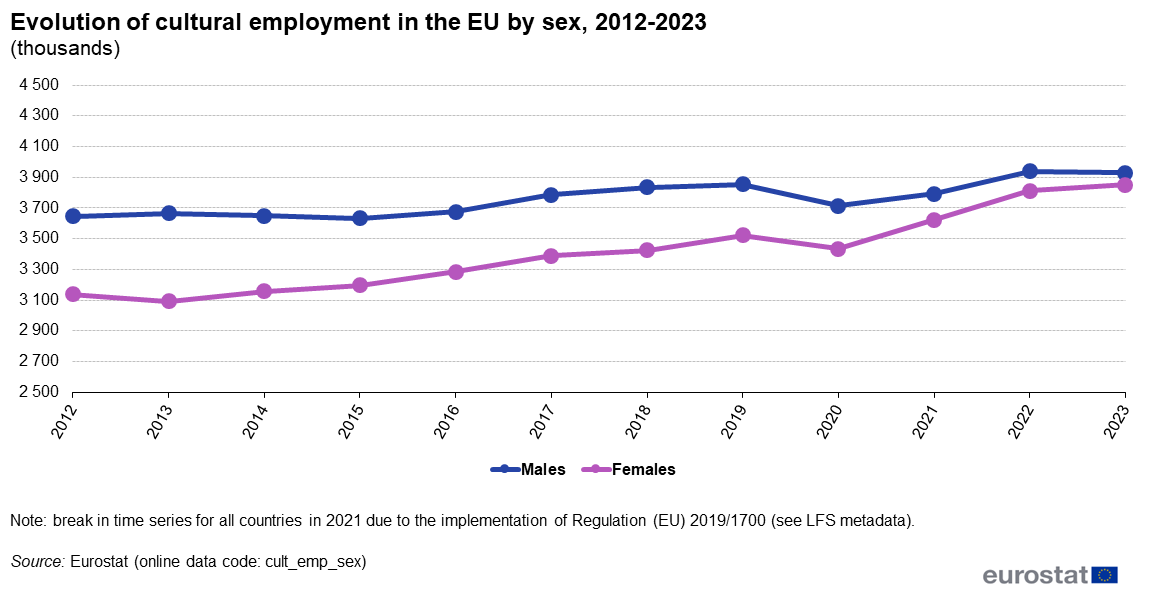
Figure 4 - Evolution of cultural employment in the EU by sex, 2012-2023 (thousands).png
(
file
)
38 KB
null
1
18:30, 22 July 2024
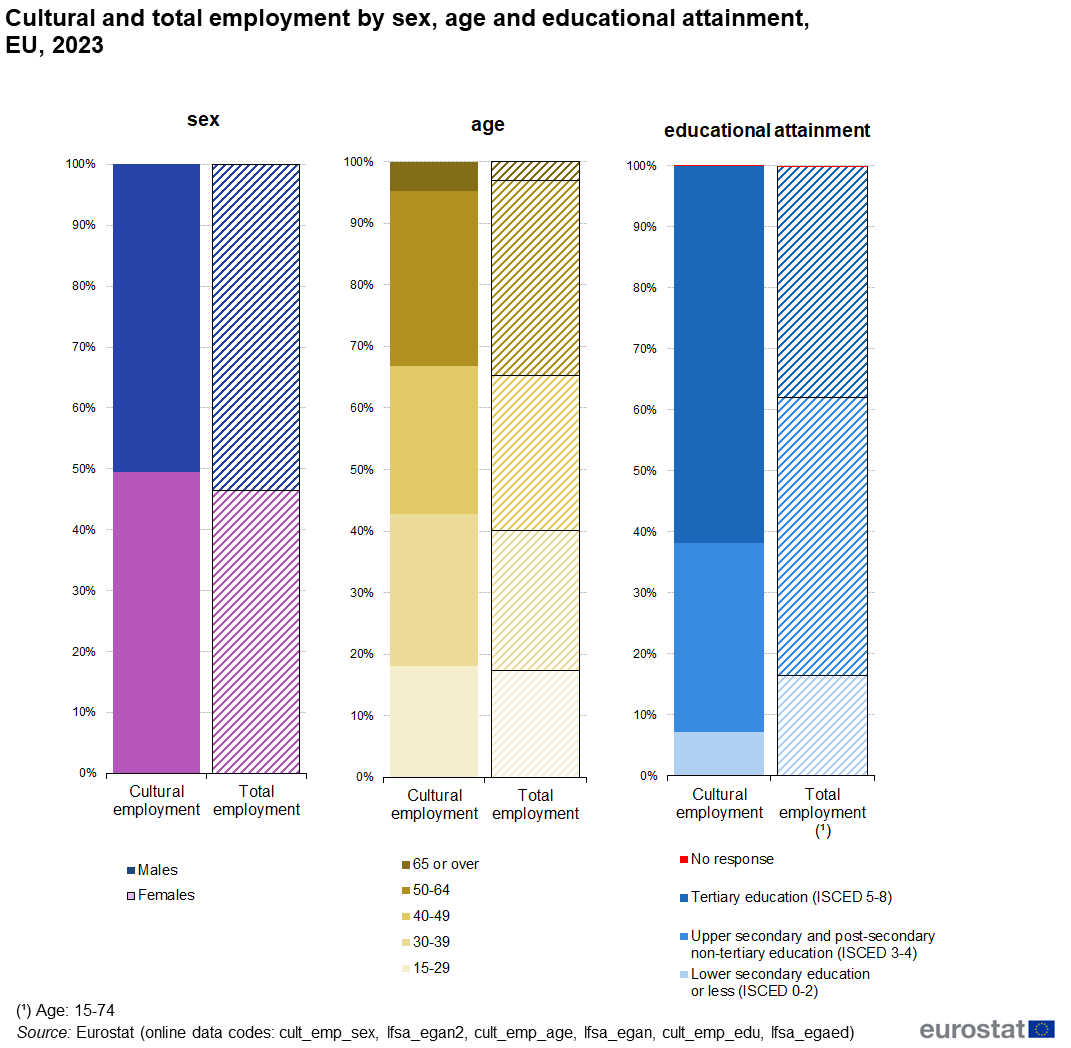
Figure 3 - Cultural and total employment by sex, age and educational attainment, EU, 2023 .png
(
file
)
67 KB
null
1
18:30, 22 July 2024
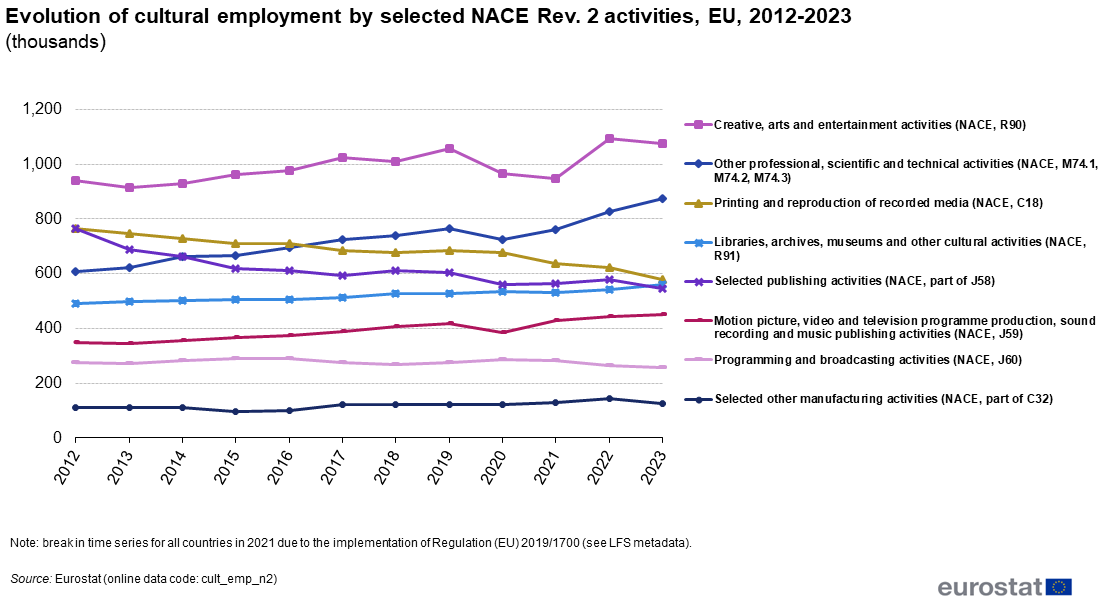
Figure 2 - Evolution of cultural employment by selected NACE Rev 2 activities, EU, 2012-2023 (thousands).png
(
file
)
55 KB
null
1
18:30, 22 July 2024
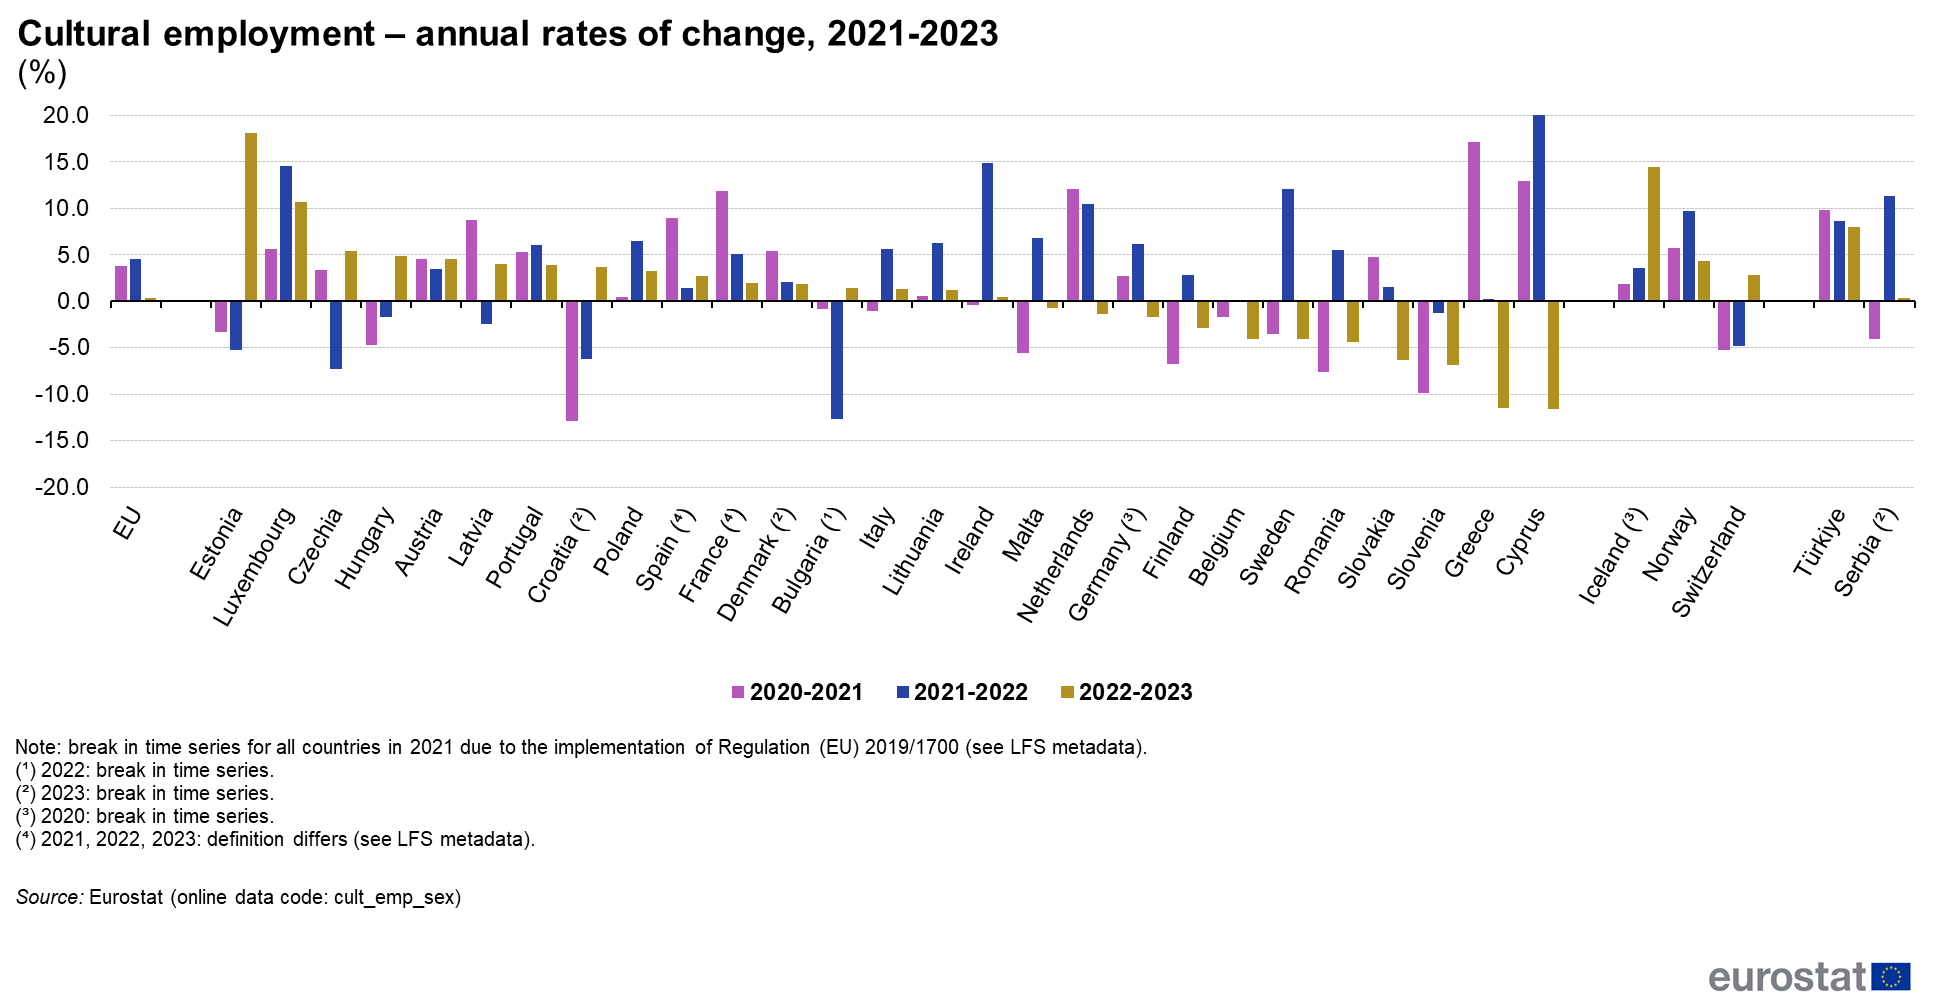
Figure 1 - Cultural employment ‒ annual rates of change, 2021-2023 (%).png
(
file
)
111 KB
null
1
18:30, 22 July 2024
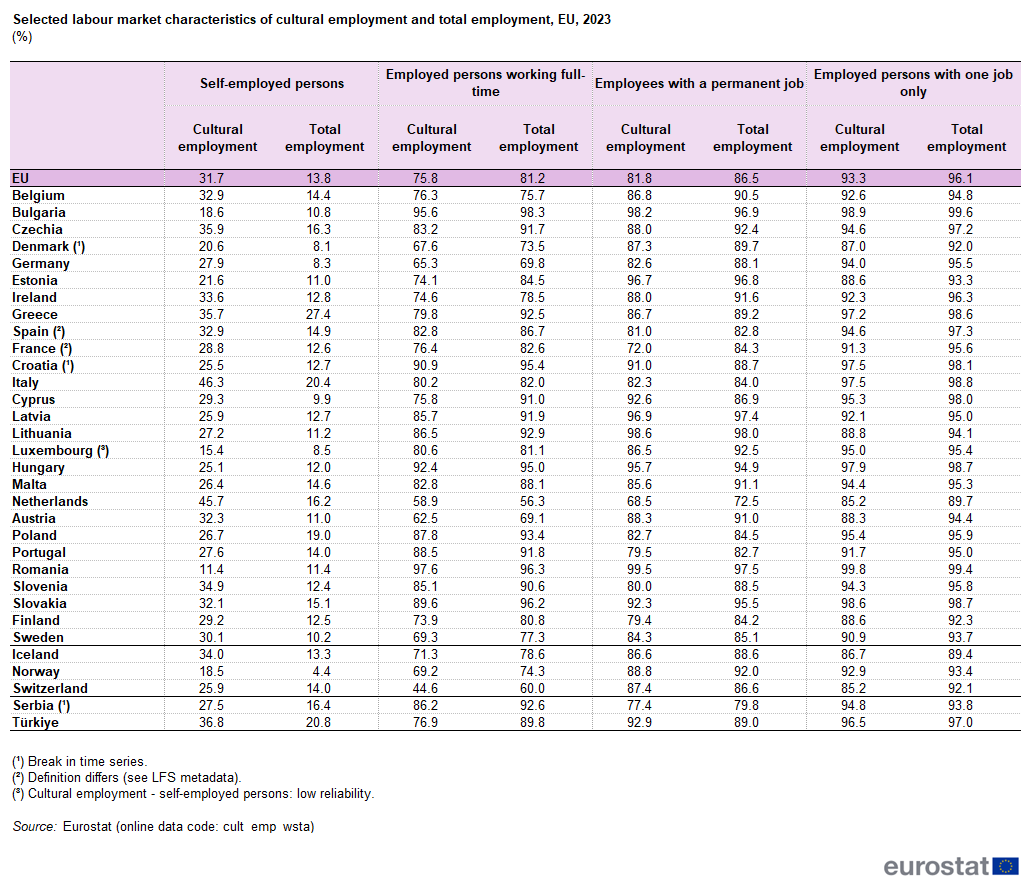
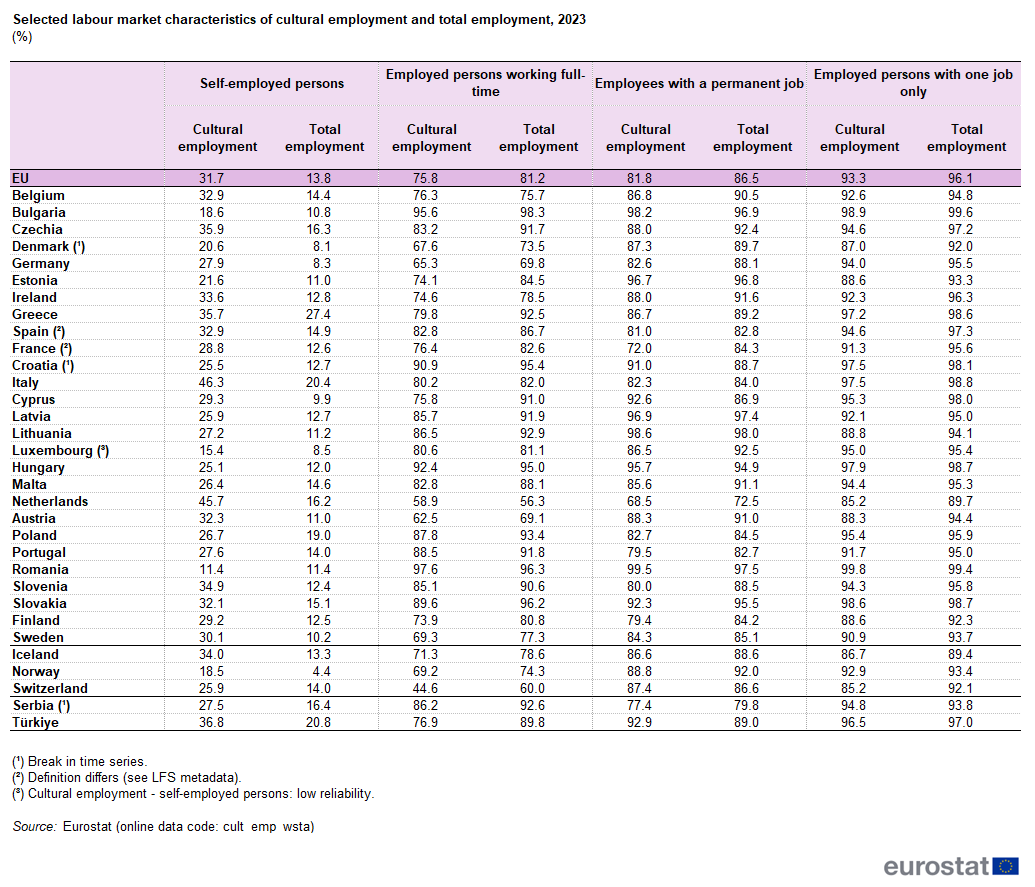
Table 2 - Selected labour market characteristics of cultural employment and total employment, EU, 2023 (%).png
(
file
)
121 KB
null
1
18:30, 22 July 2024
Table 2 - Selected labour market characteristics of cultural employment and total employment, 2023 (%).png
(
file
)
121 KB
null
1
18:30, 22 July 2024
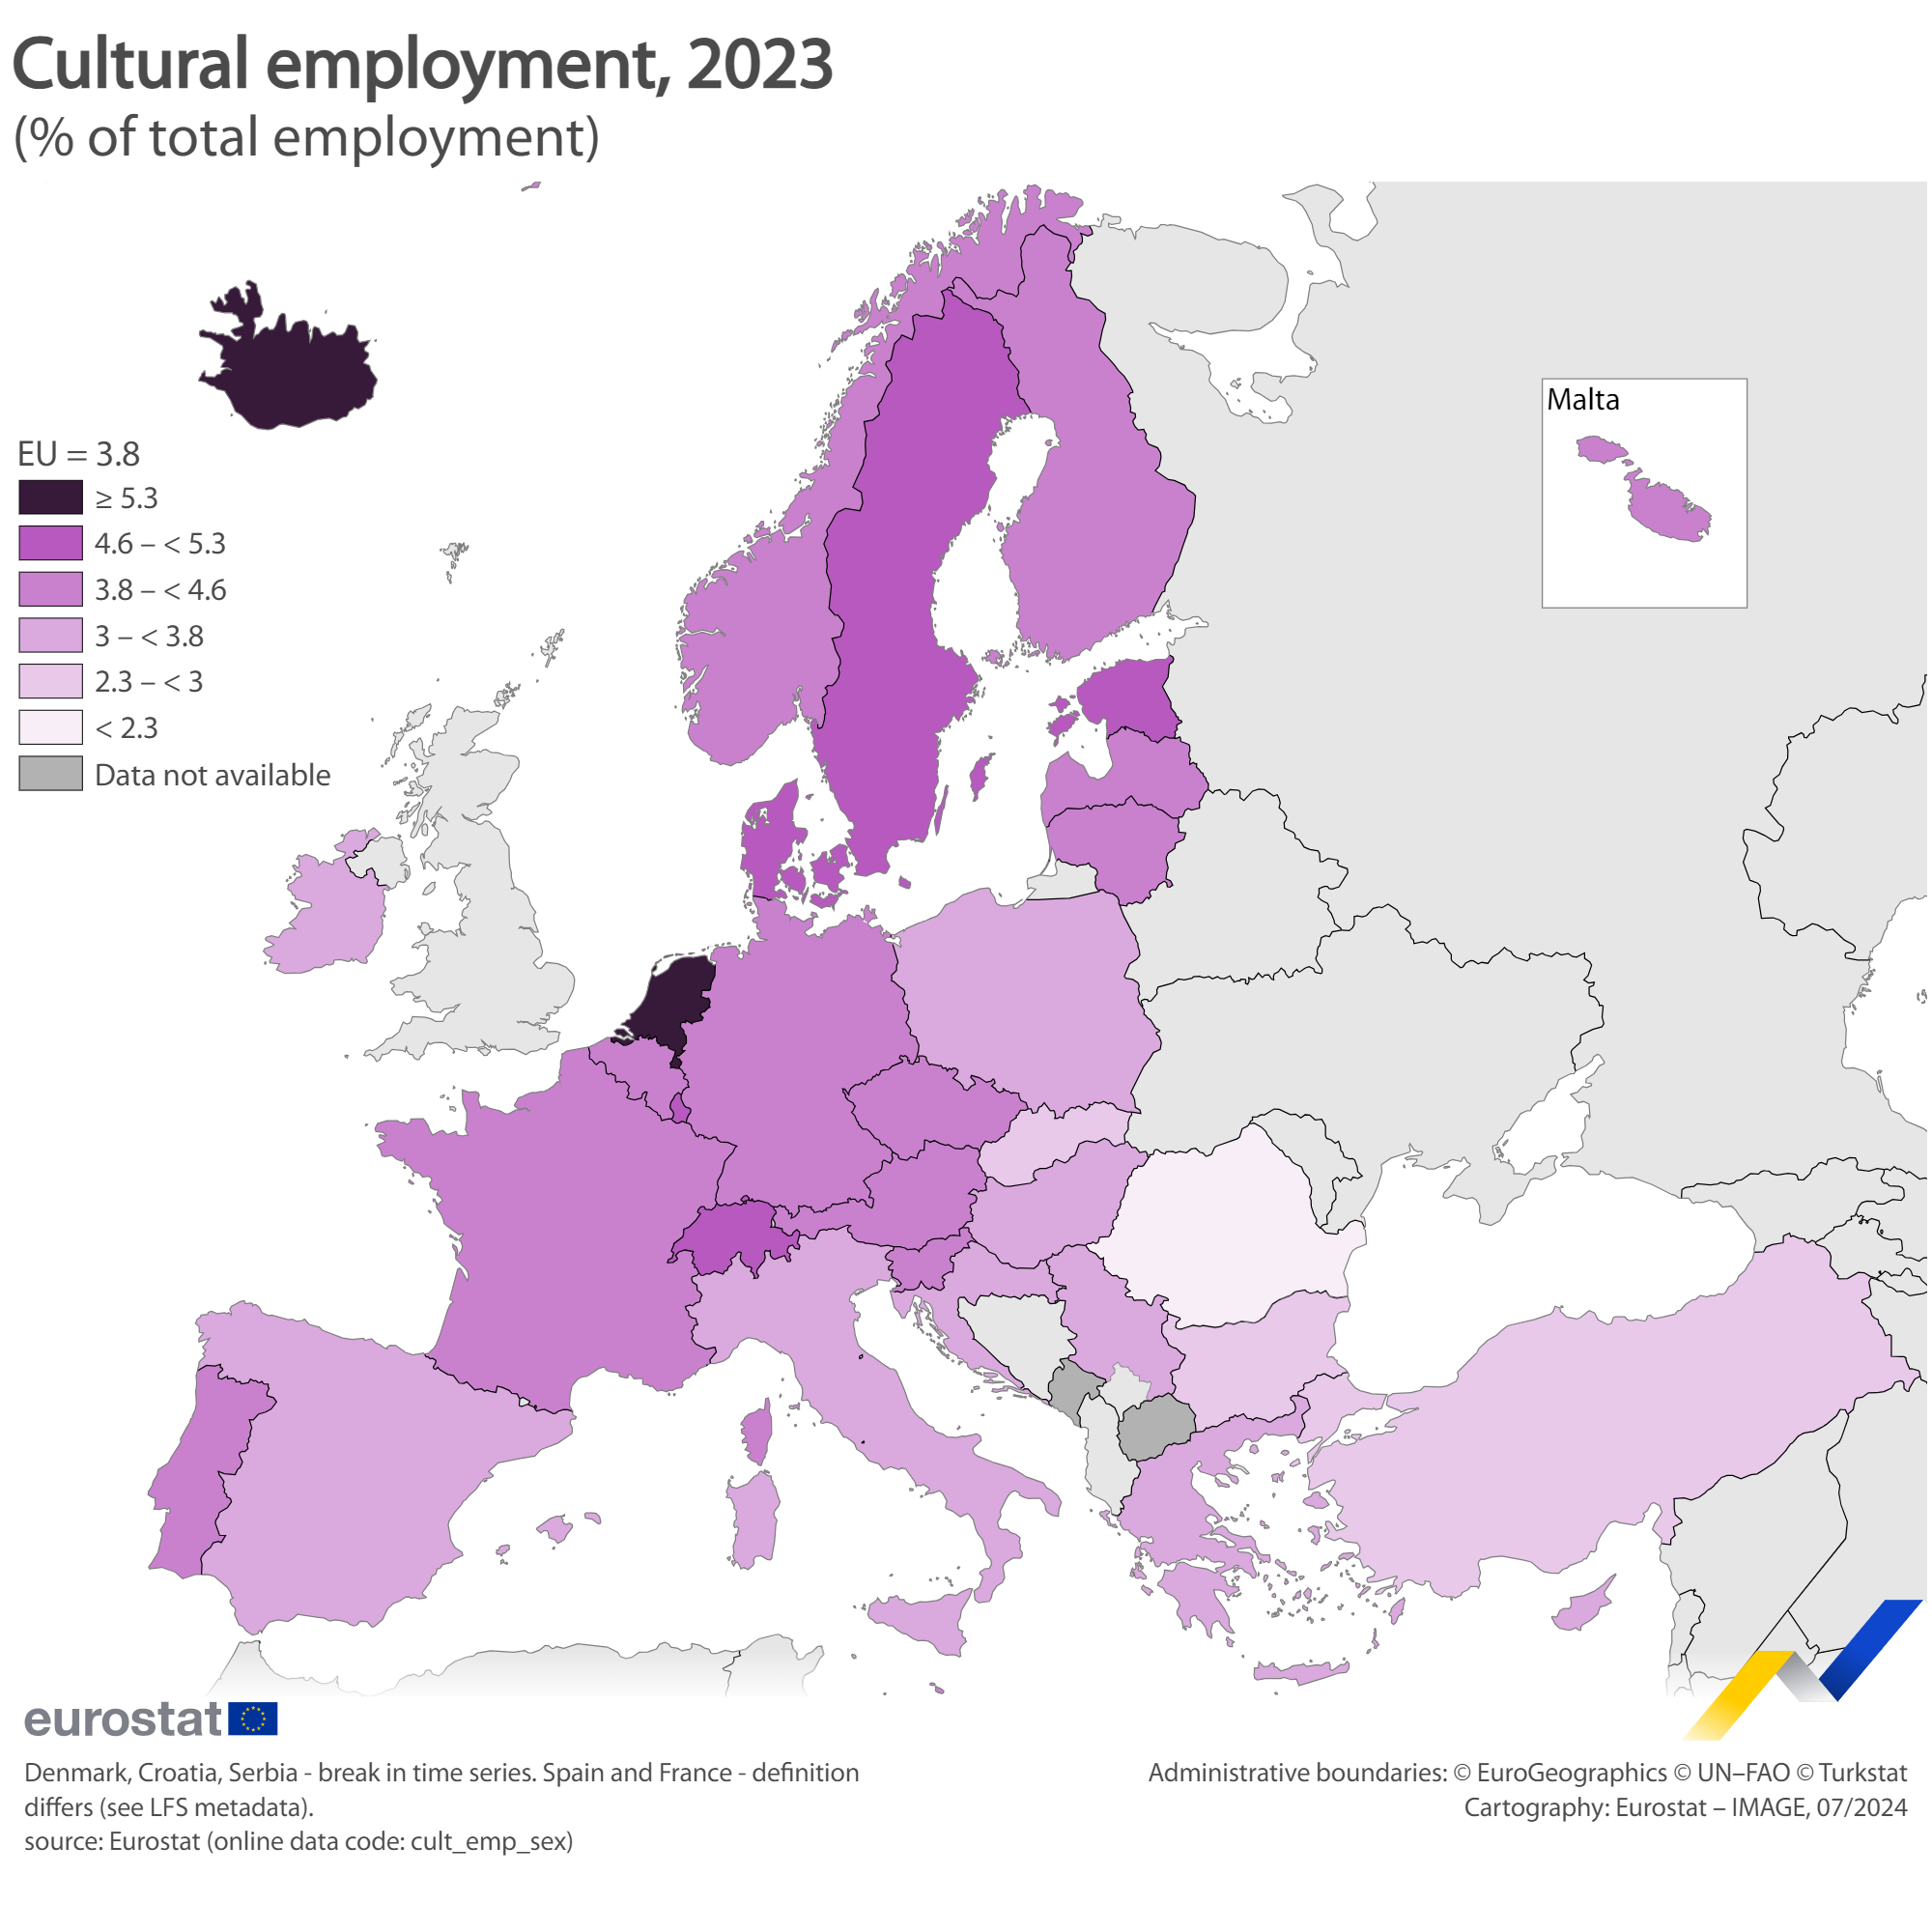
Map 1 - Cultural employment 2023.png
(
file
)
652 KB
null
1
18:30, 22 July 2024
Figure 5 - Definition of the scope of cultural employment — examples.png
(
file
)
77 KB
null
2
18:30, 22 July 2024
Figure 4 - Evolution of cultural employment in the EU by sex, 2013-2023 (thousands).png
(
file
)
38 KB
null
1
16:56, 20 June 2024
Culture statistics - Culture-related education (2024).xlsx
(
file
)
85 KB
null
1
16:55, 20 June 2024
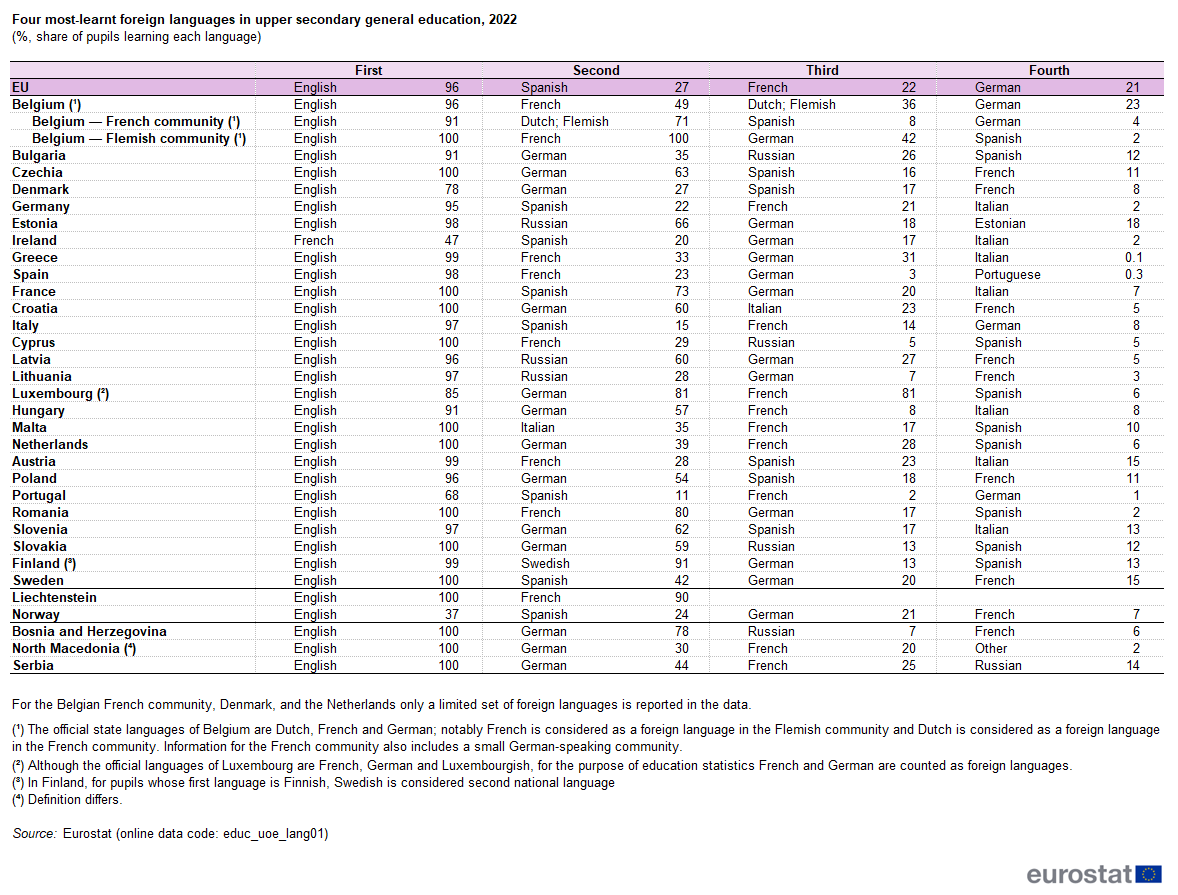
Table 2 - Four most-learnt foreign languages in upper secondary general education 2022.png
(
file
)
89 KB
null
1
16:55, 20 June 2024
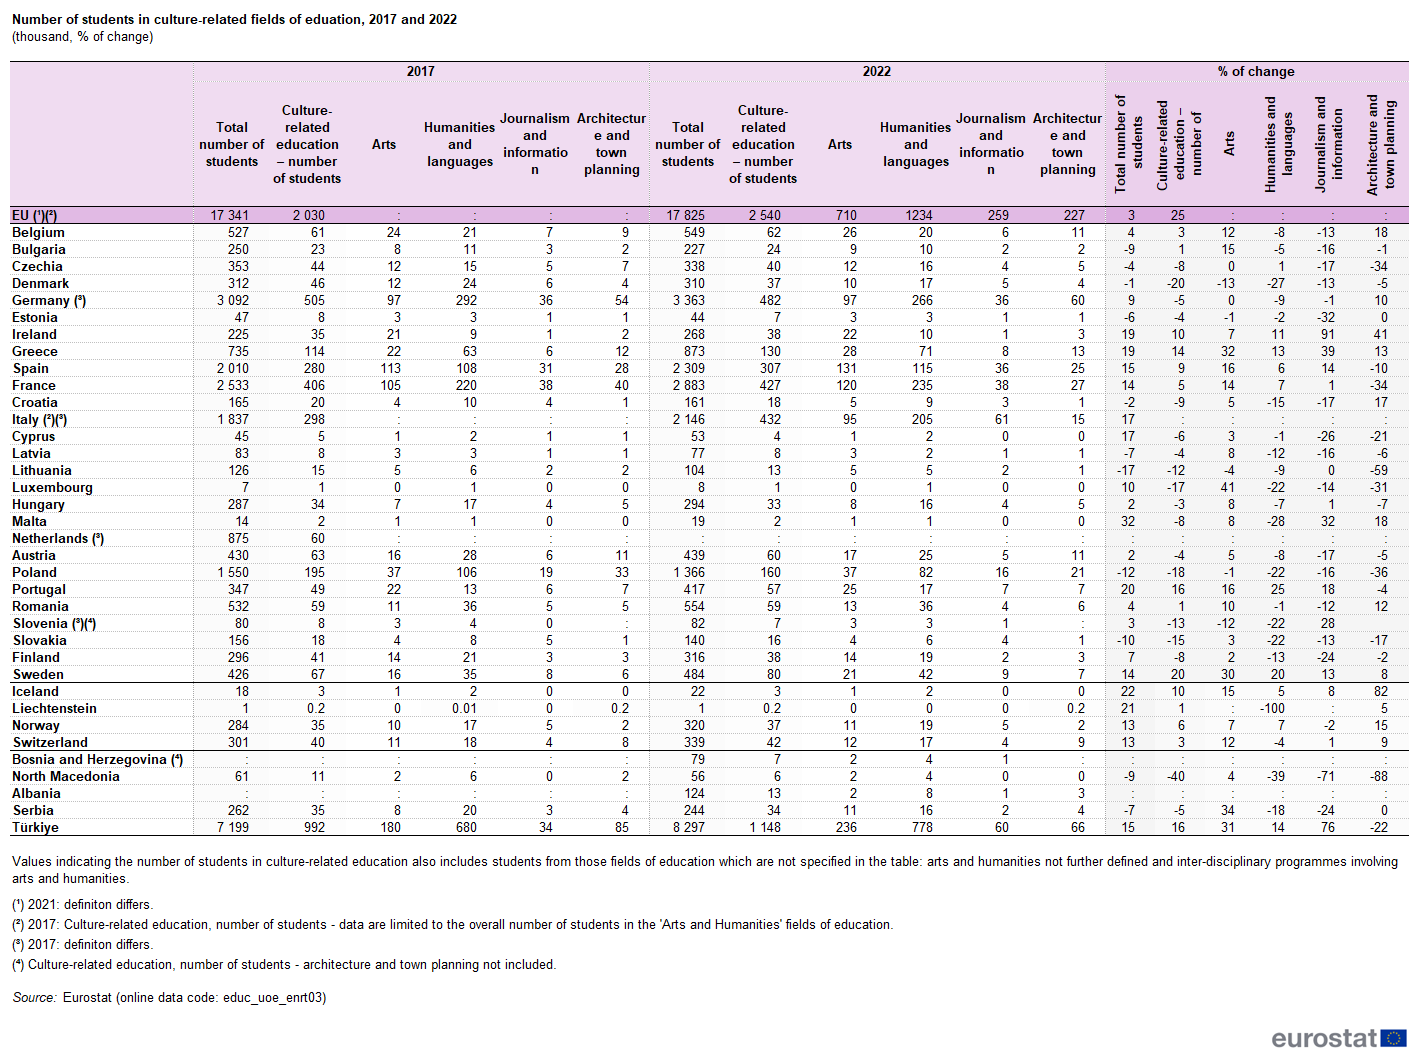
Table 1 - Number of students in culture-related fields of eduation 2017 and 2022.png
(
file
)
123 KB
null
1
16:55, 20 June 2024
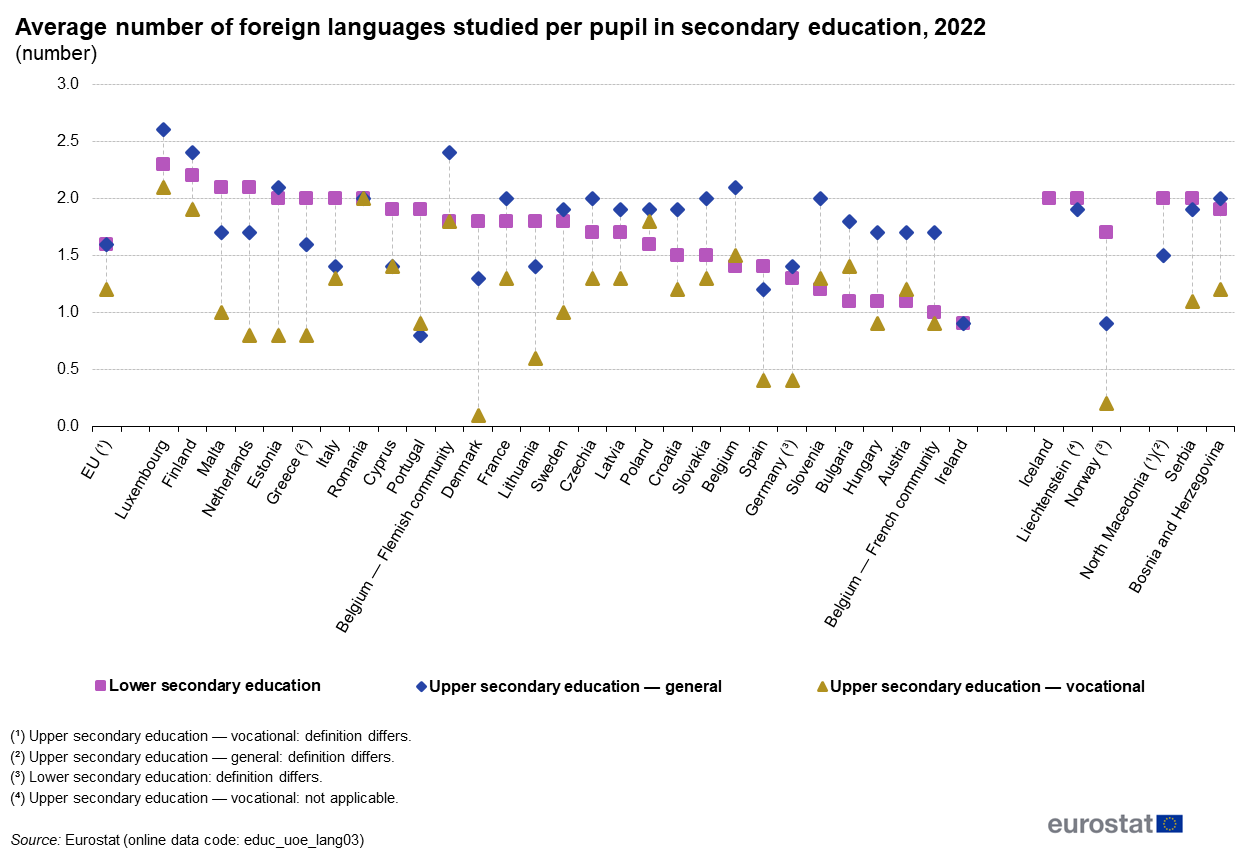
Figure 4 - Average number of foreign languages studied per pupil in secondary education 2022.png
(
file
)
75 KB
null
1
16:55, 20 June 2024
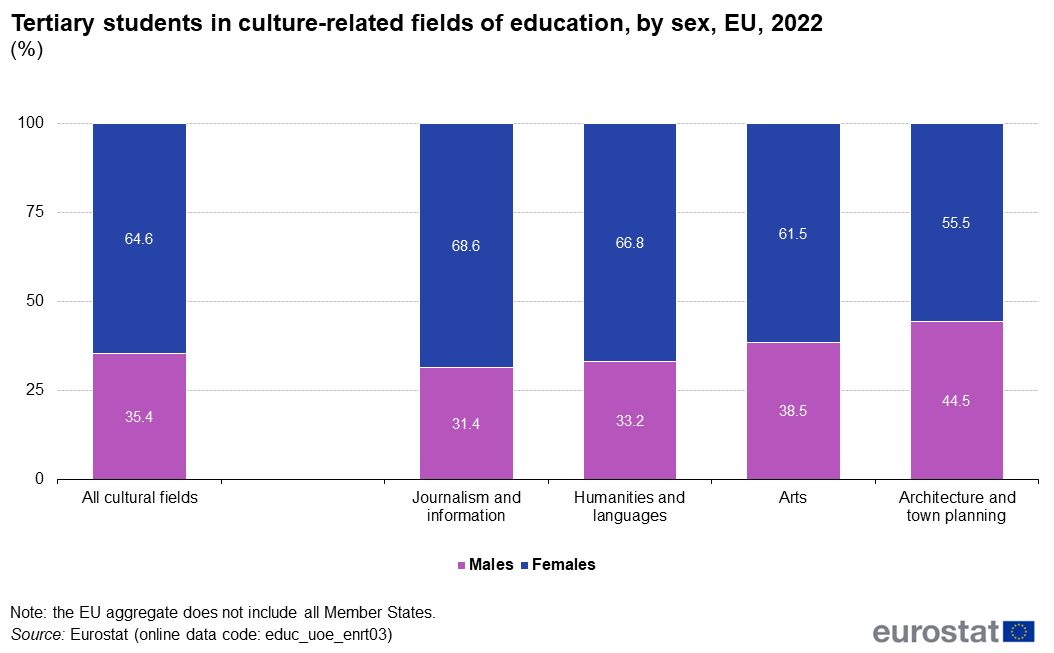
Figure 3 - Tertiary students in culture-related fields of education, by sex, EU 2022.png
(
file
)
35 KB
null
1
16:55, 20 June 2024
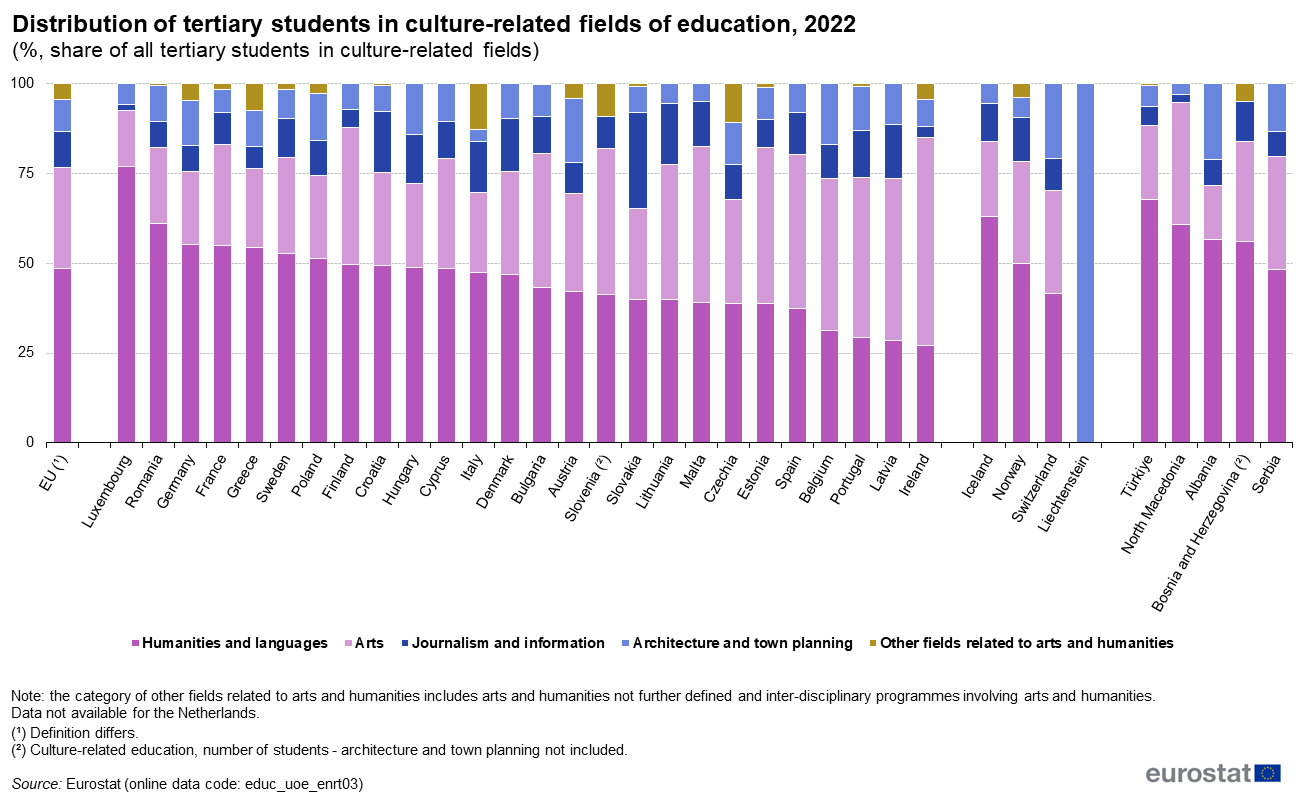
Figure 2 - Distribution of tertiary students in culture-related fields of education 2022.png
(
file
)
105 KB
null
1
16:55, 20 June 2024
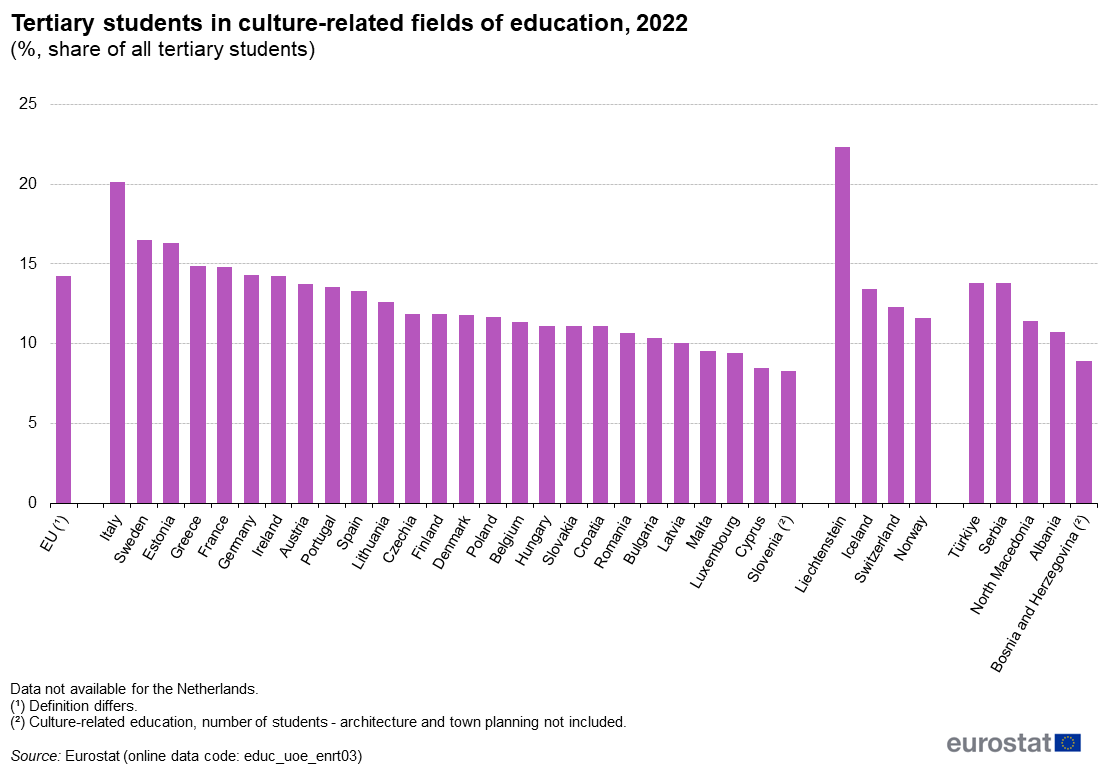
Figure 1 - Tertiary students in culture-related fields of education 2022.png
(
file
)
73 KB
null
1
18:04, 4 April 2024
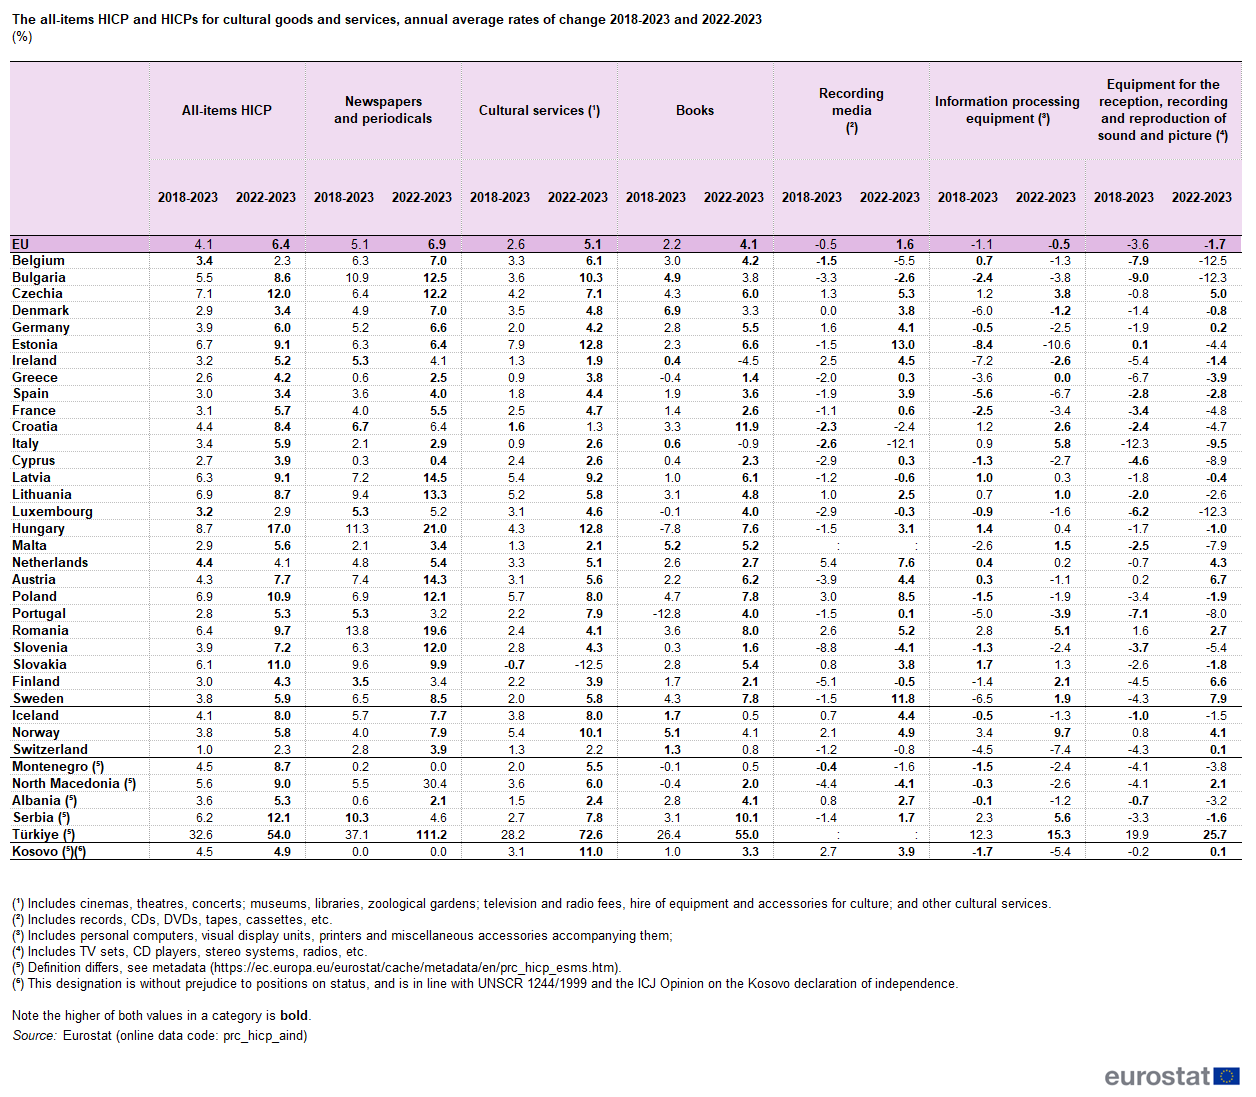
Table 1 - The all-items HICP and HICPs for cultural goods and services, annual average rates of change 2018-2023 and 2022-2023 (%).png
(
file
)
108 KB
null
1
18:04, 4 April 2024
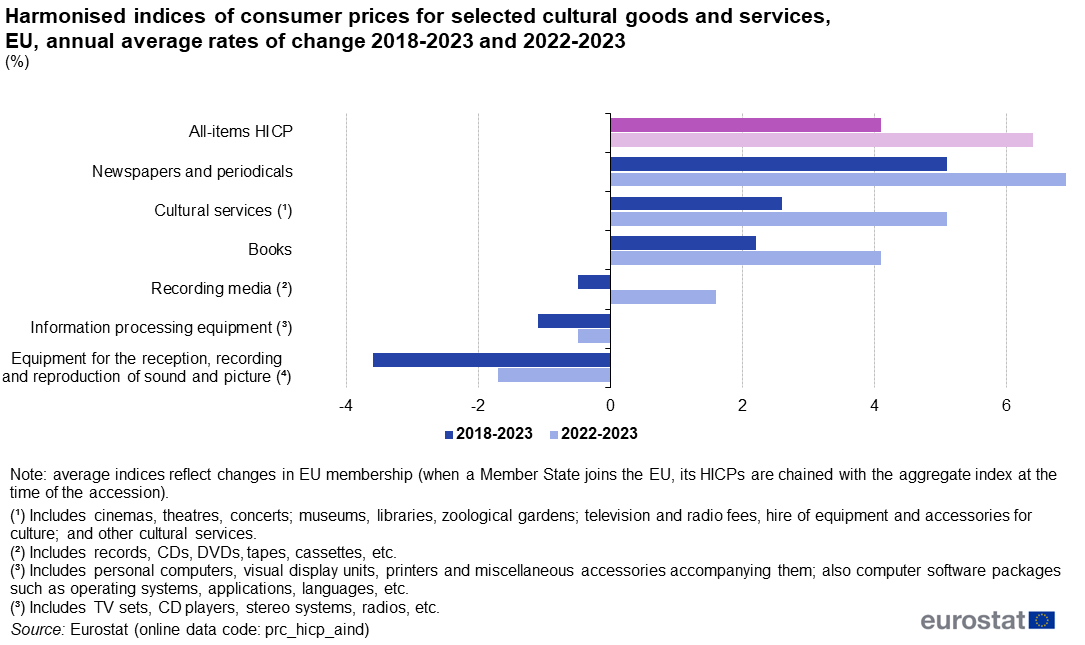
Figure 2 - Harmonised indices of consumer prices for selected cultural goods and services, EU, AAGR 2018-2023 and 2022-2023 (%).png
(
file
)
48 KB
null
1
18:04, 4 April 2024
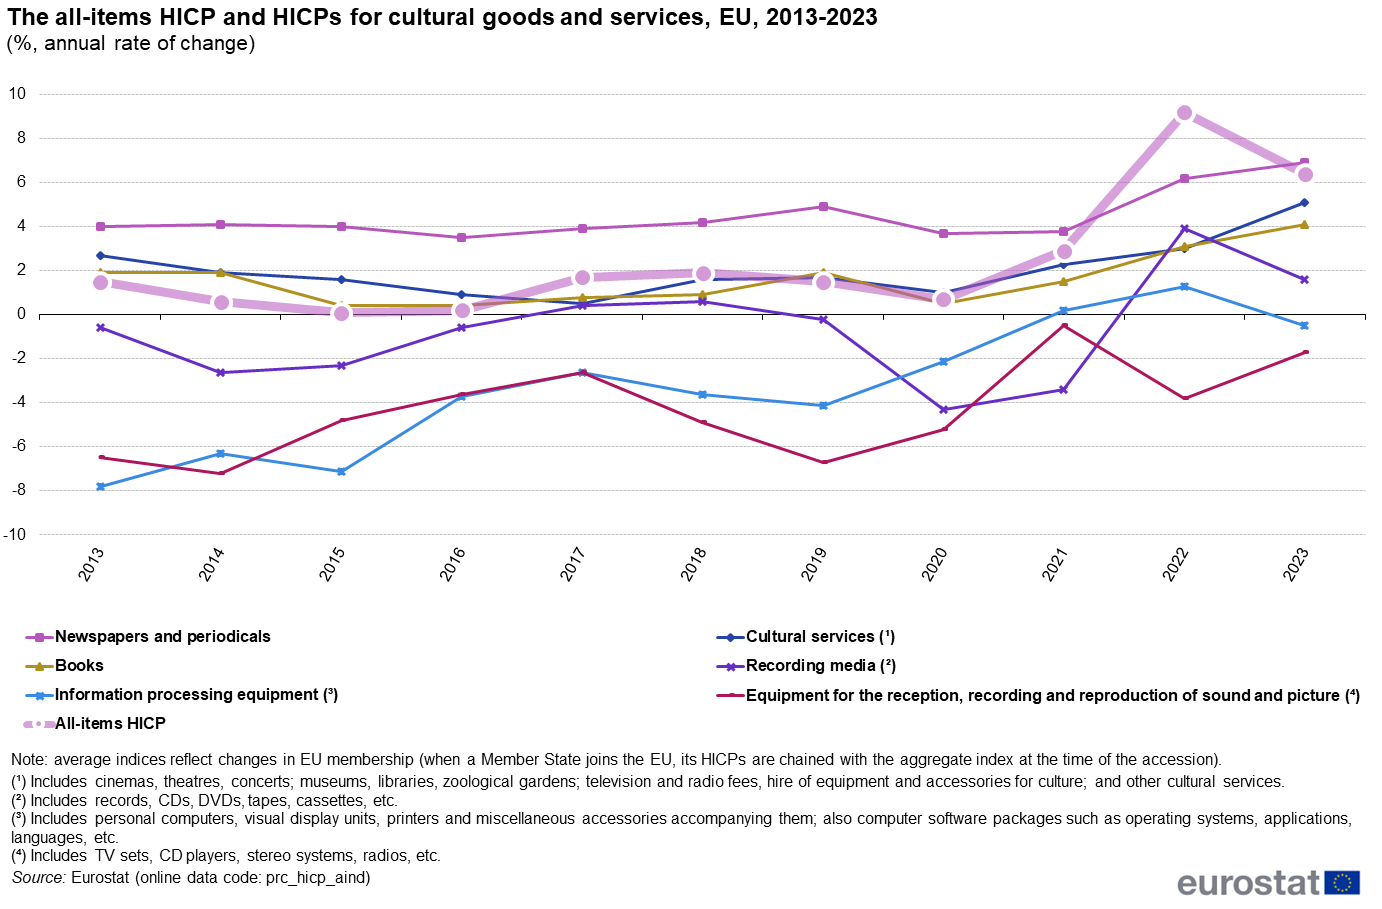
Figure 1 - The all-items HICP and HICPs for cultural goods and services, EU, 2013-2023 (%, annual rate of change).png
(
file
)
93 KB
null
1
18:04, 4 April 2024
HICP - Price development for cultural goods and services - tables and figures 2024.xlsx
(
file
)
49 KB
null
1
13:39, 26 February 2024
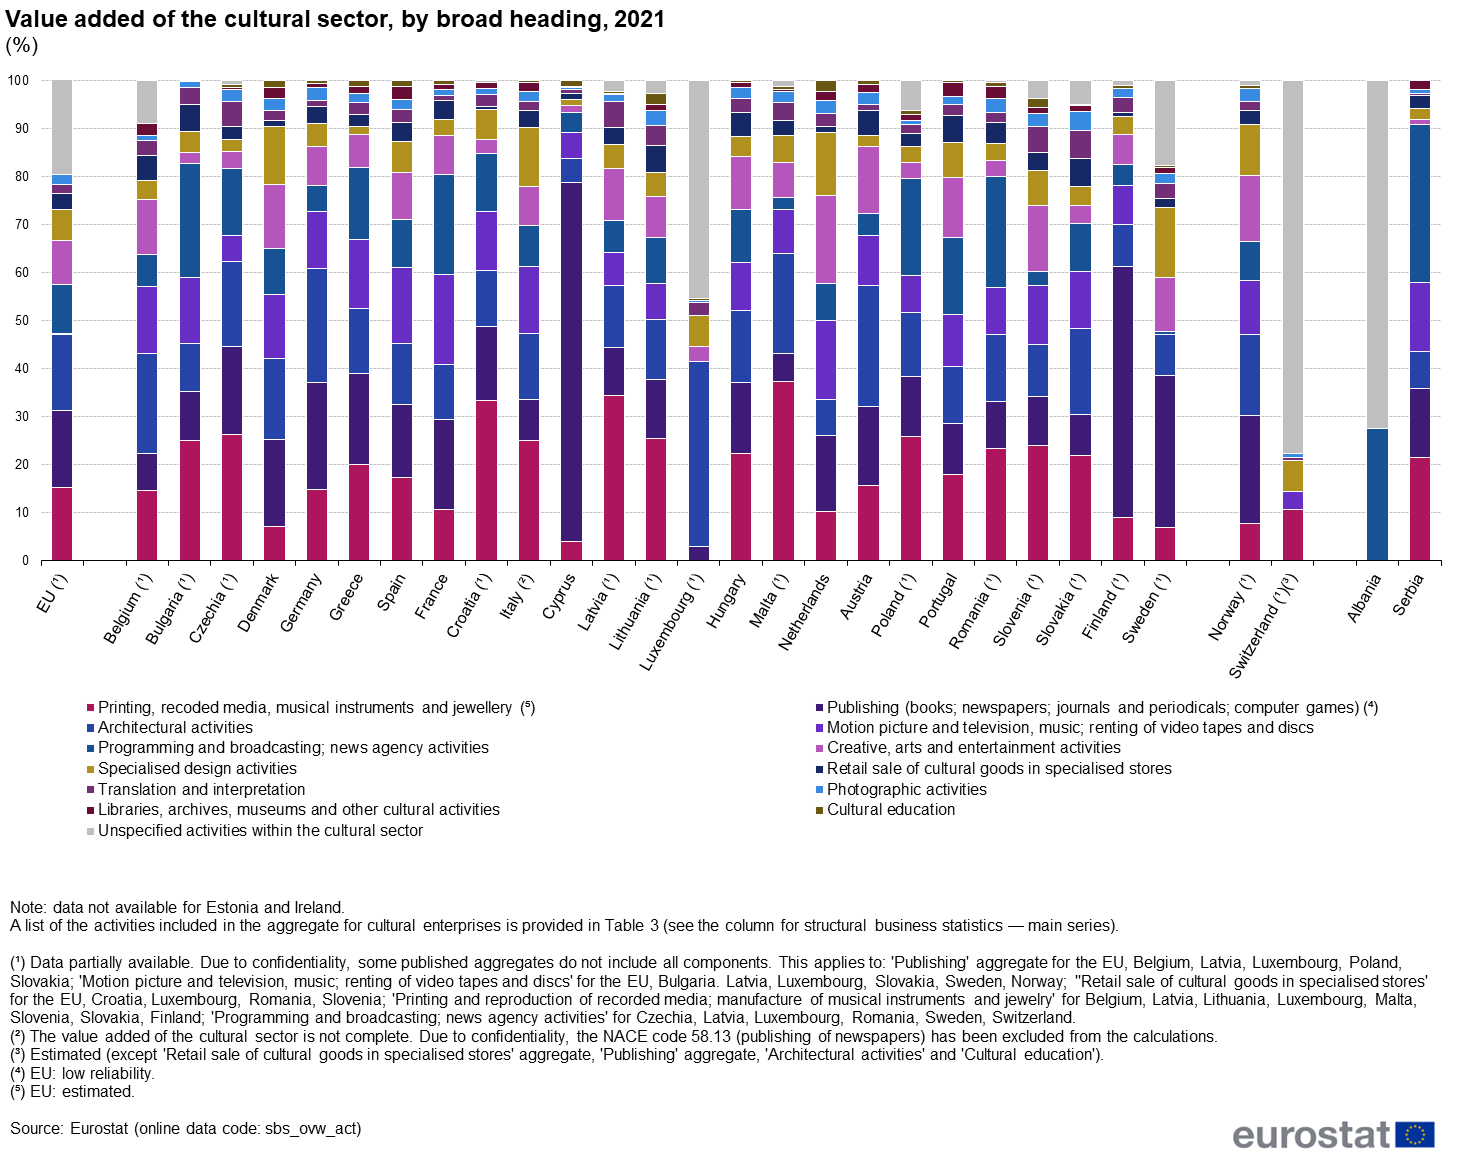
Figure 5 - Value added of the cultural sector, by broad heading, 2021.png
(
file
)
156 KB
null
1
13:39, 26 February 2024
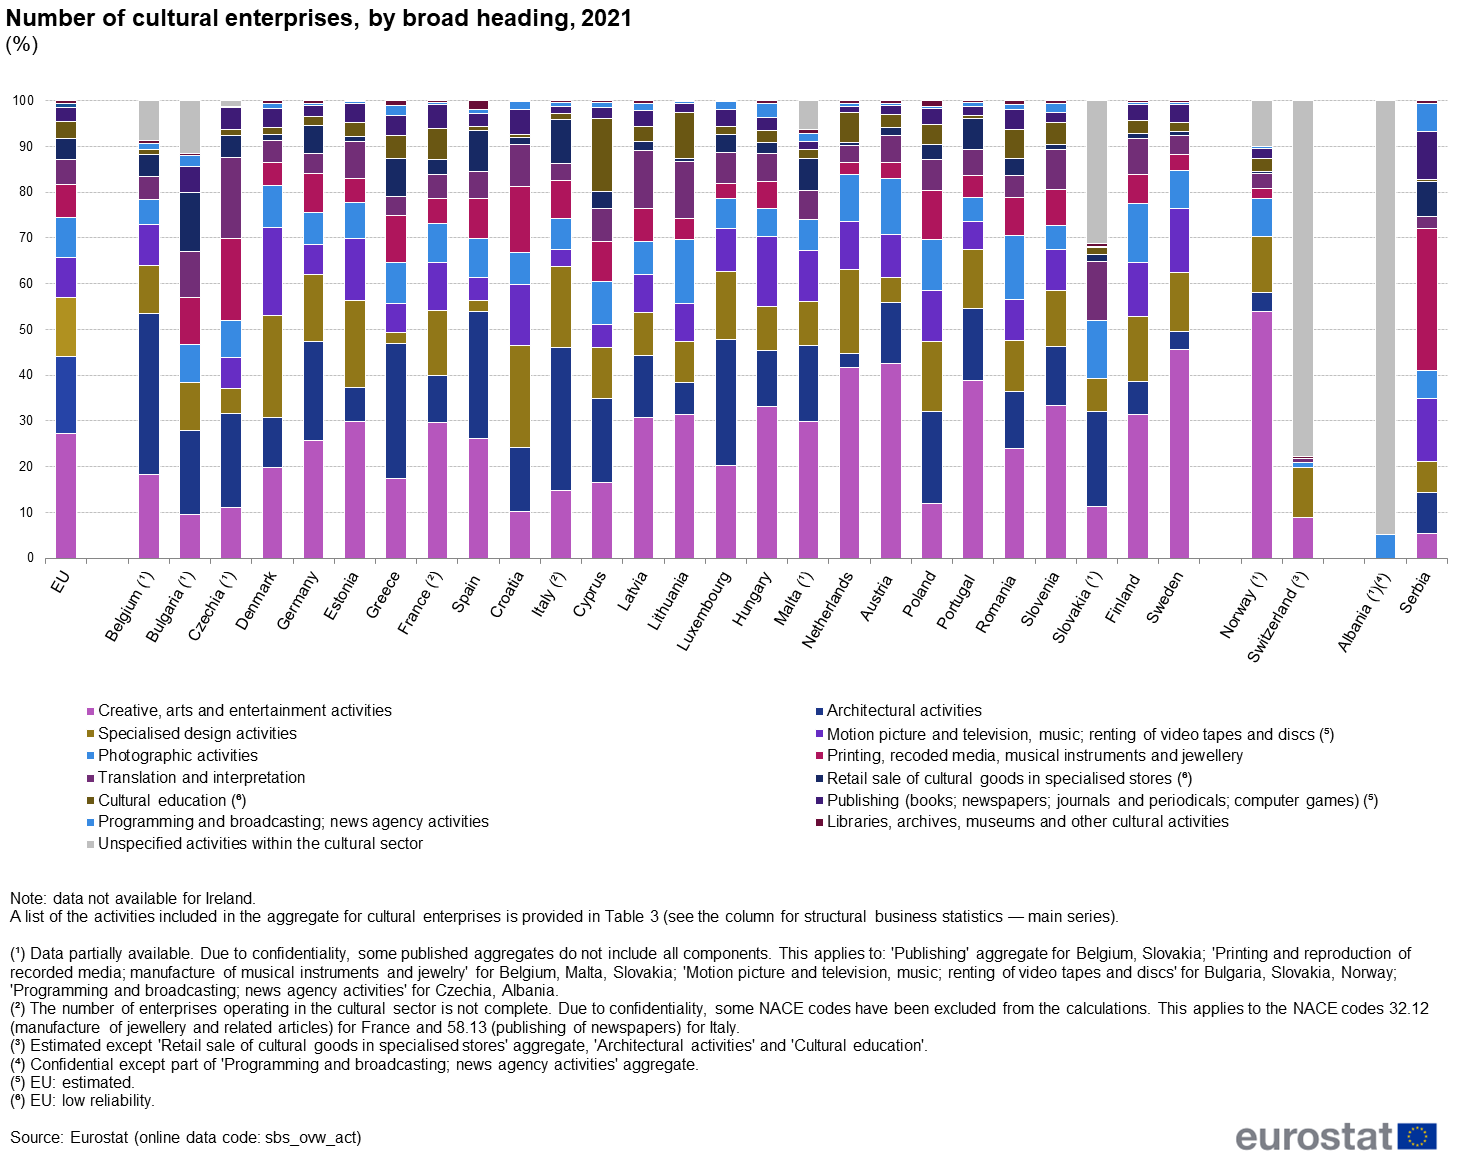
Figure 4 - Number of cultural enterprises, by broad heading, 2021.png
(
file
)
157 KB
null
1
13:39, 26 February 2024
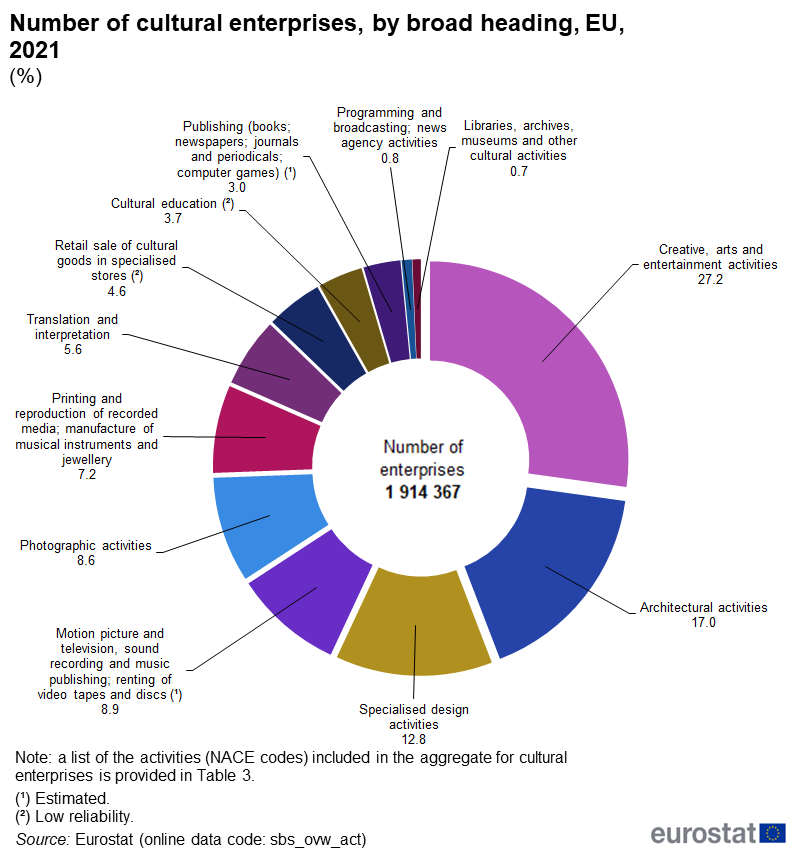
Figure 2 - Number of cultural enterprises, by broad heading, EU, 2021.png
(
file
)
72 KB
null
1
13:38, 26 February 2024
Cultural enterprises CP2024.xlsx
(
file
)
287 KB
null
1
13:37, 26 February 2024
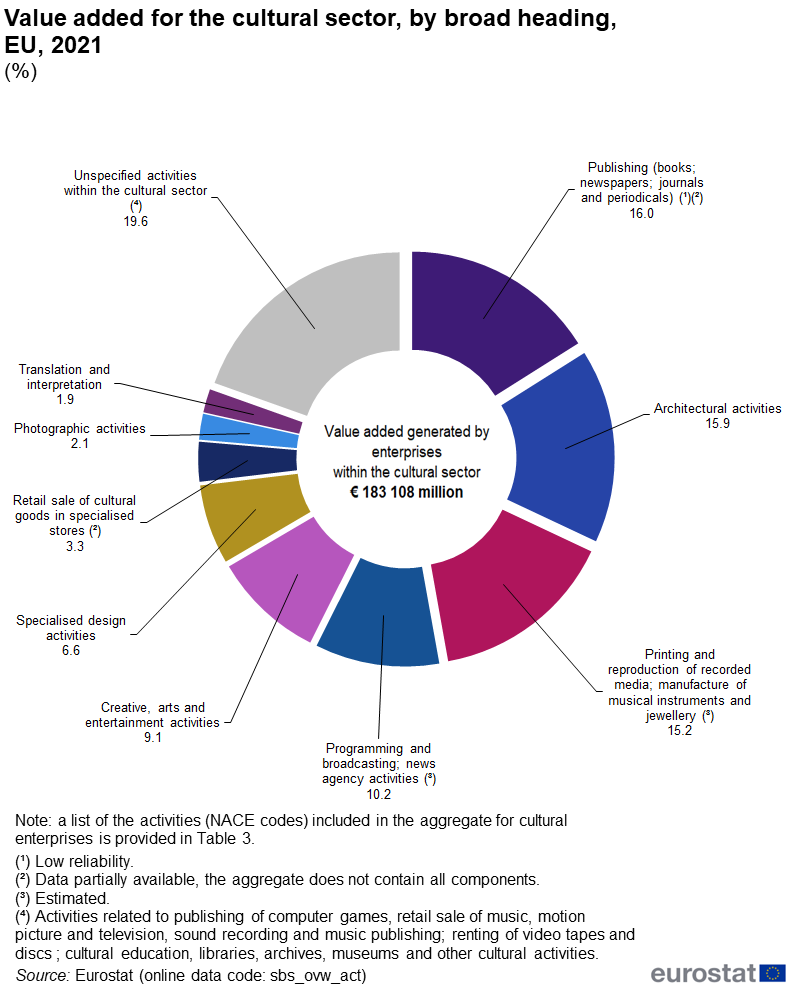
Figure 3 - Value added for the cultural sector, by broad heading, EU, 2021.png
(
file
)
81 KB
null
1
13:37, 26 February 2024
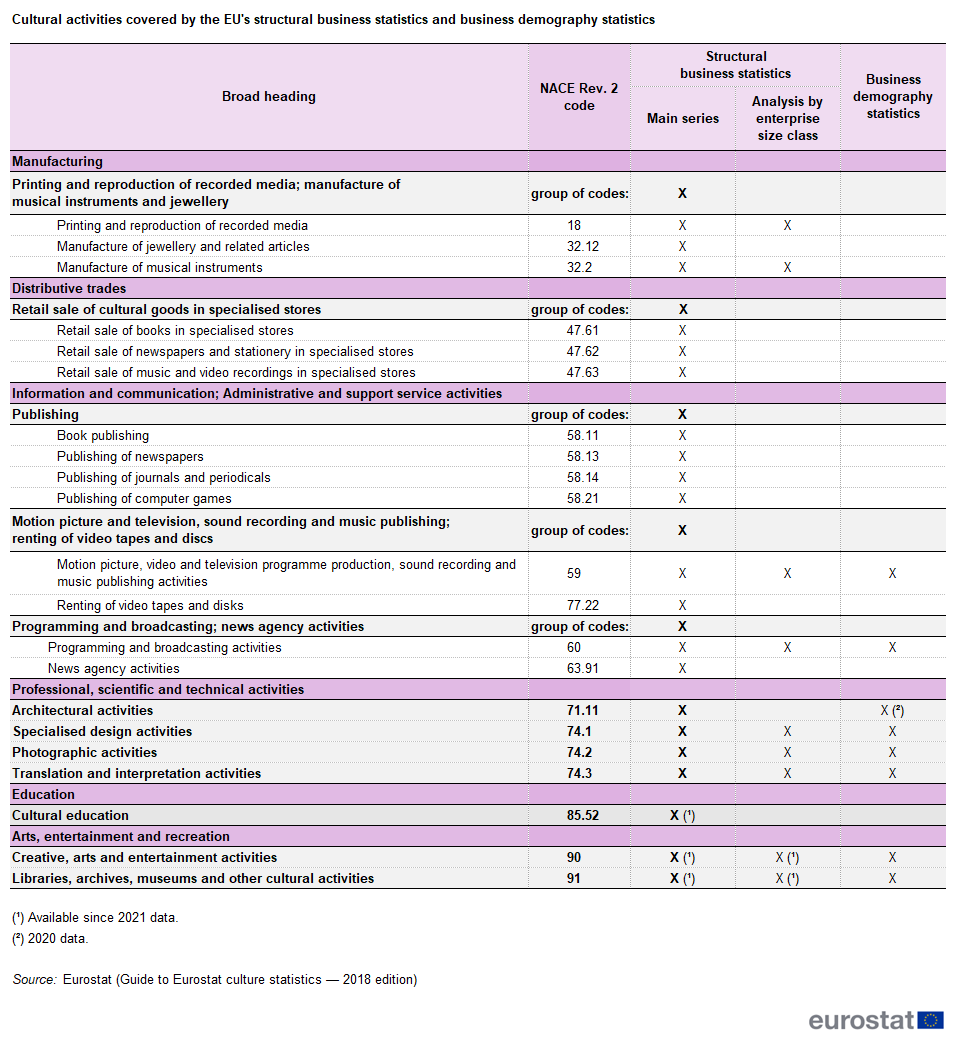
Table 3 - Cultural activities covered by the EU's structural business statistics and business demography statistics.png
(
file
)
74 KB
null
1
13:37, 26 February 2024
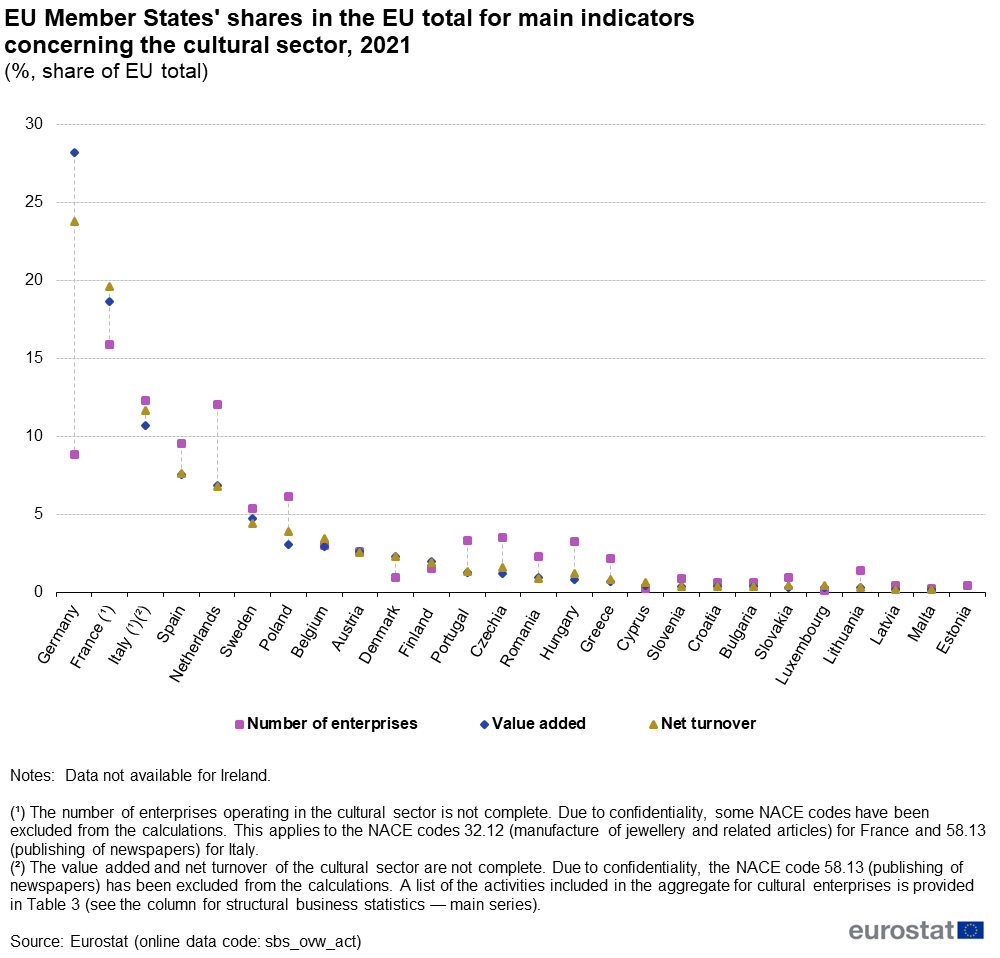
Figure 1 - EU Member States' shares in the EU total for main indicators concerning the cultural sector, 2021.png
(
file
)
66 KB
null
1
13:37, 26 February 2024
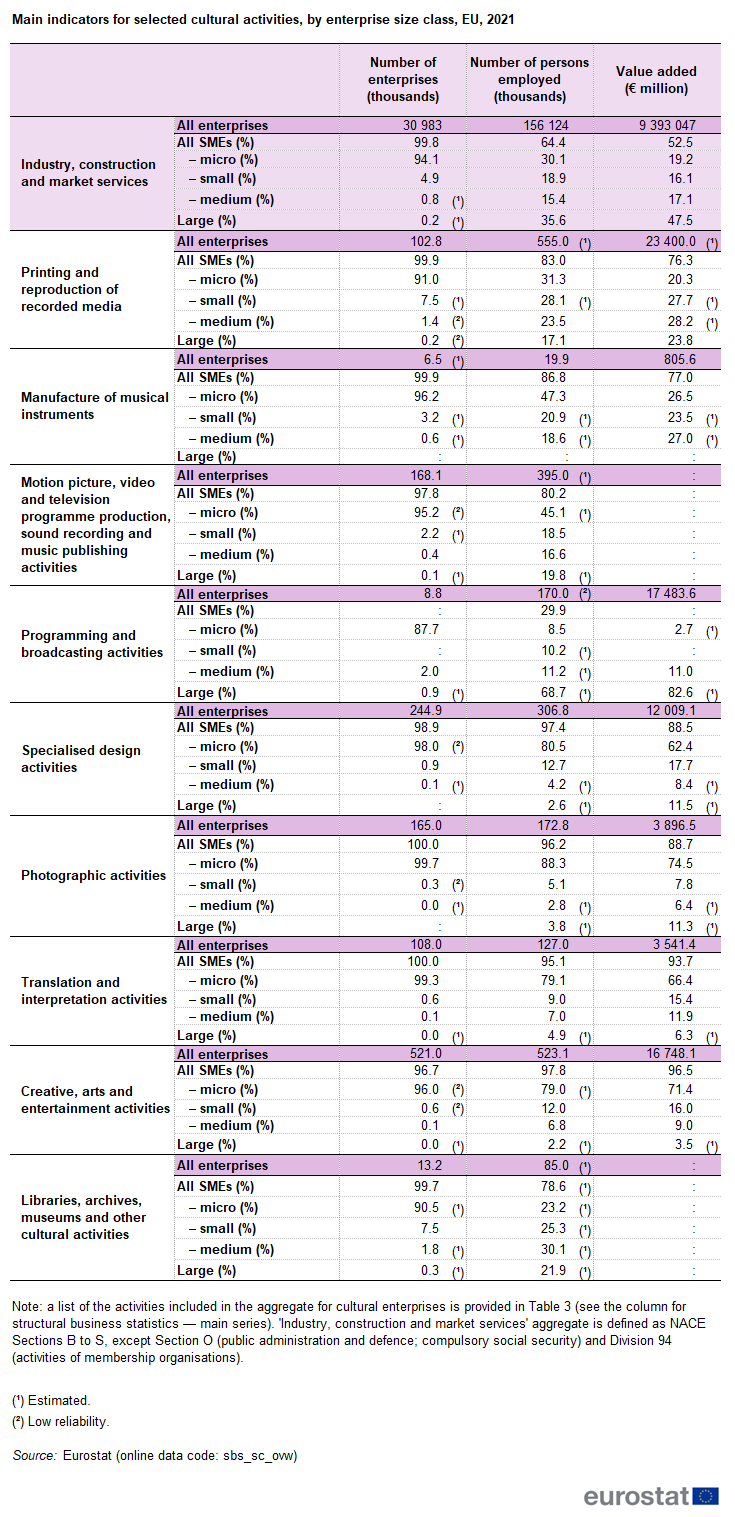
Table 2 - Main indicators for selected cultural activities, by enterprise size class, EU, 2021.png
(
file
)
107 KB
null
1
13:37, 26 February 2024
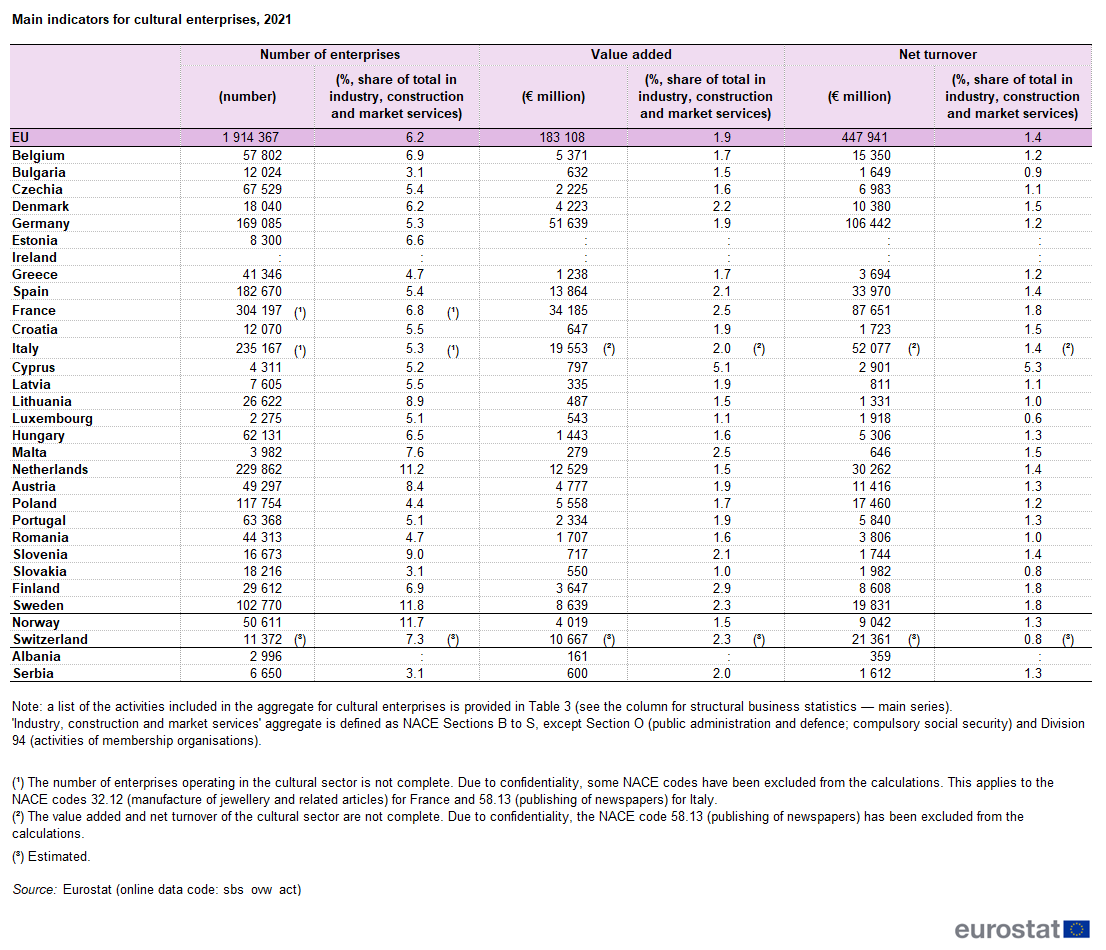
Table 1 - Main indicators for cultural enterprises, 2021.png
(
file
)
80 KB
null
1
13:37, 26 February 2024
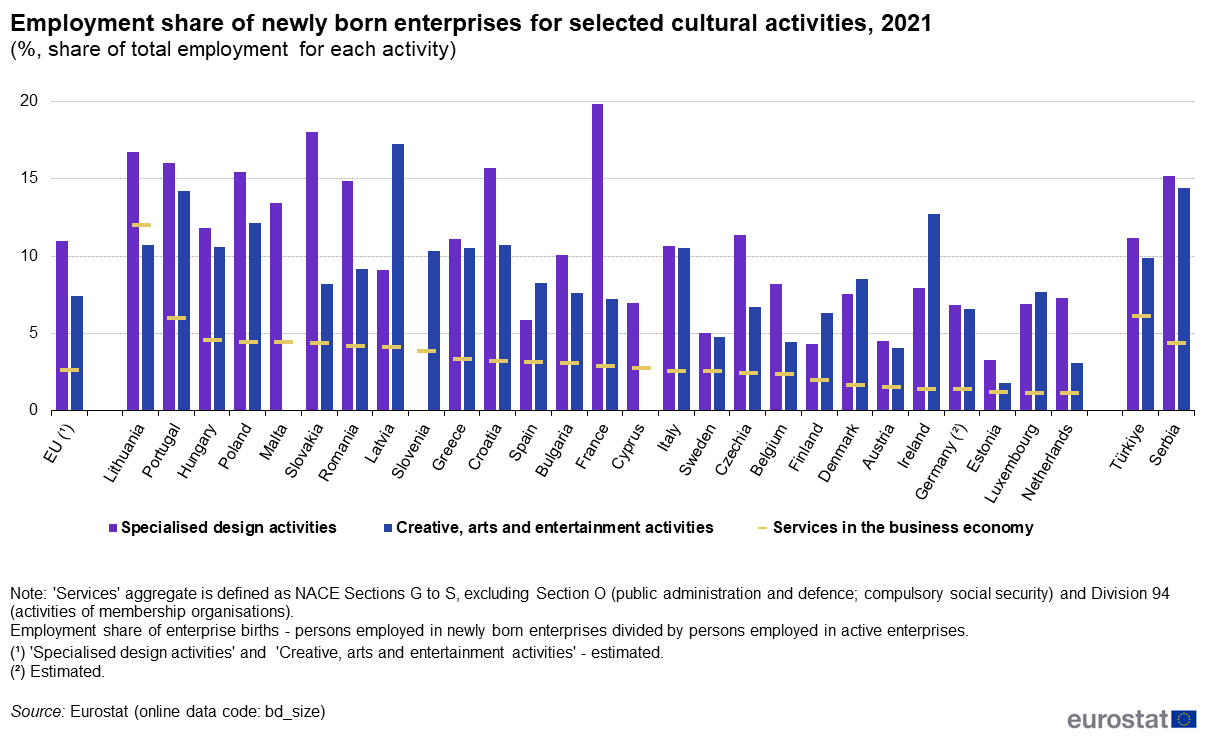
Figure 7 - Employment share of newly born enterprises for selected cultural activities, 2021.png
(
file
)
85 KB
null
1
13:37, 26 February 2024
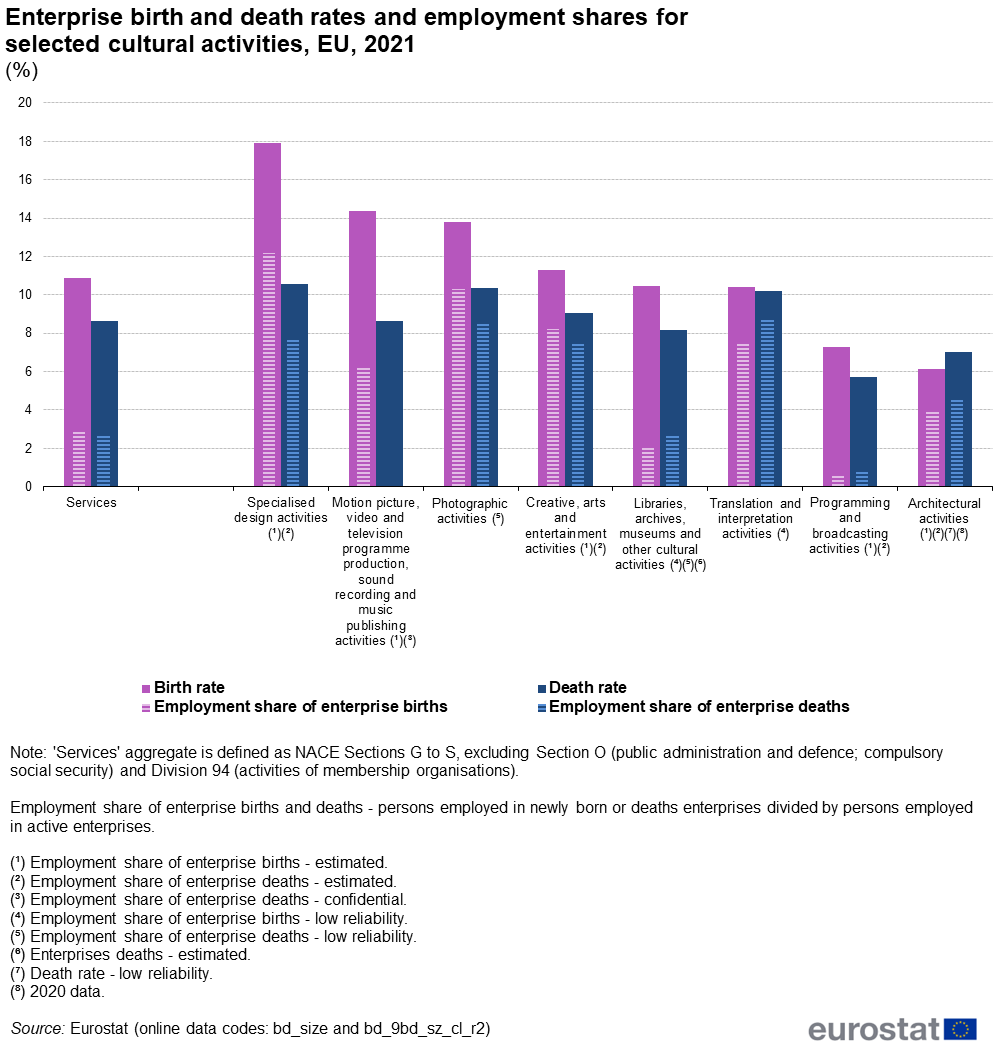
Figure 6 - Enterprise birth and death rates and employment shares for selected cultural activities, EU, 2021.png
(
file
)
75 KB
null
1
21:20, 1 December 2023
Household expenditure on culture CP2023.xlsx
(
file
)
666 KB
null
1
21:19, 1 December 2023
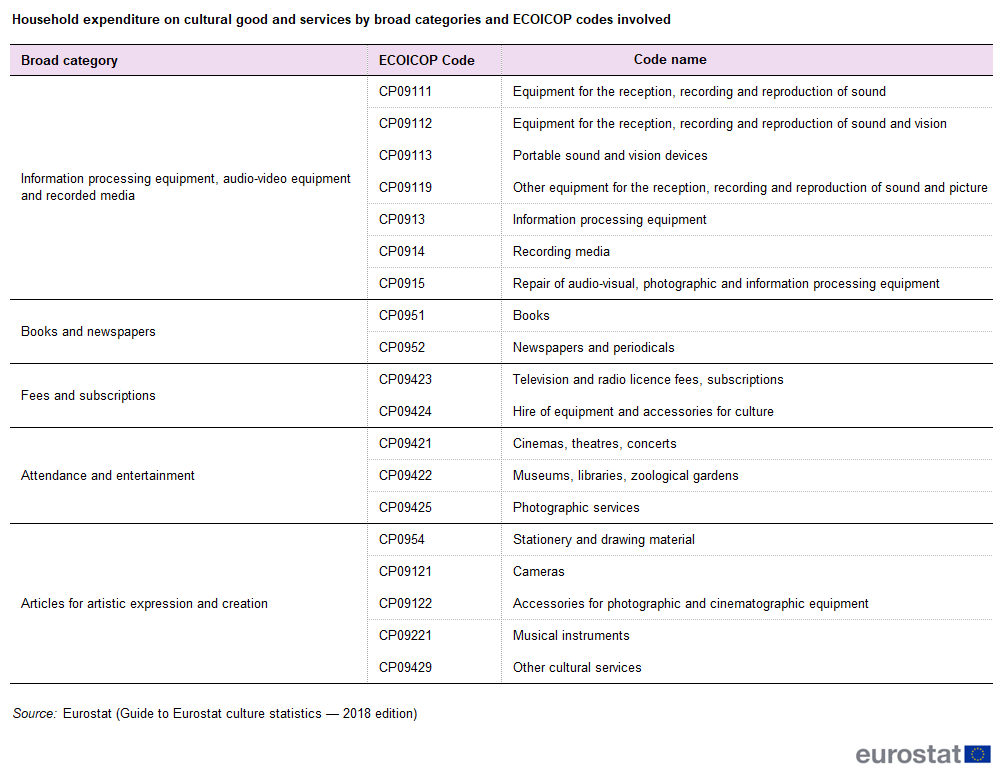
Table 2 - Household expenditure on cultural good and services by broad categories and ECOICOP codes involved.png
(
file
)
45 KB
null
1
21:19, 1 December 2023
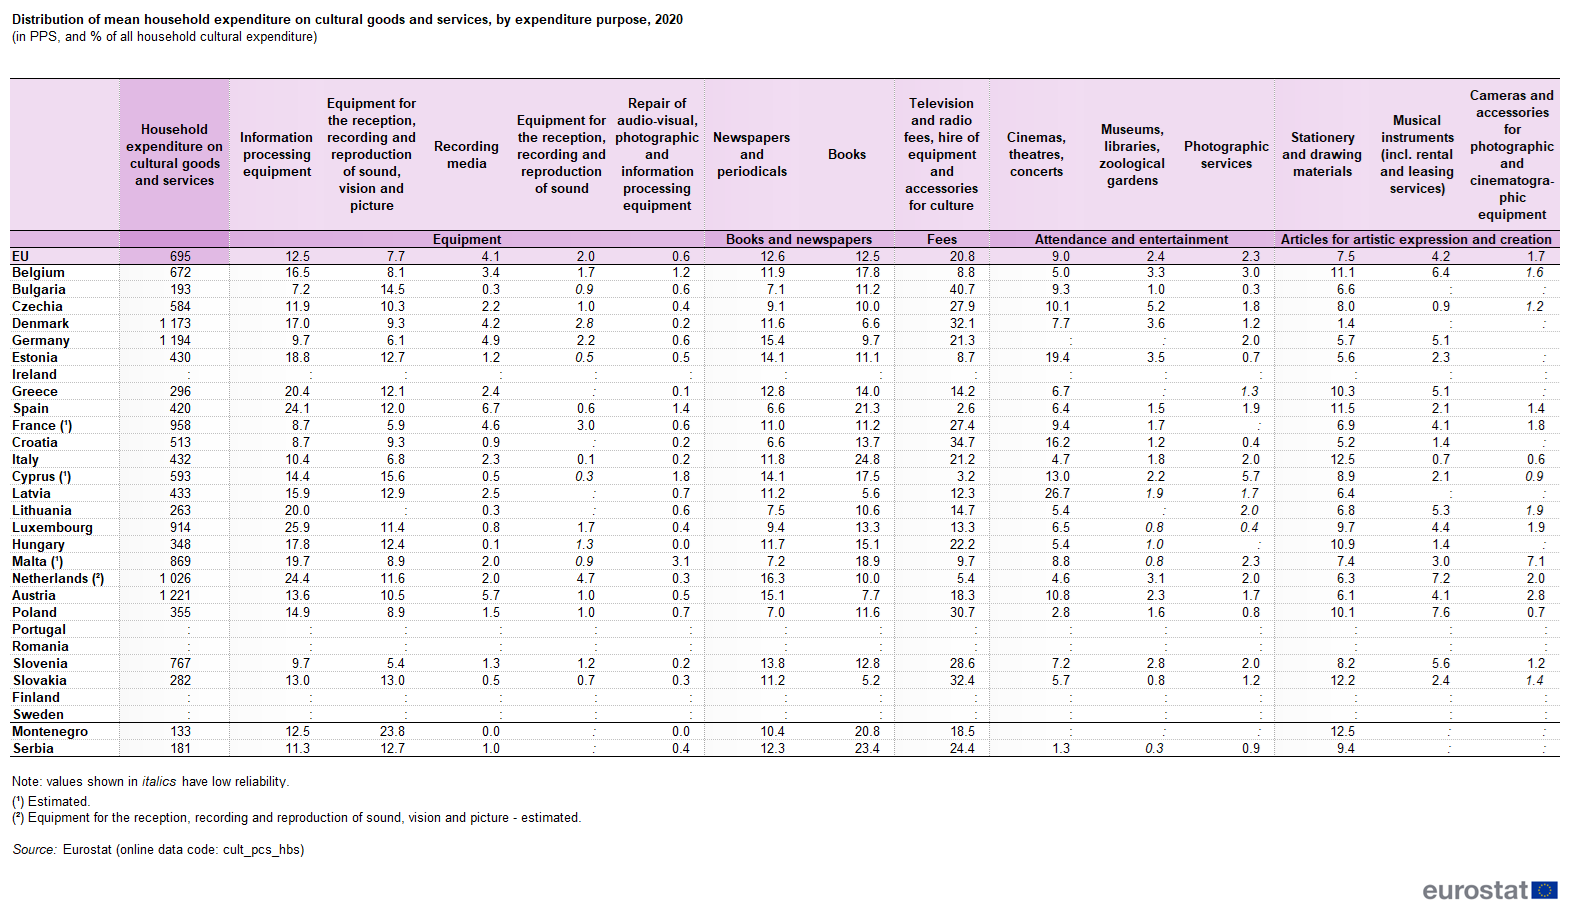
Table 1 - Distribution of mean household expenditure on cultural goods and services, by expenditure purpose, 2020.png
(
file
)
215 KB
null
1
21:19, 1 December 2023
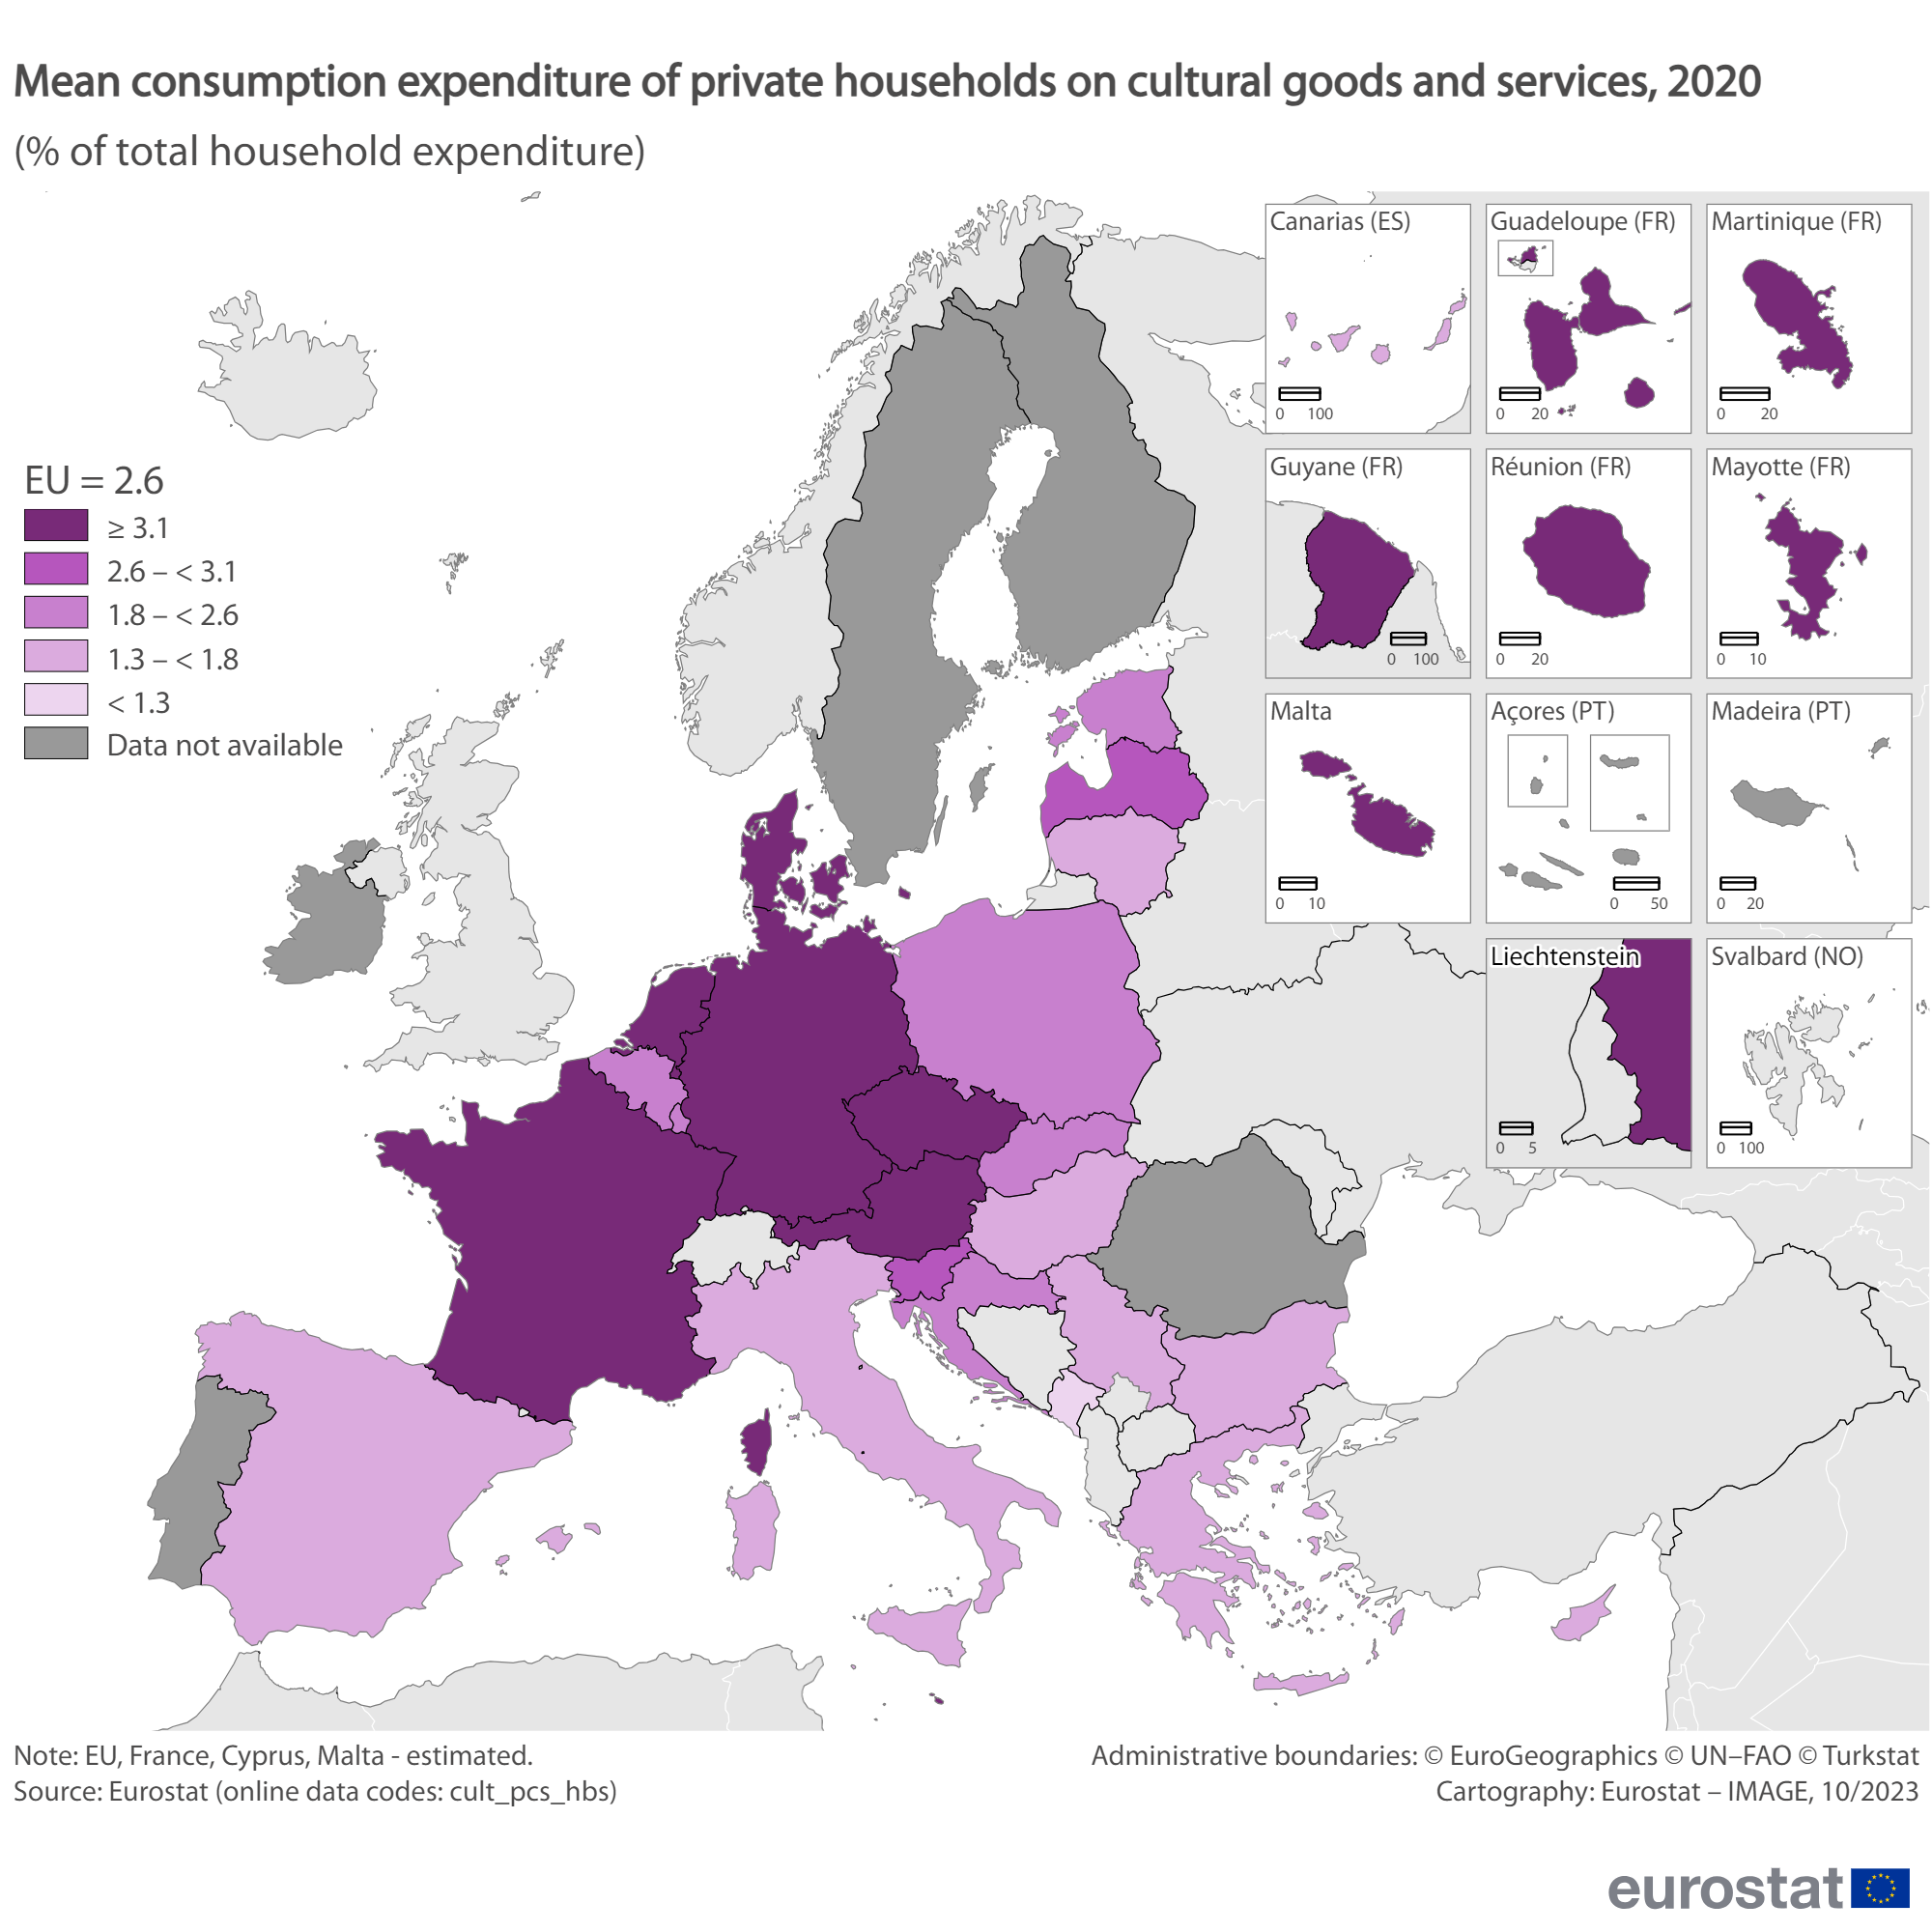
Map 1 - Mean consumption expenditure of private households on cultural goods and services 2020.png
(
file
)
699 KB
null
1
21:19, 1 December 2023
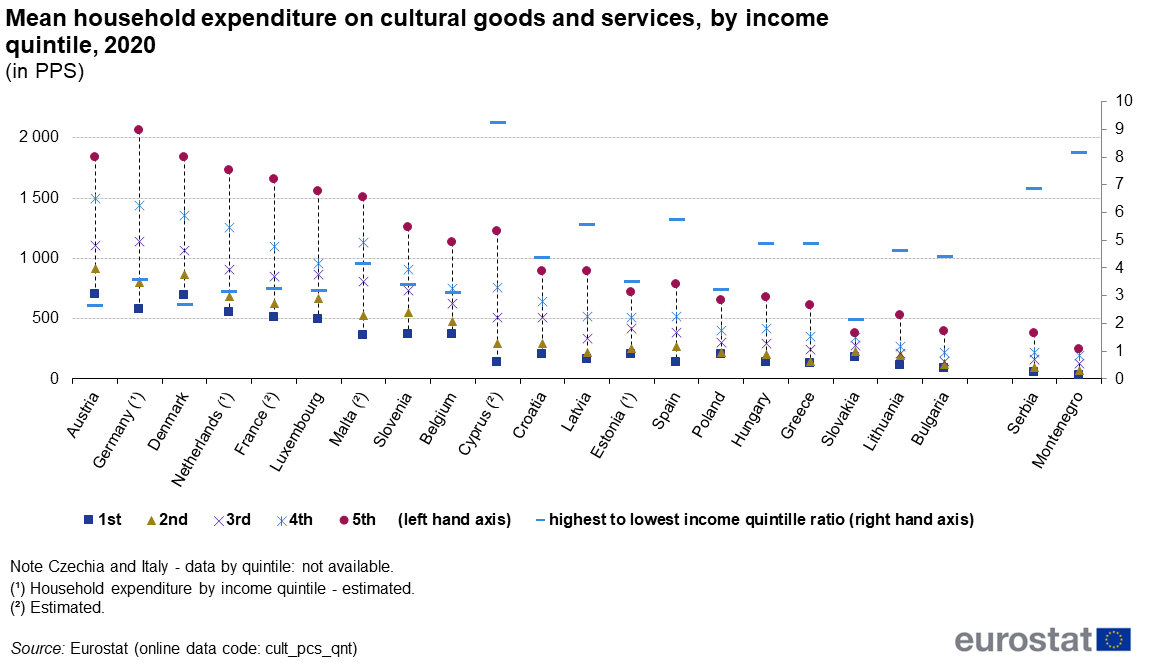
Figure 5 - Mean household expenditure on cultural goods and services, by income quintile, 2020 (in PPS).png
(
file
)
59 KB
null
1
21:19, 1 December 2023
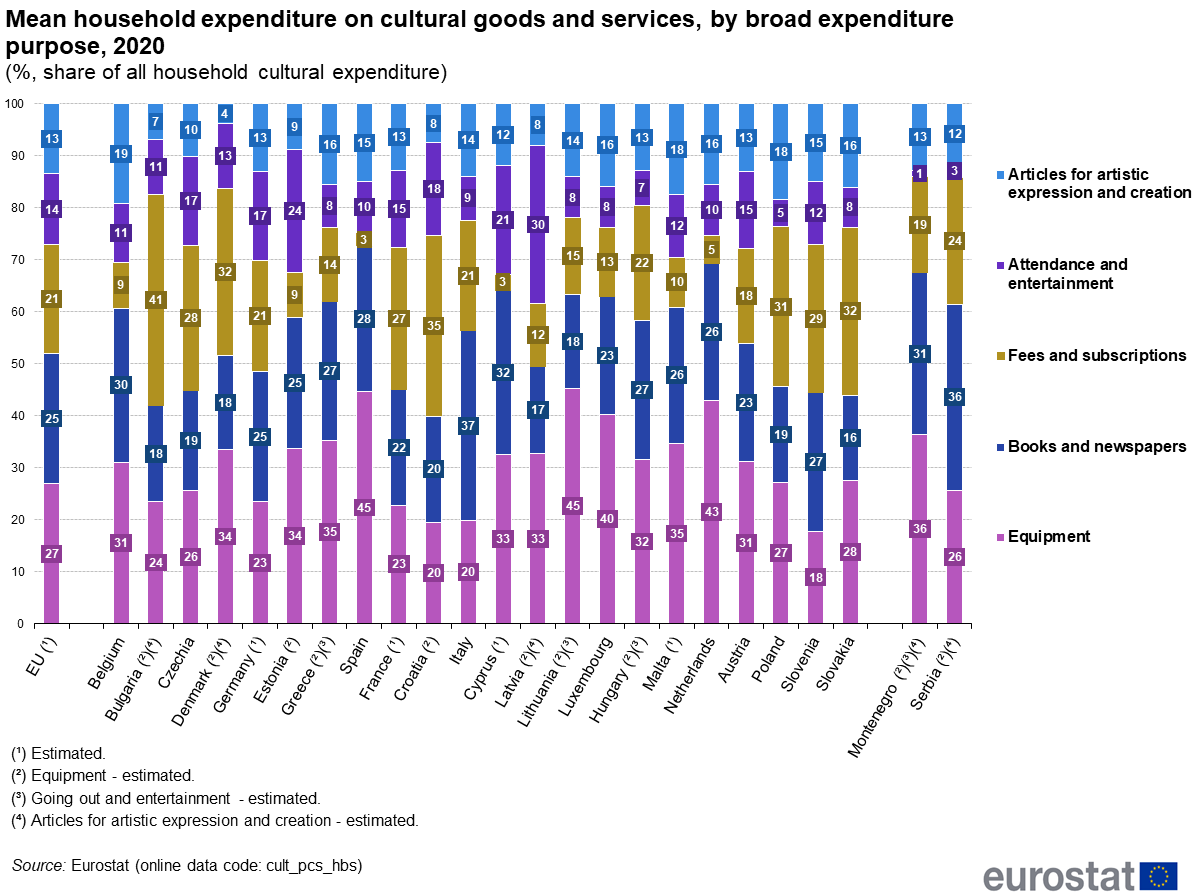
Figure 4 - Mean household expenditure on cultural goods and services, by broad expenditure purpose, 2020 (%, share of all household cultural expend.png
(
file
)
122 KB
null
1
21:19, 1 December 2023
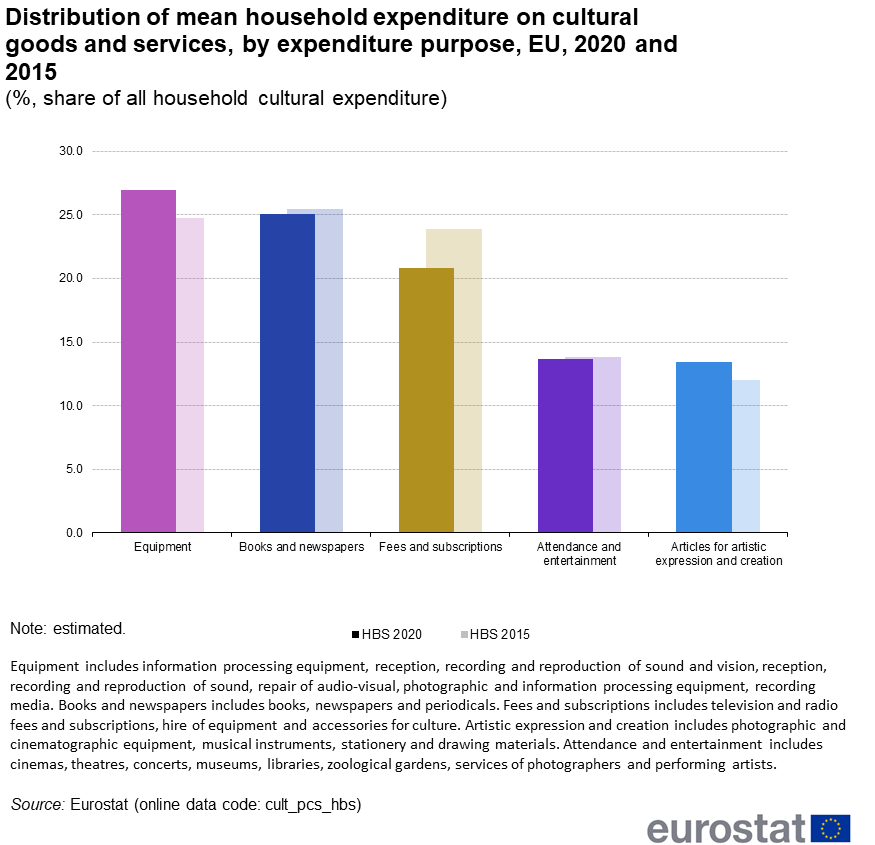
Figure 3 - Distribution of mean household expenditure on cultural goods and services, by expenditure purpose, EU, 2020 and 2015.png
(
file
)
55 KB
null
1
21:19, 1 December 2023
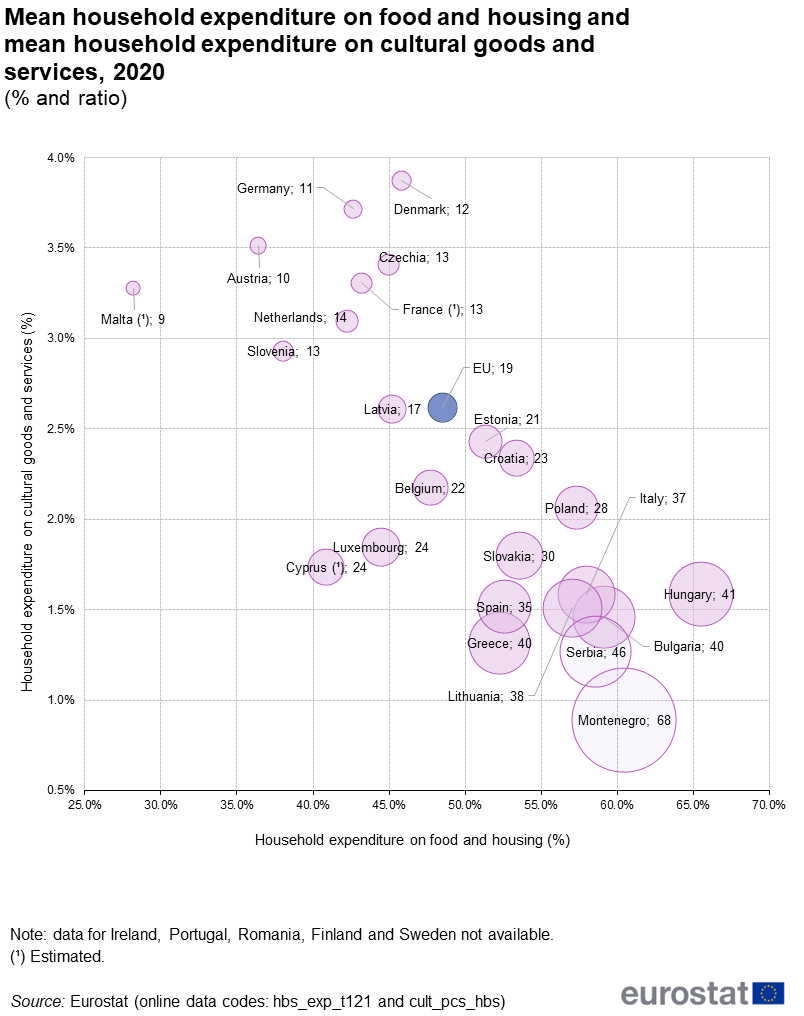
Figure 2 - Mean household expenditure on food and housing and mean household expenditure on cultural goods and services, 2020.png
(
file
)
83 KB
null
1
21:19, 1 December 2023
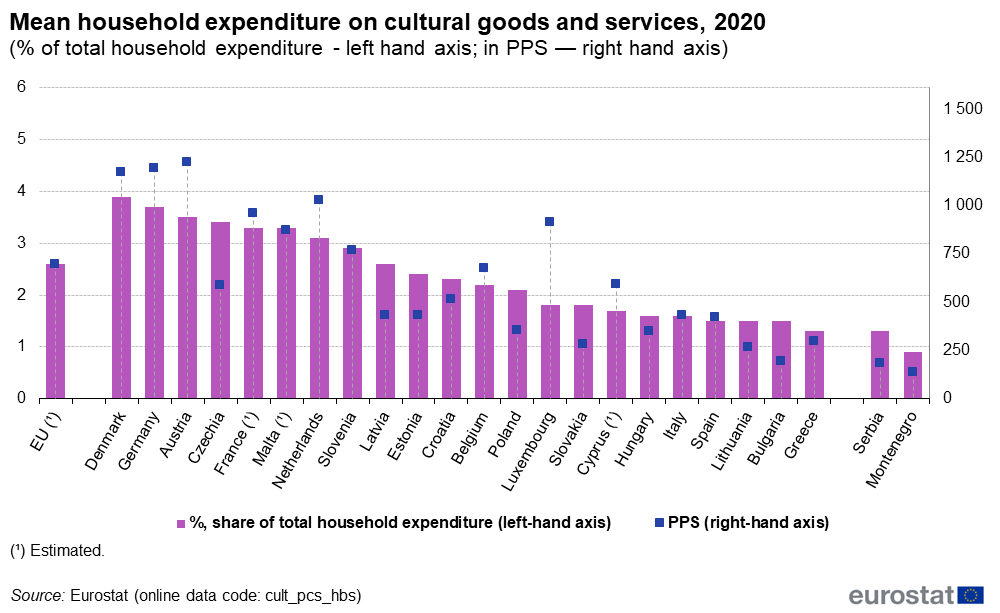
Figure 1 - Mean household expenditure on cultural goods and services, 2020) .png
(
file
)
52 KB
null
1
15:33, 24 November 2023
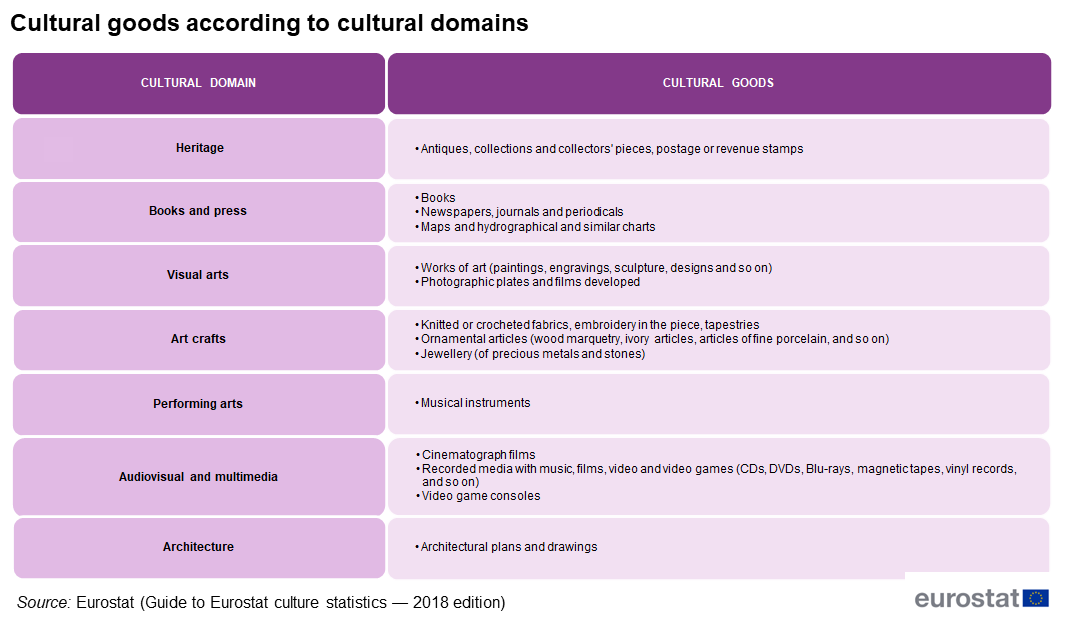
Figure 10 - Cultural goods according to cultural domains (2023).png
(
file
)
41 KB
null
1
12:29, 24 November 2023
Culture statistics - International trade in cultural goods 2023.xlsx
(
file
)
2.89 MB
null
1
12:28, 24 November 2023
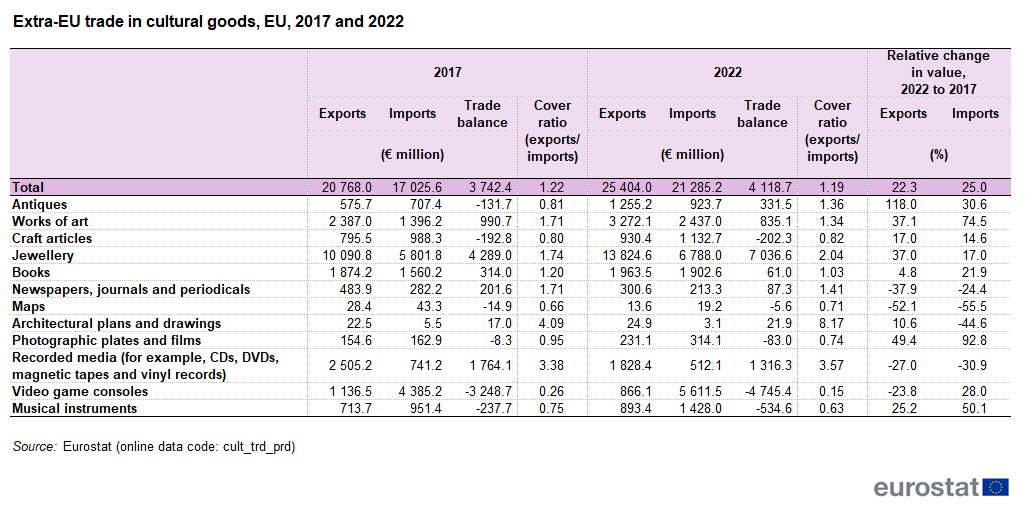
Table 1 - Extra-EU trade in cultural goods, EU, 2017 and 2022.png
(
file
)
46 KB
null
1
12:28, 24 November 2023
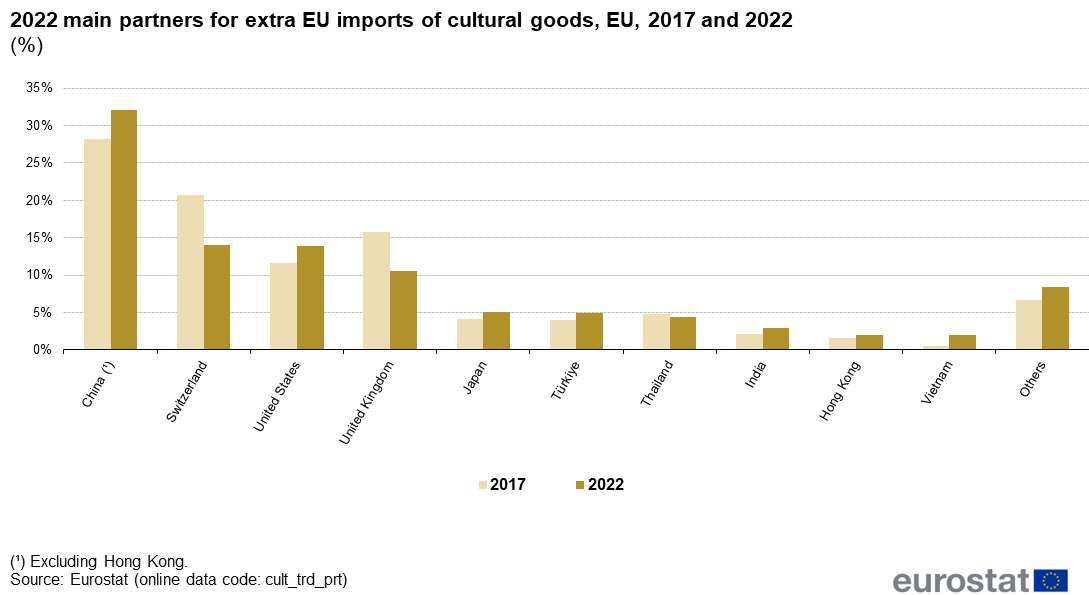
Figure 7 - 2022 main partners for extra EU imports of cultural goods, EU, 2017 and 2022 (%).png
(
file
)
34 KB
null
1
12:28, 24 November 2023
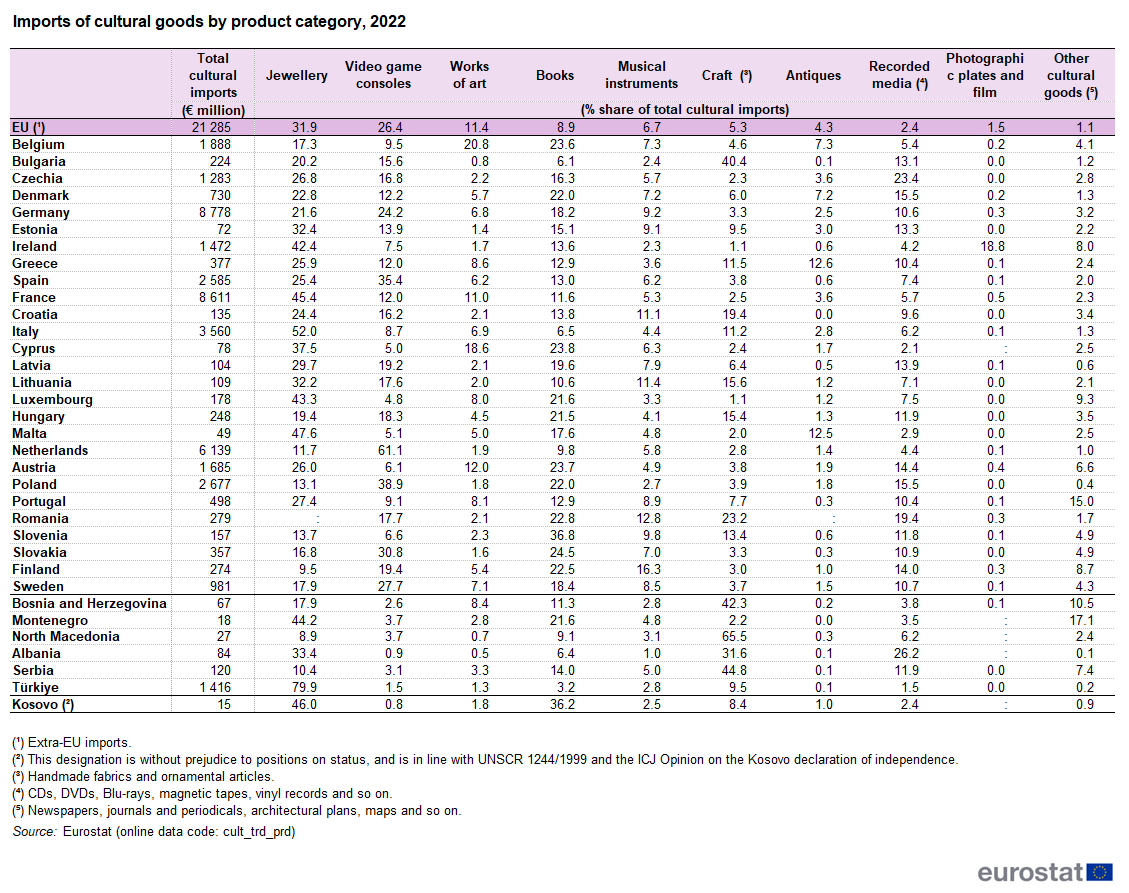
Table 4 - Imports of cultural goods by product category, 2022.png
(
file
)
132 KB
null
1
First page
Previous page
Next page
Last page
Special page
ISSN 2443-8219

.png)

.png)

.png)
.png)
.png)
.png)


.png)


.png)
.png)
.png)


.png)


_.png)
.png)

.png)
