Performance of the agricultural sector
Data extracted in May 2024.
Planned article update: November 2024.
Highlights
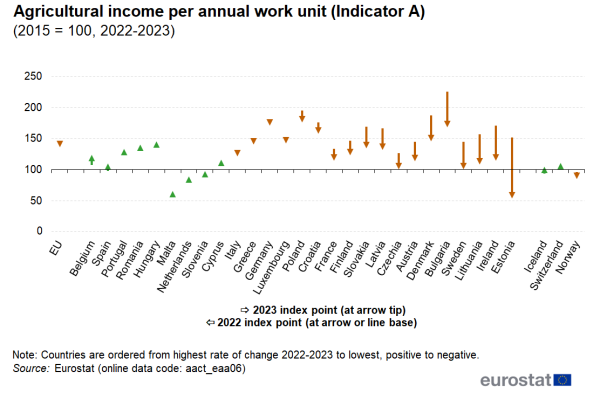
(2015 = 100, 2022-2023)
Source: Eurostat (aact_eaa06)
This article gives an overview of the economic and resource performance of agriculture in the European Union (EU). It uses indicators on agricultural output, agricultural income and agricultural prices in the EU for economic performance and indicators on agricultural output and intermediate consumption for resource performance. The data are extracted from Eurostat collections of agricultural statistics: economic accounts for agriculture (EAA), agricultural price indices (API) and agri-environmental indicators (AEIs).
Full article
Value of agricultural output
Agriculture is an activity that falls within the primary sector of the economy, which is concerned with the extraction or harvesting of products from the earth. In an accounting context, an industry is a branch of economic activity. The term 'agricultural industry' is used to describe the branch of agricultural production, but it should not be understood as inferring that agriculture is industrialised or that it is about the processing of raw materials.
In this article, the term 'agricultural industry' is used only where precise accounting terms are required, with 'agricultural sector' being used elsewhere.
Agriculture contributed 1.3 % to the EU's GDP in 2023, the same share as 15 years earlier.
Agricultural production in the EU by the millions of predominantly small farms adds up to being big business, even without considering its importance as the key building block for the downstream food and beverage processing industry. The agricultural sector contributed an estimated €219.5 billion towards the EU's overall GDP in 2023. To put this in some context, the contribution of agriculture to the EU's economy was almost identical to the GDP of Greece in 2023, the 16th largest economy among the EU countries.
This contribution (gross value added at producer prices, which is comparable to GDP at market prices), is the difference between the value of agricultural output and the value of various input costs built up in the production process, adjusted for taxes and subsidies on products. It is therefore interesting to look at the structure and composition of the value of agricultural production and the various inputs used.
The agricultural industry created added value of €225.6 billion in 2023
The gross value added by the EU's agricultural industry, which is the difference between the value of everything that the EU's primary agricultural sector produced and the costs of the services and goods used in the production process, was an estimated €225.6 billion in 2023. One way of looking at this is that for every €1 spent on the cost of goods and services used in the production process (known as intermediate consumption), the EU's agricultural industry created added value of €0.72. This relative value added in 2023 was lower than the relative peak of €0.79 in 2017 and all the other the years that followed, with the exception of 2022.
The value of the output produced by the EU's agricultural industry was €537.1 billion in 2023
The value of everything that the EU's agricultural industry produced in 2023 was an estimated €537.1 billion; this includes the value of crops, of animals, of agricultural services, as well as some goods and services that were not strictly agricultural, but which could not be separately measured.
A little more than one-half (51.3 %) of the value of the total output of the EU's agricultural industry in 2023 came from crops (an estimated €275.8 billion), within which vegetables and horticultural plants, and cereals were the most valuable crops (see Figure 1). Almost two-fifths (39.8 %) of total output came from animals and animal products (an estimated €213.8 billion), a majority coming from just milk and pigs. Agricultural services (an estimated €24.8 billion) and inseparable non-agricultural activities (an estimated €22.8 billion) contributed the rest (8.9 %).
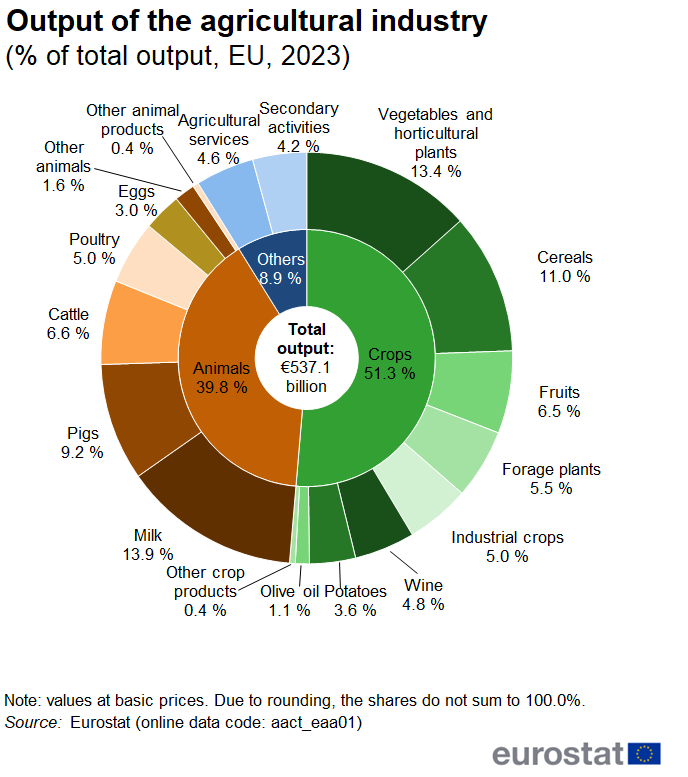
(% share of total output, EU, 2023)
Source: Eurostat (aact_eaa01)
Contributions from EU countries varied significantly, reflecting differences in volumes produced, prices received, as well as the mix of crops grown, animals reared, animal products collected and services offered. A clear majority (57.7 %) of the estimated total output value of the EU's agricultural industry came from the 'big four' of France (€96.0 billion), Germany (€76.6 billion), Italy (€71.9 billion) and Spain (€65.5 billion). The next grouping of EU countries was Poland (€39.5 billion), the Netherlands (€36.7 billion) and Romania (€25.6 billion). Three-quarters (76.6 %) of the total value of EU's agricultural output in 2023 came from these seven EU countries.
Intermediate consumption for the EU's agricultural industry was €311.5 billion in 2023
Producing all this output incurred costs. Farmers had to make purchases of goods and services to be used as inputs in the production process; they bought items like seeds, fertilisers, animal feedingstuffs and fuel for their tractors as well as veterinary services, among other things. Overall costs fell back in 2023 (driven by lower costs for fertilisers, feedingstuffs, and energy and lubricants), after being pushed up sharply in 2022 by the impact of Russia's invasion of Ukraine and resulting instability on markets. These input costs are termed 'intermediate consumption' in an accounting context. Intermediate consumption for the agricultural industry came to an estimated total of €311.5 billion for the EU as a whole in 2023, some €4.8 billion less than in 2022.
After the rapid increase in the overall price of goods and services consumed in agriculture in 2022 (+32.5 %), there was a moderate decline in 2023 (an estimated -4.3 %). This downturn was based on lower prices for fertilisers and soil improvers (an estimated -24.9 %), animal feedingstuffs (an estimated -6.7 %) and energy and lubricants (an estimated -6.4 %). Nevertheless, prices continued to rise for veterinary expenses (+16.7 %), the maintenance of buildings (+9.8 %), plant protection products (+8.1 %), the maintenance of materials (+7.7 %), and seeds and planting stock (+7.6 %) among other items.
Some costs are associated with the farming of animals; they required feed, which accounted for almost two-fifths (39.1 %) of total intermediate consumption and veterinary services (a further 2.1 %). Likewise, some costs are associated with crop farming; farmers required seeds and plants (5.2 % of total costs) and many used plant protection products, herbicides, insecticides and pesticides (4.7 %) as well as fertilisers and soil improvers (7.5 %). Other costs are common to all types of farm, independent of whether specialist or mixed-type.
The value of the output produced by the EU's agricultural industry in 2023 remained at the peak recorded in 2022
The estimated value of agricultural output in 2023 was unchanged in nominal terms from the level in 2022. This maintained the value of output at its peak and bookended the upward trend that had started in 2010 (see Figure 2). This change in nominal value largely reflected the balance of a small rise in the nominal price for agricultural goods and services as a whole (an estimated +0.4 %) and a small fall in the volume of output (an estimated -0.4 %).
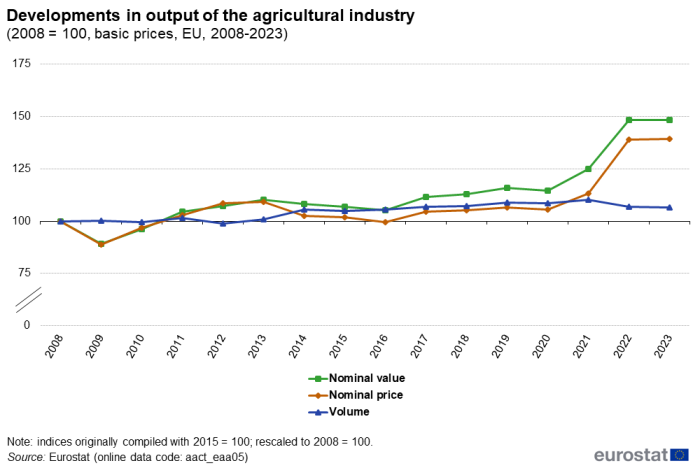
(2008 = 100, basic prices, EU, 2008-2023)
Source: Eurostat (aact_eaa05)
The stability in the output value of the EU's agricultural industry in 2023 reflected stark contrasts among EU countries. The sharpest rates of increase in value were in Portugal (an estimated +16.7 %) and Romania (an estimated +15.1 %), with the steepest falls (all about -20 %) in Latvia, Lithuania and Estonia.
The gross value added generated by the EU's agricultural industry in 2023 continued its upward trend
The estimated value of the intermediate goods and services used by the agricultural industry in 2023 fell back slightly (-1.5 %) from the high of 2022. With the estimated value of agricultural output unchanged, this resulted in a moderate rise (+2.1 %) in the gross value added generated by the agricultural industry. This increase in gross value added continued the upward trend since 2010.
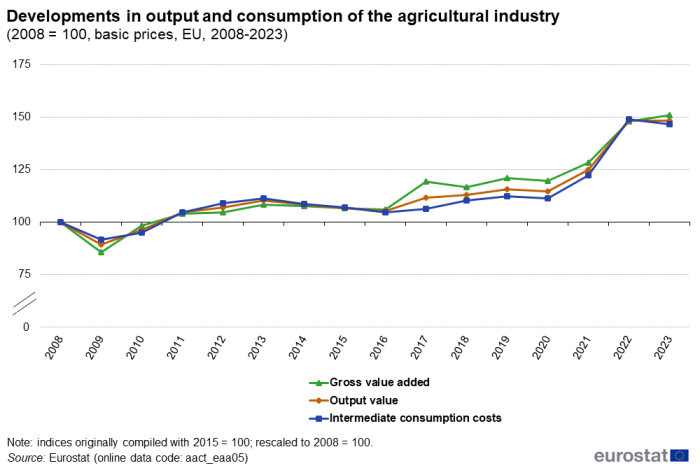
(2008 = 100, basic prices, EU, 2008-2023)
Source: Eurostat (aact_eaa05)
Agricultural labour productivity
The economic performance of the agricultural industry can be measured in terms of net value added at factor cost, which is gross value added adjusted for the consumption of fixed capital and subsidies and taxes on production. It is also known as factor income, as it is the remuneration available for all the factors of production (land, capital and labour).
Factor income in the EAA can be expressed per full-time labour equivalent. As such, it is considered a partial labour productivity measure; it is a measure of the net value added by the equivalent of each full-time worker in the agricultural industry. This productivity indicator is measured in real terms (adjusted for inflation) and expressed as an index (called Indicator A). It should not be confused with total income of farming households or the income of a person working in agriculture.
To understand the development of this agricultural income measure, it is first necessary to understand the development of the agricultural labour amongst which this remuneration is notionally shared. With so much part-time, seasonal and unsalaried labour input in agriculture, the amount of work actually carried out in farming activities is best described when using a unit called the annual work unit (AWU). This unit expresses the volume of work done in full-time work equivalents.
Downward trend in the volume of agricultural labour in the EU continued in 2023
Agricultural labour input in the EU was the equivalent of 7.6 million full-time workers in 2023.
A majority of total agricultural labour input is non-salaried labour; it was the equivalent of 5.3 million full-time workers in 2023. Salaried labour was the equivalent of 2.3 million full-time workers in 2023.
There is a long-established downward trend in the number of people working in the EU's agricultural sector; during the period between 2008 and 2023, the average rate of decline in the volume of agricultural labour used across the EU as a whole was 2.6 % per year. The downward trend continued in 2023, albeit estimated at a slower pace (-1.3 %).
Less total agricultural labour input was used in most EU countries in 2023 than in the preceding year, with particularly stark contractions continuing in Bulgaria (an estimated -7.3 %) and Hungary (an estimated -5.2 %), and renewed declines in Latvia (an estimated -6.1 %). However, there were some countries where the volume of labour used in 2023 was estimated to have been higher, the upturns in Denmark (+5.0 %), Slovakia (+2.3 %) and the Netherlands (+1.9 %) being the strongest.
In a few EU Member States, particularly Hungary, Denmark and Portugal, more salaried agricultural labour was used in 2023 than in 2022 (see Figure 4), in part reflecting an increase in hiring requirements at seasonal peaks. This was often in contrast to the overall decline in the total amount of agricultural labour used.
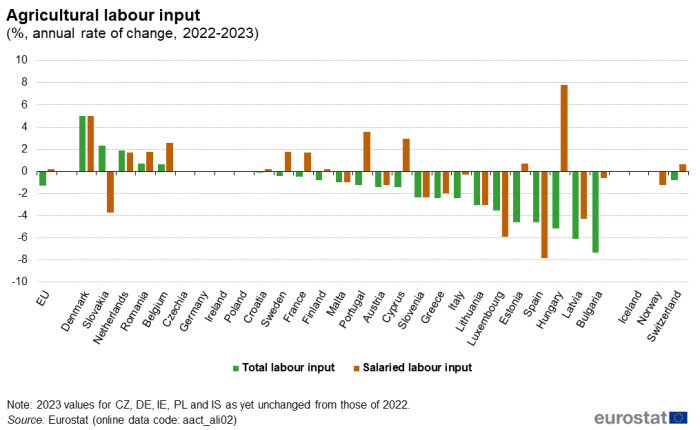
(%, annual rate of change, 2022-2023)
Source: Eurostat (aact_ali02)
Over the long-term, the amount of agricultural labour used has been in steep and steady decline
Total agricultural labour input declined sharply in almost all EU countries during the 15 year period between 2008 and 2023 (see Figure 5); the sharpest declines were in Bulgaria (an average -7.6 % per year), Slovakia (-5.4 % per year), Romania (-4.8 % per year) and Estonia (-4.2 % per year). This contraction in the agricultural labour force reflected both push and pull factors; there have been great strides in mechanisation and efficiency on the one hand and, on the other, a wider choice of attractive job opportunities in other sectors of the economy. The main exceptions to this general trend were Malta (+1.6 % per year on average), Ireland (+0.4 % per year on average) and the Netherlands (+0.1 % per year on average).
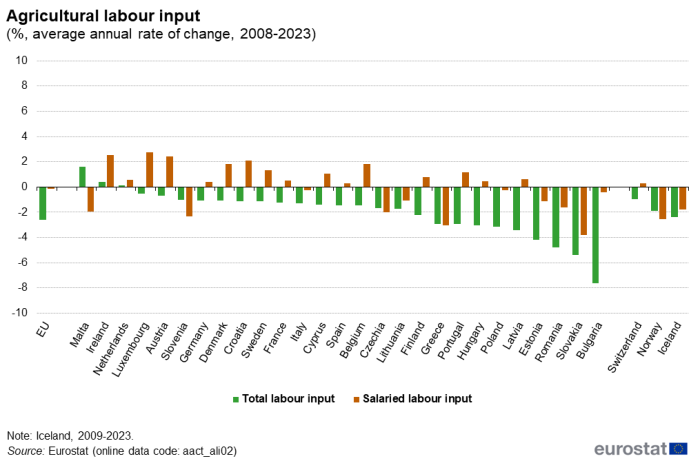
(%, average annual rate of change, 2008-2023)
Source: Eurostat (aact_ali02)
The contraction in the total work input from non-salaried labour between 2008 and 2023 was more pronounced than for salaried labour at the level of the EU as a whole (-3.4 % per year on average compared with -0.1 % per year). Over this period, there was an expansion in the use of salaried labour input in Luxembourg (+2.7 % per year on average), Ireland (+2.5 % per year on average), Austria (+2.4 % per year on average), Croatia (+2.1 % per year on average), and Denmark and Belgium (both +1.8 % per year on average), among others. By contrast, there were sharp contractions in the use of salaried labour input in Slovakia (-3.8 % per year on average), Greece (-3.0 % per year on average), Slovenia (-2.3 % per year on average), and Czechia and Malta (both -2.0 % per year on average).
Agricultural income as defined by real factor income per AWU declined for the EU in 2023 (-5.4 %)
Agricultural income, as defined by deflated (real) factor income per AWU and expressed as an index (called indicator A), for the EU as a whole in 2023 was 5.4 % lower than in 2022. This reflected a lower -6.7 % level of factor income compared with 2022 that was notionally achieved by a smaller total agricultural labour input (down -1.3 %).
A majority of EU countries estimated declines or almost no change in this index of agricultural income per AWU in 2023 (see Figure 6), underpinning the overall fall at the level of the EU as a whole. The sharpest declines were in Estonia (an estimated -64.4 %), Ireland (-32.9 %), Lithuania (-31.1 %) and Sweden (-30.6 %). There were only a few EU countries where agricultural incomes increased in 2023, the highest rates being in Belgium (+16.0 %) and then Spain (+12.4 %).
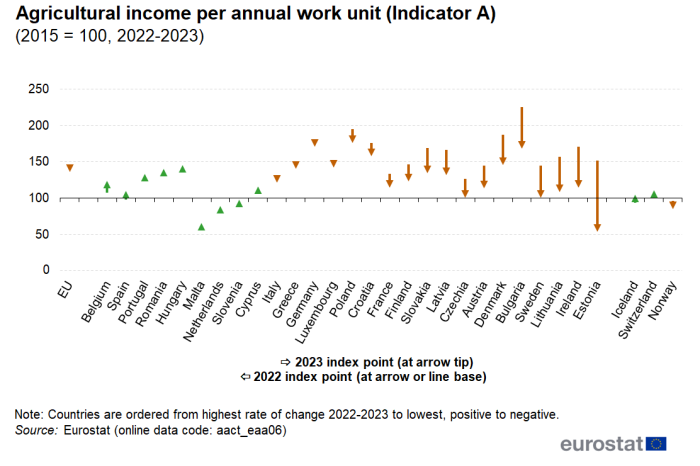
(2015 = 100, 2022-2023)
Source: Eurostat (aact_eaa06)
The upward trend in the index of agricultural income for the EU was halted in 2023
Agricultural income per AWU for the EU as a whole in 2023 declined, halting the upward trend since a relative low in 2009. For most of this period, this development reflected a relatively steady level of factor income being accompanied by a continuing contraction in agricultural labour input. In 2023, however, there was a relatively sharp decline in factor income.
Despite the decline in 2023 as compared with 2022, agricultural income per AWU for the EU as a whole remained 69.1 % higher than fifteen years previously in 2008. Over the same period, factor income was 13.9 % higher but agricultural labour input had shrunk by 32.6 %.
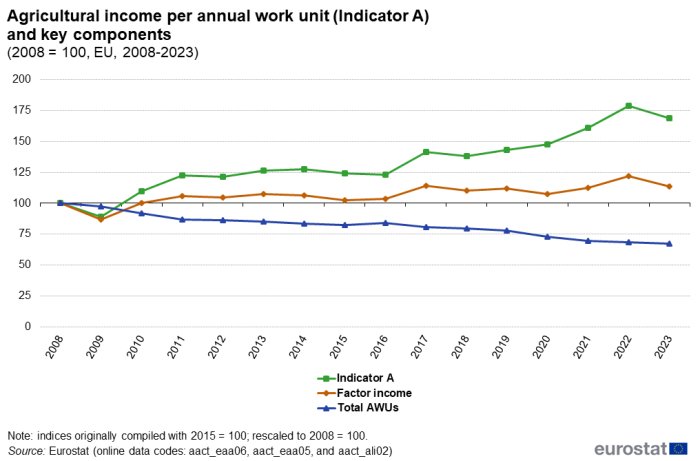
(2008 = 100, EU, 2008-2023)
Source: Eurostat (aact_eaa06), (aact_eaa05) and (aact_ali02)
Resource performance of the agricultural sector
There is increasing interest in the efficiency with which resources are used[1]. In order to become more sustainable, an economy would need to decouple economic growth from resource use and its environmental impact.
To better monitor this sustainability, prices should reflect the real costs of resource use. However, the social and environmental outputs of farming activities are rarely priced. Indeed, so-called 'green accounts' for agriculture are far from being completed, nor the green efficiency indicators that could result from them. Much work is being done in this area: DG AGRI has developed an 'Agri-Sustainability compass', and work is being done to develop total factor productivity indicators for agriculture that look at a measure of agricultural output against a combined measure of the input from intermediate consumption, land, labour and capital as well as sustainable productivity measures.
Nevertheless, some broad indication of the resource performance of agriculture can be derived from the EAA by looking at trends in the 'volumes' of outputs generated and of the goods and services used up or 'consumed' as inputs in the production process[2]. These volumes come from a decomposition of the values into price and volume components. These implicit volumes are not quantities; they are not measured in terms of kilograms or tonnes. They are termed 'volumes' because they capture not only changes related to quantity but also to quality as well as composition, which is important to bear in mind. As indices, they provide an overview of the trends in the volumes of inputs and outputs, which can be used for some productivity and performance measures.
Changes in the output volume of agricultural industry largely mirrored changes in the volume of input goods and services used
For much of the period between 2008 and 2021, there was an upward trend in the output volume of the EU's agricultural industry (a total increase of +10.1 %). To a large extent, higher output volumes were underpinned by the rise in the volume (+9.5 %) of input goods and services consumed (see Figure 8), suggesting little evidence of any decoupling of output growth from resource use at the EU level. In 2022 and 2023, output volumes fell back relatively sharply but the cutback in the use of intermediate goods and services was even sharper.
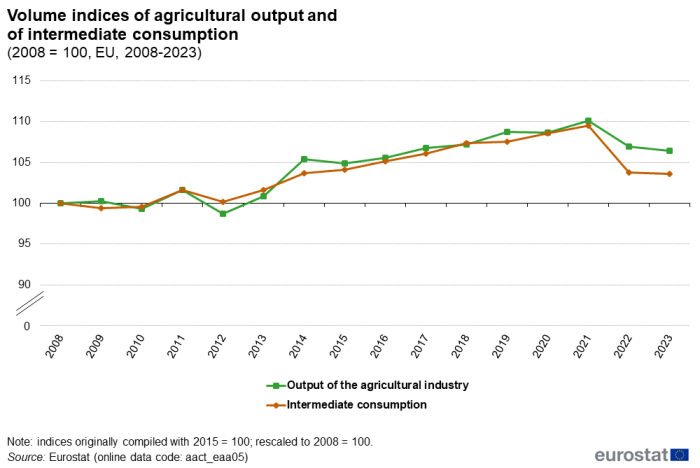
(2008 = 100, EU, 2008-2023)
Source: Eurostat (aact_eaa05)
Among EU countries, there was also little suggestion of an apparent decoupling of agricultural output growth from intermediate consumption growth, with a few notable exceptions. Over the period between 2008 and 2023, agricultural output in Germany increased by 8.0 % at the same time as the volume of intermediate consumption of goods and services declined by 6.4 %. This divergence was also clear in Czechia, Denmark and to a lesser extent in Hungary. In Slovenia, a sharp decline in intermediate consumption use (-16.7 %) had little impact on the overall volume of agricultural output (-0.3 %). In Finland and Slovakia, the considerable (-26.3 % and -15.2 %) cutbacks in the consumption of goods and services were in parallel with much smaller rates of decline (-6.1 % and -5.9 % respectively) in the volume of agricultural output. It should be borne in mind that these changes may, in part, reflect changes within the structure of the agricultural industries in these countries as well as improved resource efficiency.
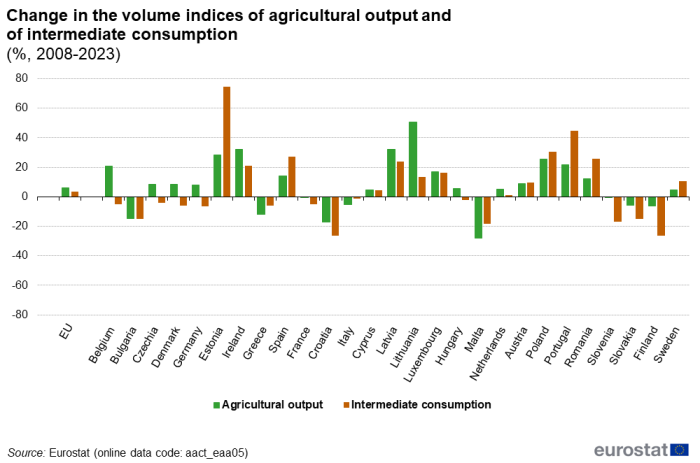
(%, 2008-2023)
Source: Eurostat (aact_eaa05)
Source data for tables and graphs
Data sources
The EAA are a satellite account of the European system of accounts (ESA 2010). They cover the agricultural products and services produced over the accounting period sold by agricultural units, held in stocks on farms, or used for further processing by agricultural producers. The concepts of the EAA are adapted to the particular nature of the agricultural industry: for example, the EAA includes not only the production of grapes and olives but also the production of wine and olive oil by agricultural producers, if produced from own grapes and olives. It includes information on intra-unit consumption of crop products used in animal feed, as well as output accounted for by own account production of fixed capital goods and own final consumption of agricultural units.
The EAA comprises a production account, a generation of income account, an entrepreneurial income account and some elements of a capital account. For the production items, EU Member States transmit to Eurostat values at basic prices, as well as their components (values at producer prices, subsidies on products and taxes on products).
The output of agricultural activity includes output sold (including trade in agricultural goods and services between agricultural units), changes in stocks, output for own final use (own final consumption and own-account gross fixed capital formation), output produced for further processing by agricultural producers, as well as intra-unit consumption of livestock feed products. The output of the agricultural industry is made up of the sum of the output of agricultural products and of the goods and services produced in inseparable non-agricultural secondary activities; animal and crop output are the main product categories of agricultural output.
Three indicators are computed in relation to agricultural income:
- an index of real income of factors in agricultural activity per AWU (Indicator A);
- an index of real net agricultural entrepreneurial income, per unpaid AWU (Indicator B);
- and the net entrepreneurial income of agriculture (Indicator C).
The information presented on agricultural income relates to indicator A (the real income of factors in agriculture per AWU). This indicator corresponds to the real (deflated) net value added at factor cost of agriculture per AWU and is expressed as an index. Net value added at factor cost is calculated by subtracting from the value of agricultural output at basic prices the value of intermediate consumption, the consumption of fixed capital and adding the value of (other) subsidies less taxes on production.
Agricultural price statistics provide information on the development of producer (output) prices for agricultural products and purchaser prices for the means of agricultural production (the intermediate consumption of goods and services within the production process). Data on prices are available for single commodities and for larger aggregates in the form of absolute prices and price indices.
The index of producer prices for agricultural products is based on sales of agricultural products, while the input index (for intermediate goods and services) is based on purchases of the means of agricultural production. Prices should be recorded at points which are as close as possible to those of the transactions which the farmer actually undertakes. This means that product prices should be recorded at the first marketing stage so as to best indicate the actual producer prices received by farmers. Similarly, the prices paid by farmers for their means of production should be recorded at the last marketing stage, that at which the items arrive on the farm, so as to best indicate the purchase prices paid by farmers. It is assumed, by convention, that the fertilisers and feeding stuffs purchased are used in the same production period and that there are no stocks on farm.
As regards spatial comparisons, the structure of the weights with respect to products and means of production reflect the value of the sales and purchases in each country during the previous year (currently 2015 = 100); the weights therefore differ from one country to another.
Context
The performance of the agricultural sector has traditionally been about how successful farming is in delivering primary agricultural products and services. However, it is increasingly taking on a green aspect, recognising the impact of agriculture on water, air and soil quality, land use diversity, ecologies, wildlife and climate change.
The European Green Deal [3] sets out how to make Europe the first climate-neutral continent by 2050. The Farm to Fork Strategy [4], for a fair, healthy and environmentally-friendly food system, was adopted by the European Commission on 20 May 2020 and lies at the heart of the Green Deal. Among other things, it addresses comprehensively the challenges of sustainable food systems by recognising that 'food production still results in […] pollution, contributes to the loss of biodiversity and climate change, and consumes excessive amounts of natural resources' [5]. This is a reason for the goal to increase the area under organic farming to 25 % of the utilised agricultural area by 2030, a goal that goes hand-in-hand with measures to change resource performance. Individual targets to reduce dependency on chemical pesticides and antimicrobials, reduce excess fertilisation and reduce waste will pave the way for a more sustainable food-chain.
Assessing the performance of the agricultural sector matters for a number of reasons:
- farming is a cornerstone of the rural community, one on which a number of 'upstream' sectors (such as machinery, animal healthcare and input businesses) and 'downstream' sectors (such as food processing, packaging and transport businesses) depend;
- farming is about providing a stable supply of safe, quality food;
- farming has a key role to play in preserving landscapes and biodiversity;
- farming has a key role to play in climate change action; and
- to support this, there is a need to ensure a fair income for farmers.
Economic impacts on farmers therefore not only influence future farming business decisions but also wider ecological and environmental business decisions and behaviour.
The performance of the agricultural sector as a whole can be assessed by bringing the information about the volume and price changes for agricultural goods and services under the umbrella of an accounting structure. To this end, the economic accounts for agriculture (EAA) provide a set of comparable data that provide an insight into:
- the economic viability of agriculture;
- the income generated by farmers;
- the structure and composition of agricultural production and the inputs used in that production; and
- the relationships between prices and quantities of both outputs and inputs.
Direct access to
- Agriculture (t_agr), see:
- Economic accounts for agriculture (t_aact)
- Agricultural prices and price indices (t_apri)
- Agriculture (agri), see:
- Economic accounts for agriculture (aact)
- Economic Accounts for Agriculture (aact_eaa)
- Agricultural Labour Input Statistics (aact_ali)
- Unit value statistics for agricultural products (aact_uv)
- Agricultural prices and price indices (apri)
- Selling prices of agricultural products (absolute prices), land prices and rents (apri_ap)
- Price indices of agricultural products (apri_pi)
- Agriculture, forestry and fishery statistics — 2020 edition (statistical book)
- Absolute agricultural prices (ESMS metadata file — apri_ap_esms)
- Economic accounts for agriculture (ESMS metadata file — apri_ap_esms)
- Manual on the economic accounts for agriculture and forestry EAA/EAF 97 (Rev. 1.1)
- Price indices of agricultural products (ESMS metadata file — apri_ap_esms)
- Target methodology for agricultural labour input (ALI) statistics (Rev. 1) (ESMS metadata file — aact_esms)
- Regulation (EC) No 138/2004 of 5 December 2003 concerning economic accounts for agriculture
- Summaries of EU Legislation: Economic accounts for agriculture
Notes
- ↑ The Europe 2020 strategy includes the Roadmap to a Resource Efficient Europe (COM(2011) 571) that outlines how the European economy can be transformed into a sustainable one by 2050.
- ↑ This is similar to the exercise done by the European Environment Agency (EAA) to determine resource efficiency by comparing Eurostat data on GDP with Eurostat data on domestic material consumption taken from the material flow accounts.
- ↑ For more information, see: A European Green Deal.
- ↑ For an overview of the strategy and related documents, see Farm to Fork strategy.
- ↑ For more information, see the Communication from the Commission on the European Green Deal.