Eurostat compiles European Union (EU) and euro area infra-annual economic statistics relevant for short-term economic analysis. Among these, a list of indicators called PEEIs (abbreviated from 'principal European economic indicators') has been identified by key users as being of prime importance for monetary and economic policies of the euro area.
This article first provides an insight into the recently released 2010 PEEI in focus report on service producer price indices (SPPIs), then informs on how to access all the PEEI in focus reports produced since 2005.
General overview
Nine PEEIs concern short-term business statistics (STS), namely indices covering: industrial production, domestic industrial producer prices, industrial import prices, production in construction, building permits, the volume of sales in retail trade, service turnover, and services producer prices.

Since 2005 Eurostat has collected information from countries on the sources and methods they use to compile the PEEIs and synthesises into a report on one PEEI within STS every year. These reports became known as the PEEI in focus reports; they are valuable background information for users and for compilers alike.
For 2010 the index chosen for the PEEI in focus report was the services producer price index (SPPI). The 2010 PEEI in focus questionnaire was returned by all of the EU Member States, as well as Norway, Switzerland and Croatia. The information provided generally relates to practices in the year 2009.
Service producer price indices (SPPIs)
SPPIs are intended to trace price movements that reflect market supply and demand conditions in order to facilitate the analysis of macro-economic conditions and to monitor inflationary pressures. They also serve as a deflator to convert the value of service output into volume measures.
Developing service price indices is a difficult task as service output is often hard to identify and even more difficult to measure reliably, as services may be tailored or bundled in different ways for different users.
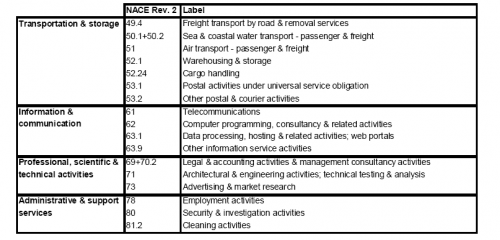
The STS Regulation specifies a list of activities for which SPPIs should be developed (see Table 1) between 2005 and the end of 2010. Together Eurostat and the OECD developed the Methodological guide for developing producer price indices for services to assist countries.
Source of data
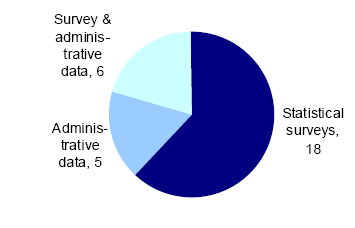
All countries reported using statistical surveys to collect service producer price data. One quarter of countries reported collecting at least some data from published prices, of which several were surveys of web-based prices, for example for air transport or telecommunications. A similar number of countries reported using data from regulatory authorities, and this was also particularly common for telecommunications. Three countries reported using commercial sources, and in two cases it was specified that this concerned advertising activities.
Two countries specified using data from consumer prices, and it may well be that the use of this data may be more widespread: many other countries combine consumer price indices with SPPIs for business markets to produce a total PPI
Production and development of SPPIs
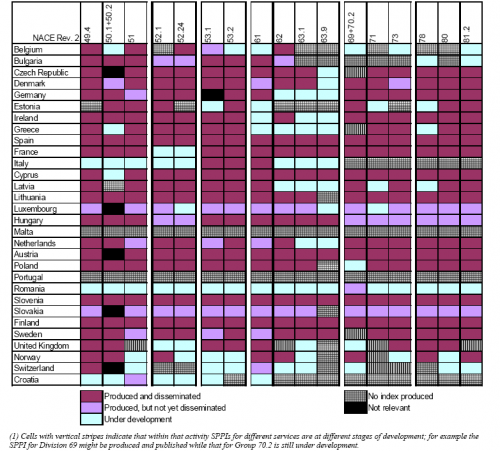
Table 2 shows the coverage of SPPIs included in the PEEI in focus report indicating for which activities SPPIs are produced and which are in various stages of development: this information was collected at the beginning of 2010; since then development work may have started for some activities and been completed for others. Spain, Hungary, Austria, Slovenia, Finland and Sweden produce SPPIs for all of the activities (excluding those that are not relevant, such as sea and coastal water transport in land-locked countries). A further nine countries have indices produced or under development in all activities shown. Six more countries have almost complete coverage in terms of either production or development, with just one activity not yet in the development phase, and this is nearly always NACE Rev. 2 Group 63.9 (other information service activities). The remaining countries have several activities where they have not yet started development.
In terms of activities, SPPIs are most widely produced in postal and courier activities (NACE Rev. 2 Division 53) and transport activities (Divisions 49 to 51), and production is less common in information and communication services (Divisions 61 to 63).
The SPPI data that has been provided to Eurostat is available from Eurostat’s online database.
Pricing methods
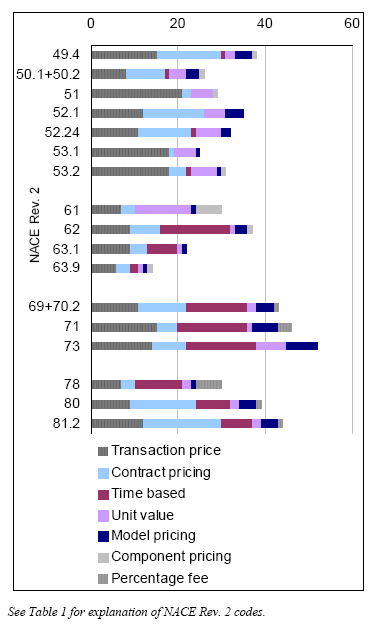
Various methods are used because of the diversity of different types of service output: a brief explanation is given in Table 3, while Figure 3 indicates the extent to which the methods are used.
In road freight, water transport, cargo handling and storage, contract pricing and transaction prices are both commonly used. Air transport and postal and courier services are dominated by transaction pricing, reflecting the relatively abundant on-line information. Security and investigation activities, as well as cleaning activities rely more heavily on contract pricing, because of the often regular and standardised nature of this work. For professional, scientific and technical activities, as well as for computer programming, consultancy and related activities and also employment activities, timebased methods (often an hourly rate) are commonly used.
Model pricing is occasionally used in nearly all activities but rarely by more than a few countries,and is most common in professional, scientific and technical activities. Methods based on percentage fees are used in most professional, scientific and technical activities and administrative and support service activities, but not elsewhere. Equally, the reverse is true of component pricing, which is used in most transportation and storage activities, as well as information and communication services, but not in the other services. Although used to some extent in every activity, only in telecommunications is the use of unit values the most common pricing method.
Price determining characteristics
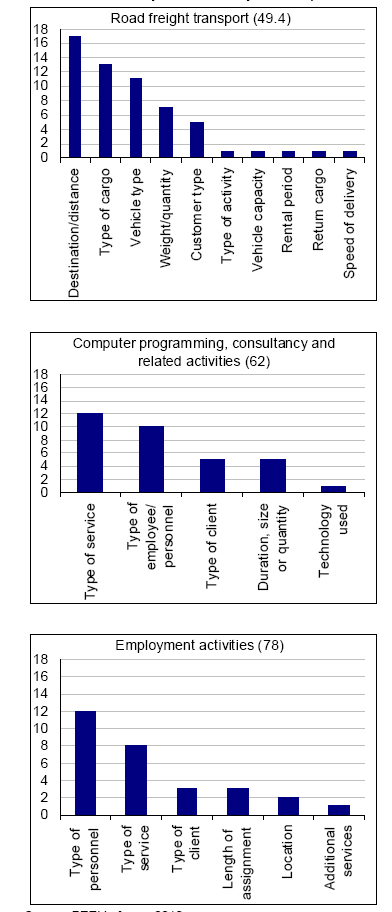
In order to follow price developments over time it is essential to precisely specify the unit of service output to be priced in successive months. Figure 4 gives three examples of the types of specifications commonly used by the countries, as included in the PEEI in focus report.
Markets covered
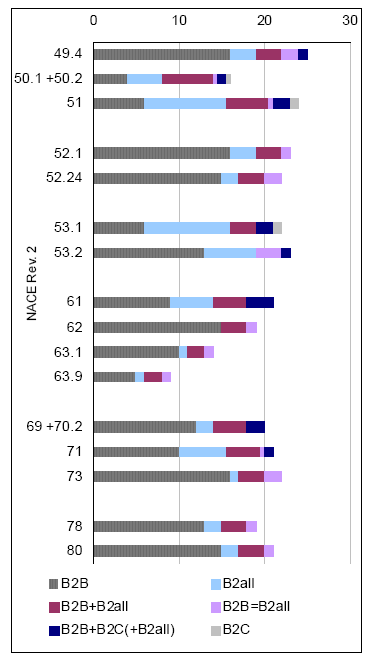
For SPPIs the STS Regulation focused on services to businesses, and so indices referred to as B2B (business to business) were required, in other words showing price developments for business customers. In some activities (for instance air passenger transport) it is particularly difficult to compile B2B indices separately from B2all (business to all) indices, and as can be seen from Figure 5 the most common situation is for countries to produce either a B2B index or a B2all index. A number of countries compile both a B2B and a B2all index, and some also produce a B2C (business to consumer) index as well.
Previous PEEI in focus reports
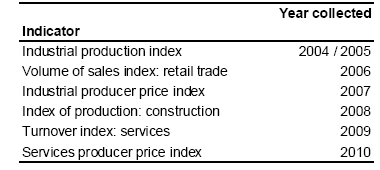
PEEI in focus reports have so far been produced for six of the nine PEEIs within short-term business statistics. These have been produced on a rotating basis, with one report produced each year since 2005 – see Table 4.
It is intended to complete this set of reports to cover industrial new orders, industrial import prices and building permits, and then to determine the procedure for updating all reports.
Reports available on CIRCA
The PEEI in focus reports are all available from the STS Circa groups which can be accessed through the methodology page on Short-term business statistics - in CIRCA the reports can be found in the Library, under the heading STS Quality.
The earliest reports are now 4-5 years old and methodological changes may have accompanied the change in classification (to NACE Rev. 2) and base year (to 2005) that took place during 2008 and 2009: the 2009 report on the turnover index in services was the first of these PEEI in focus reports to be produced after the migration to NACE Rev. 2.
Producing the reports
The annual cycle of producing the PEEI in focus reports starts with the design of a questionnaire to collect information from countries on their practices for the selected indicator. The questionnaires for different indicators have many points in common, for example information on the sample frame and sample design, frequency of data collection and definition of the variables. Nevertheless, each of the indicators has some methodological points that are of specific interest: some examples are presented in Table 5.
The questionnaire is sent to all of the Member States, Norway, Switzerland and the candidate countries. Based on the information provided by each country a report is compiled that aims to provide an overview of the methods used.
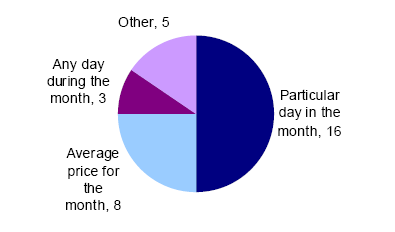
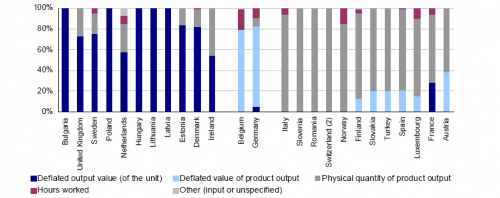
As an illustration, there is one example of the analysis from each of the PEEI in focus reports produced between 2004 and 2009.
Context
Eurostat compiles European Union and euro area infra-annual economic statistics relevant for short-term economic analysis. Among these, a list of indicators, called Principal European Economic Indicators (PEEIs) has been identified by key users as being of prime importance for the conduct of monetary and economic policy of the euro area.
Nine PEEIs concern short-term business statistics (STS), namely indices covering: industrial production, domestic industrial producer prices, industrial import prices, production in construction, building permits, the volume of sales in retail trade, service turnover, and services producer prices.
Since 2005 Eurostat has collected information from countries on the sources and methods they use to compile the PEEIs and synthesises into a report on one PEEI within STS every year. These reports became known as the PEEI in focus reports; they are valuable background information for users and for compilers alike. For 2010 the index chosen for the PEEI in focus report was the services producer price index (SPPI). The 2010 PEEI in focus questionnaire was returned by all of the EU Member States, as well as Norway, Switzerland and Croatia. The information provided generally relates to practices in the year 2009.

