Land use statistics
Data extracted in May 2021.
Planned article update: June 2024.
Highlights
This article presents statistical data on land use within the European Union (EU). The data were gathered as part of the land use/cover area frame survey (LUCAS) undertaken between March and November 2018. LUCAS is the largest harmonized land field survey implemented in the EU.
Land is the basis for most biological and human activities on the Earth. Agriculture, forestry, industry, transport, housing and other services use land as a natural and/or an economic resource. Land is also an integral part of ecosystems and indispensable for biodiversity and the carbon cycle. Land can be divided into two interlinked concepts:
- land cover refers to the biophysical coverage of land (for example, crops, grass, broad-leaved woods, or built-up areas);
- land use indicates the socioeconomic use of land (for example, agriculture, forestry, recreation or residential use).
- Land cover and land use data form the basis for spatial and territorial analyses which are increasingly important for:
- the planning and management of agricultural, forest, wetland, water and urban areas;
- nature, biodiversity and soil protection, and;
- the prevention and mitigation of natural hazards and climate change.
Statistical data on land cover within the European Union (EU) in 2018 are presented in Land cover statistics.
Full article
Land use
An area of land can be used in parallel for many different purposes: for example, a forest may be used for forestry, for hunting, or for recreation; it is important to note that the statistics that follow are based on the primary (or main) use.
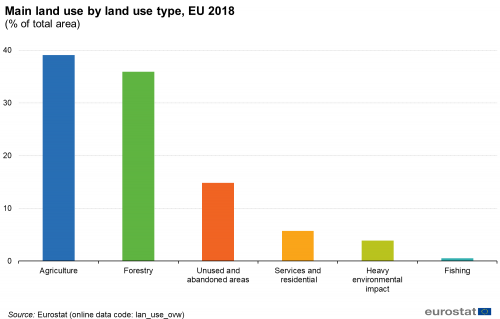
Agricultural land use is the most common primary land use category in the EU; it accounted for 39.1% of the total area in 2018 (see Figure 1). Areas used primarily for forestry covered 35.9% of the EU area, while 14.8% of the area of the EU was unused or abandoned (note that the LUCAS survey is based on field visits and that land use is determined on the basis of visible signs of land use when surveyed). A much lower share (5.7%) of the total area of the EU was used for services and residential purposes (including commerce, finance and business; community services; recreation, leisure and sport; residential; and nature reserves), while uses with a heavy environmental impact (including mining and quarrying; energy production; industry; water and waste treatment; and construction) claimed a further 3.9%, leaving just 0.5% that was used primarily for fishing.
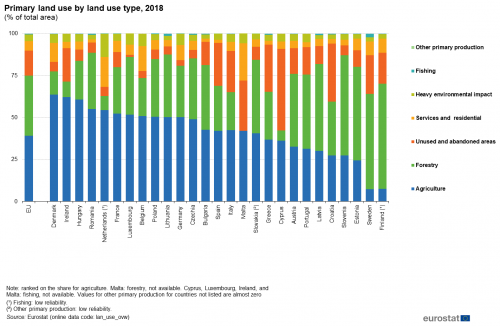
Land under agricultural use encompasses various land cover types: the most common are arable land, permanent crops and grassland. Small portions of other land cover types such as artificial land (for example, farm buildings or roads) and water (for example, irrigation ponds) can also be in agricultural use. In 12 out of the EU Member States, more than half of the total area was used for agricultural purposes in 2018 (see Figure 2). The highest share of agricultural land use was recorded in Denmark (63.7%), while Ireland and Hungary each reported shares that were close to three fifths. In Finland and Sweden, agriculture played a minor role in terms of land use, accounting for less than 10.0 % of the total land area in both of these Member States; the next lowest share is observed in Estonia (24.5%).
Unsurprisingly, forestry was often the dominant land use in those EU Member States which had a high degree of woodland land cover and where agricultural land use was generally quite low; as mentioned above, note that not all of this land is used for forestry, with alternative uses including recreation, hunting, protected areas, or no visible use. In Finland, Sweden, Slovenia, Estonia and Latvia more than 50% of the total area was used for forestry purposes, a share that fell to below 10.0% in Ireland, Cyprus and the Netherlands.
Some 15.4% of the area of the EU in 2018 was abandoned or there was no visible use of the land. These areas may be used for fishing and hunting, but large areas of land can be excluded from any socioeconomic use – for example, as a result of being in protected areas where socioeconomic activities are either completely forbidden or heavily restricted; there are also remote or difficult to access areas which have not attracted socioeconomic activities. The southern EU Member States were often characterized by relatively high shares of their total area being unused or abandoned, reflecting at least to some degree, the prevalence of sparsely-populated, rural and arid regions. In Cyprus unused and abandoned areas were the primary land use little below one half (48.5%) of the total area in 2018, while shares between one quarter and one third were recorded for Spain, Malta, Greece and Croatia.
Services and residential land use covered 5.7% of the EU land area in 2018. More than one half of this total was devoted to residential use (51.1%) and to recreation, leisure and sport use (35%), while the shares for community services (10%) and commerce, finance and business (3.9%) were much lower. The share of services and residential land use rose to a level above 10.0% of the total area in Denmark, Belgium and the Netherlands, and was above 20.0% in Malta (22.2% was recorded); in the Netherlands this was due to a particularly large share for recreational, leisure and sports purposes (almost half of the total, 48.9%), whereas in Malta it was due to a particularly large share for residential purposes (81,1%).
Land uses related to heavy environmental impact occupied 3.9% of the EU territory in 2018. By far the most common land use within this category was for transport, communication networks, storage and protective works, which accounted for more than three quarters (77.4%) of the total area, while 7.8% of the total for heavy environmental impact was estimated for by mining and quarrying, 4.0% by industry, 4.1% by energy production, 4.3% by water and waste treatment, leaving 2.4% of the total for construction uses. The highest share of heavy environmental impact in total land use was recorded in the Netherlands, where 13.9% of land was used for these purposes: this may be linked to a high-density transport network and to large storage areas for ports and logistical services. The next highest shares were recorded for countries neighboring or close to the Netherlands, as Belgium (7.4%), Germany (6.7%) and Luxembourg (7.1%) were the only other EU Member States to report shares of more than 6.0%.
Source data for tables and graphs
Data sources
LUCAS is a field survey based on an area-frame sampling scheme carried out by Eurostat. Data on land cover and land use are collected, with photographs taken to detect any changes in land cover/use. The data set is unique as it is comparable in terms of definitions and methodology.
The data presented in this article refer to the LUCAS campaign carried out by Eurostat in 2018 covering all EU Member States. Data on land cover and land use were collected for approximately 238000 field points between March and October 2018, and for 100000 photo-interpreted points; these points were selected from a standard 2 km grid covering a total of more than one million points all over the EU. The land cover and the visible land use data were classified according to the harmonized LUCAS land cover and land use classificationwhile information was also collected on irrigation management and structural elements in the landscape. Furthermore, at 1 in 10 of the selected field points a topsoil sample was taken to help assess environmental factors, update soil maps, validate soil models and measure the quantity of organic carbon in the soil.
The LUCAS microdata for 2018 may be accessed directly on the Eurostat website.
The next LUCAS survey will be held in 2022.
Context
Europe is composed of a myriad of different landscapes and land uses that reflect topography, as well as climatic and historical changes. While these are somewhat difficult to see on a day-to-day basis, ongoing processes continually alter landscapes and the environment. Often the changes taking place may be linked to tensions arising from the conflict between the demand for more resources and infrastructure improvements on the one hand, and biodiversity and space on the other.
Land use and land cover data are important for an understanding of how environmental systems function, and their assessment over time provides a means for assessing the impact that any changes in land use may have on biodiversity and ecosystems.
Land use change is often considered to be a primary driver for changes in biodiversity and ecosystems. In recent years some of the most important land use changes have included: a decline in agricultural land use (as crop yields continue to rise); an increase in urban areas (arising from demographic and economic change); and a gradual increase in forest land areas (in part, driven by the need to meet global environmental commitments in relation to climate change). The development of roads, motorways, railways, intensive agriculture and urban developments has led to Europe’s landscape being increasingly broken up into small pieces. This pattern of fragmentation has the potential to affect levels of biodiversity and could result in negative impacts on flora and fauna.
Direct access to
- Land cover overview by NUTS 2 regions (lan_lcv_ovw)
- Land cover and land use, landscape (LUCAS) (ESMS metadata file — lan_esms)

