Environmental economy – statistics by Member State
Data extracted: March 2024.
Planned article update: March 2025.
Highlights
This article presents statistics on the environmental economy of the EU Member States as it is defined in the environmental goods and services sector (EGSS) accounts. The environmental economy produces goods and services such as organic vegetables, renewable energy, or treatment of waste and wastewater that help to either protect the environment or preserve the stock of natural resources. Together with the article 'Environmental economy - statistics on employment and growth', this article provides insight into a sector that is vital for Europe's transition towards a competitive climate-neutral economy as envisioned under the European Green Deal.
Full article
Key figures
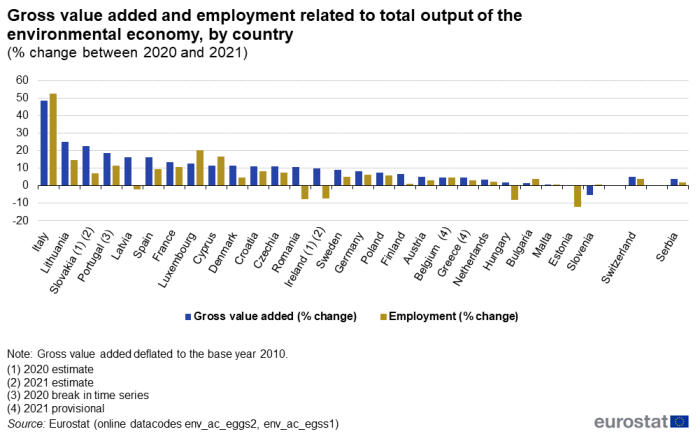
According to Eurostat estimates, the environmental economy in 2021 among the EU Member States saw the highest growth in Italy (48.4 %), followed by Lithuania (24.9 %) and Slovakia (22.7 %). By contrast, it decreased by 5.1 % in Slovenia and increased by less than 1 % in Estonia and Malta. For all countries, the majority of gross value added and employment in the environmental economy is related to goods and services sold or intended to be sold on the market; the remainder stems from production for own use (ancillary or final) or for non-market purposes (as give-away for free or at non-significant prices). This article focuses on all activities of the environmental economy without any distinction between market, non-market or for own final use activities.
Growth rates vary across countries (Figure 1). Both gross value added and employment increased in 21 of the EU Member States in 2021. Some countries, such as Latvia, Romania or Ireland presented a positive growth of the gross value added (GVA) in 2021 compared with 2020 (respectively 16.2 %, 10.7 % and 9.7 %) while employment decreased in 2021 (respectively 2.0 %, 7.5 % and 7.4 %). Only Slovenia presented a decrease of 5.1 % in GVA in 2021, while the employment of the environmental economy increased by 0.6 %.
Source: Eurostat (env_ac_egss2), (env_ac_egss1)
Gross value added
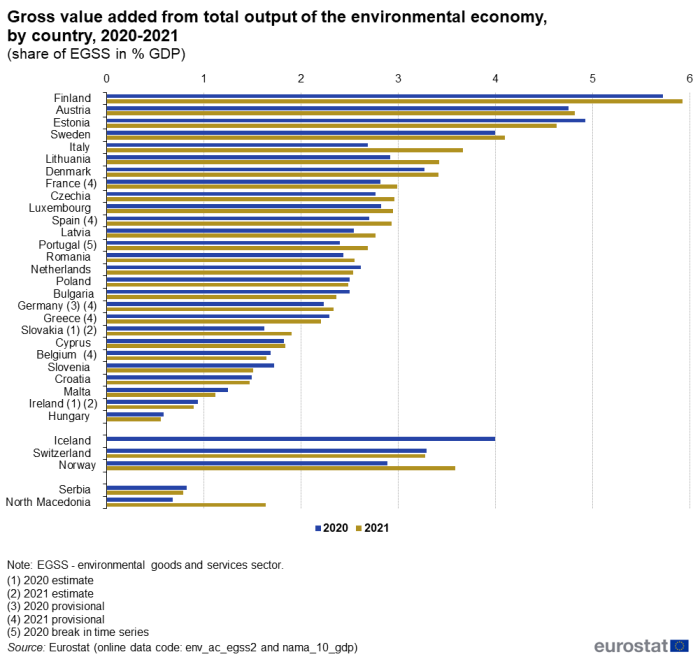
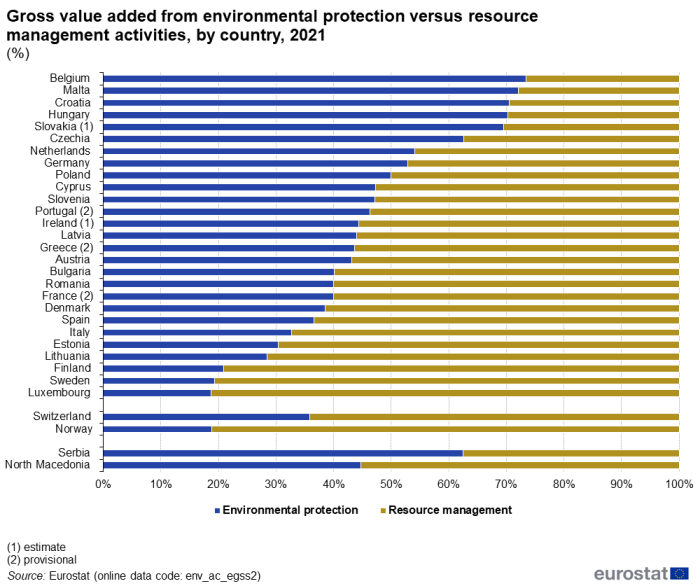
In 2021, total output of the environmental economy contributed between 5.9 % (Finland) and 0.6 % (Hungary) to the GDP of EU Member States (Figure 2). Large parts of the gross value added in Finland stem from forest management and renewable energy production. The environmental economy had been growing faster in 2021 than the overall national economy in 16 Member States. Most Member States generate more value added by producing goods and services for resource management than for environmental protection (Figure 3).
Source: Eurostat (env_ac_egss2), (nama_10_gdp)
Source: Eurostat (env_ac_egss2)
Employment
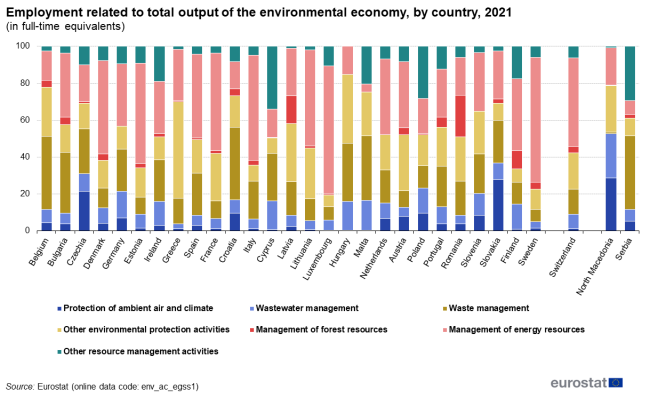
Eurostat estimates that, among the five largest EU economies (Germany, France, Italy, Spain and Poland), output of environmental goods and services generated - in terms of employment - circa 3.5 million full-time equivalent in 2021. In 2021, output of environmental goods and services created jobs in 22 EU Member States. The five most contributing countries, Italy, France, Spain, Germany and Poland, created around 521 400 new jobs in 2021. By contrast, five EU Member States presented a decrease in the number of jobs in the environmental goods and services economy. The largest job losses in 2021 were in Romania with 11 145 lost jobs, followed by Estonia with 4 441 lost job (Figure 5). Most employment in the environmental economy is related to waste management and management of energy resources (Figure 4).
Source: Eurostat (env_ac_egss1)
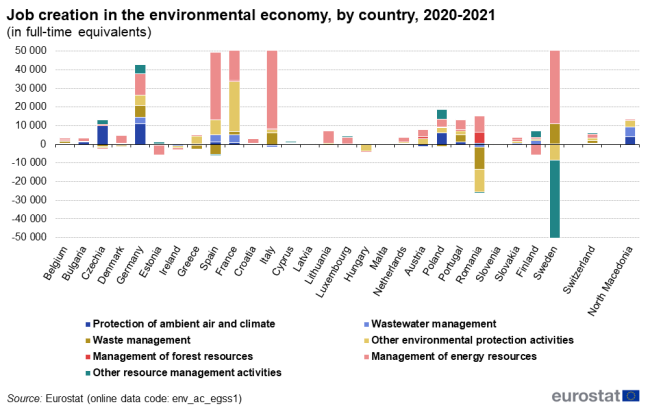
Source: Eurostat (env_ac_egss1)
Exports
In 2021, environmental goods and services contributed to the economy-wide exports by 17 % in Finland, 12 % in Denmark, around 9 % in Austria and 8 % in Czechia and 7 % in Portugal, but below 1 % in Hungary and Ireland (Figure 6). The composition of environmental exports varies across countries.
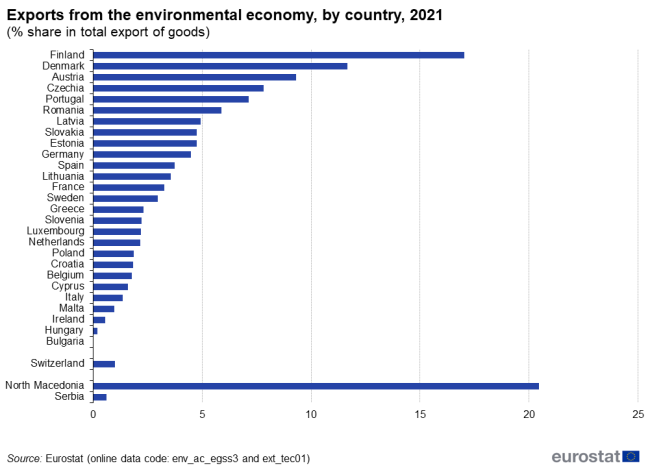
Source: Eurostat (env_ac_egss2), (ext_tec01)
Economic indicators
EGSS data can be used to derive sector-specific indicators. Let us consider gross value added of the renewable energy sector, comprising energy production itself but also the manufacturing of equipment such as photovoltaic cells and wind turbines, the installation of equipment, and any related research, consultancy, and management services. Calculating the ratio of GVA in euros and full-time equivalent (FTE) jobs provides insight into the labour productivity (labour productivity) of the renewable energy sector. Labour productivity measures the amount of goods and services produced by each member of the labour force, or in other words, the output produced per unit of input of labour, e.g. in 2021 Malta spent 11 FTE in order to add €3.6 million to GVA by renewable energy production. The ratio of the two figures is 331, the highest among the EU Member States.
Figure 7 suggests considerable differences between countries and provides scope for assessing the factors behind productivity levels, among them income, energy prices, subsidies for renewable energy, composition of the renewable energy mix, and the scope of activities covered. More detailed data for individual NACE sections suggest, for example, that large parts of value added in many countries are generated by water supply, sewerage, waste management and remediation activities (i.e. NACE E): more than 40 % of total GVA is generated by this activity in Hungary, Malta, Ireland or Poland. In Estonia, Lithuania, France, Italy and Finland, over one-fifth of the value added is generated by the construction industry. In Luxembourg the share of construction industry accounts for about 65 % of total GVA of the environmental sector. In Latvia and Romania the share of the primary sector (NACE A) represents respectively 26 % and 29 % of total GVA of the environmental sector.
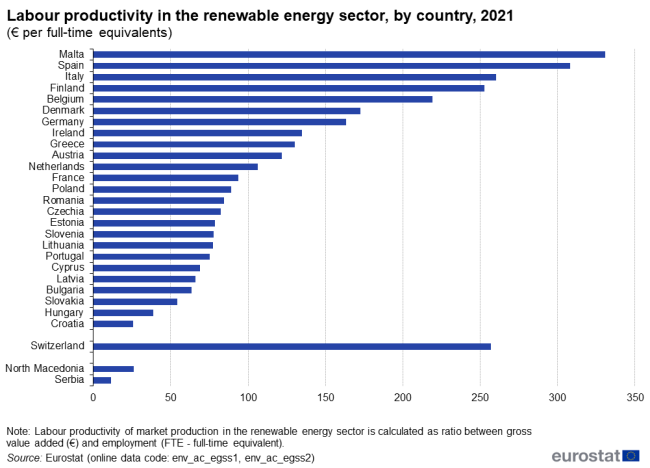
Source: Eurostat (env_ac_egss2), (nrg_100a)
Scope and variables
Goods and services are considered environmental if their purpose is either to protect the environment or to maintain or restore the stock of natural resources. Environmental goods and services comprise a large and diverse basket of products including renewable energy, electric vehicles, organically grown fruits and vegetables, sewerage and waste treatment services or the rehabilitation of mining sites. It is not straightforward to delimit environmental products from conventional ones. As principle criterion, environmental goods and services should have an environmental purpose. Such a purpose is identified in practice by considering the actual environmental impacts in conjunction with technical product features that must be suitable to protect the environment or preserve natural resources. To guide data compilers, Regulation (EU) No 2015/2174 proposes an indicative compendium of environmental goods and services. EGSS accounts capture environmental goods and services produced within a country and report on the related output, gross value added, employment, and exports as defined in the international system of National Accounts (SNA 2008) and its European version, the European System of National and Regional Accounts (ESA 2010).
The following definitions apply:
- Market output consists of all products that are produced for market disposal, either through sales at economically significant prices or through barter or payment in kind. Market output of environmental goods and services is valued at basic prices, that is, the prices received from purchasers plus subsidies minus taxes on products. Reporting of EGSS market output is mandatory for Member States, whereas reporting of the following characteristics is voluntary: (i) non-market output generated by governments and non-profit organisations, (ii) output produced for own final use, and (iii) ancillary output for transformation through in-house production processes.
- Gross value added is the difference between output and intermediate consumption. The gross value added of all economic sectors plus taxes minus subsidies on products comprises the gross domestic product (GDP) of a country.
- Employment comprises the number of persons engaged in the production of environmental goods and services. Employment in EGSS is quantified in full-time equivalents, defined as total hours worked divided by the average annual working hours in a full-time job.
- Exports comprise all transactions of market output, including sales, barter and gifts, from residents to non-residents.
Output, gross value added, employment, and exports are reported in the EGSS accounts as totals and disaggregated by (i) twenty-one economic sections according to NACE Rev. 2 and (ii) two groups of activities, that is, environmental protection and resource management.
- Environmental protection activities prevent, reduce and eliminate pollution or any other degradation of the environment. Air and climate protection, treatment of waste and wastewater, or environmental research and development represent environmental protection activities that are classified according to the international standard on the Classification of Environmental Protection Activities (CEPA 2000) into nine classes and several more sub-groups.
- Resource management activities preserve the stock of natural resources, thereby safeguarding them against depletion. The production of renewable energy, measures to use heat and energy more efficiently, or the management of forests are typical resource management activities. There is no international standard for the classification of resource management, so activities are grouped into seven classes, each disaggregated further into sub-groups according to a generic Classification of Resource Management Activities (CReMA) developed by Eurostat task forces.
See the revised CEPA and CReMA explanatory notes and the EGSS handbook for further detail.
Source data for tables and graphs
Data sources
This article presents the most recent data on gross value added, employment, and exports related to market production in the environmental economy. Eurostat collected the data in 2022 as part of the mandatory reporting for Member States.
Data for the environmental economy are recorded according to the principles of national accounting, following the guidance in the EGSS Handbook and the EGSS Practical Guide. As data reporting is mandatory since 2017 only, not all countries cover relevant goods and services in a comprehensive manner yet. Pertinent cases are flagged as estimate, provisional or break in time series. To account for the resulting uncertainty, EU aggregates are not yet calculated from the data reported by Member States. Instead, Eurostat estimates aggregates by combining information from national accounts, environmental protection expenditure accounts, structural business statistics, industrial commodity statistics, labour statistics, international trade statistics, agriculture statistics and energy statistics.
The data presented in this article refer to the environmental economy production and are not directly comparable with those presented in Eurostat's article on Environmental economy - statistics on employment and growth, as the EU aggregates reported in the latter article are not yet compiled as a direct sum of EU Member States estimates.
As methods and data sources for compiling EGSS accounts mature, accuracy and completeness of data will improve alongside. Data validation and the development of methodological guidance together with Member States will remain an important part of Eurostat's efforts to increase the coherence and quality of EGSS data in the future.
Context
Regulation (EU) No 691/2011 (as amended by Regulation (EU) No 538/2014) implements environmental-economic accounts as satellite accounts of National Accounts (ESA 2010). The European environmental-economic accounts adhere to the same accounting principles as national accounts and are consistent with the United Nation's System of Environmental-Economic Accounting – Central Framework (SEEA-CF), which serves as an international statistical standard. At present, six separate modules present data on: (i) air emissions, (ii) environmental taxes, (iii) circular economy and material flows, (iv) environmental protection expenditure, (v) physical energy flows and (vi) environmental goods and services. The industries producing environmental goods and services are commonly referred to as environmental economy.
Direct access to
- Environment (env), see:
- Environmental goods and services sector (env_egs)
- Employment in the environmental goods and services sector (env_ac_egss1)
- Production, value added and exports in the environmental goods and services sector (env_ac_egss2)
- Production, value added and employment by industry groups in the environmental goods and services sector (env_ac_egss3)
Methodology
- Regulation (EU) No 691/2011 on European environmental economic accounts
- Summaries of EU legislation: European environmental economic accounts
- Commission Implementing Regulation (EU) No 2015/2174 on the indicative compendium for environmental goods and services sector
- Regulation (EU) No 549/2013 of 21 May 2013 on the European system of national and regional accounts in the EU (ESA2010)
- Summaries of EU legislation: European Union system of national and regional accounts
- European Green Deal
- EU Circular Economy Action Plan
- Eco-innovation Action Plan (EcoAP)
- Study on the competitiveness of the EU Renewable Energy Industry (EU REI)
- Communication of the European Commission to the European Parliament, the Council, the European Economic and Social Committee and the Committee of the regions 'Green Employment Initiative: Tapping into the job creation potential of the green economy' (COM (2014) 446 final)
- OECD - Green growth and eco-innovation