Enlargement countries - population statistics
Data extracted in May 2024. Planned article update: June 2025.
Highlights
Among the candidate countries and potential candidate, between 2012 and 2022 the population increased only in Türkiye, from 74.7 million to 84.7 million.
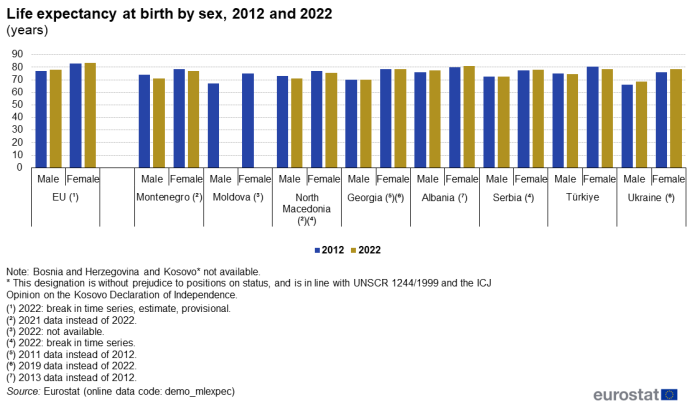
Among the candidate countries and potential candidate, life expectancy at birth for men ranged in 2022 from 68.4 years in Ukraine to 74.3 years in Türkiye, whereas for women it ranged from 75.5 years in North Macedonia and 80.9 years in Albania for the most recent year available. In the EU, life expectancy was 77.9 years for men and 83.3 years for women.
This article is part of an online publication and provides information on a range of population statistics for the candidate countries and the potential candidate and compares this with the corresponding data for the European Union (EU).
The new candidate countries, Georgia, Republic of Moldova and Ukraine, are usually included in the set of articles covering the enlargement countries. However, for these articles, only data which are submitted to and validated by Eurostat's subject matter units following the same process as data from Member States, are used. For Georgia, Moldova and Ukraine, data for many sectors are not yet transmitted in this way and are therefore not available yet, although for population statistics only data on population density are not available. These countries are presented also in the Statistics Explained articles for ENP-East countries, which are based on data supplied by and under the responsibility of the national statistical authorities of each country on a voluntary basis. Consequently, because of these separate processes, this inevitably leads to differences in data coverage between these two sets of articles.
Data shown for Georgia exclude the regions of Abkhazia and South Ossetia over which the government of Georgia does not exercise control. The data managed by the National Bureau of Statistics of the Republic of Moldova does not include data from the Transnistrian region over which the government of the Republic of Moldova does not exercise control. Since 2014, data for Ukraine generally exclude the illegally annexed Autonomous Republic of Crimea and the City of Sevastopol and the territories which are not under control of the Ukrainian government. Data on Ukraine for the year 2022 is limited due to exemption under the martial law from mandatory data submission to the State Statistics Service of Ukraine, effective as of 3 March 2022, following Russia’s war of aggression against Ukraine.
The article gives an overview of demographic developments in the candidate countries and the potential candidate, presenting indicators such as the total population and population by sex, the age structure of the population, population density, natural population change, migration and life expectancy.
Full article
Population by age and by sex
The recommended definition of total population is the ‘usual resident population’, which represents the number of inhabitants of a given area. Eurostat uses the reference date of 1 January of the year in question. In some cases, the 31 December of the previous year is used.
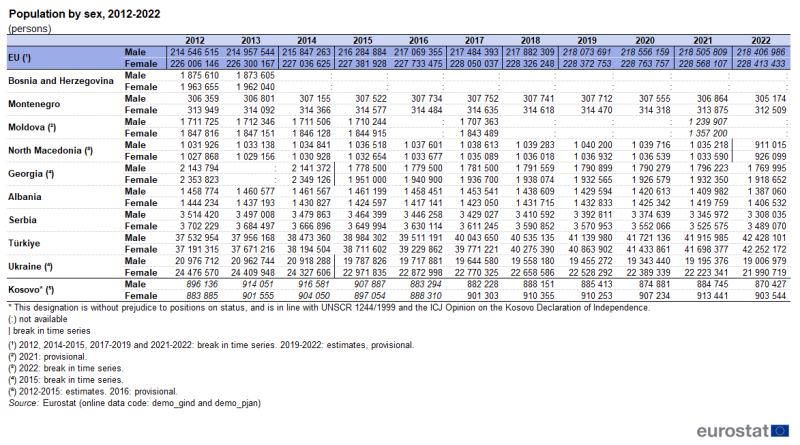
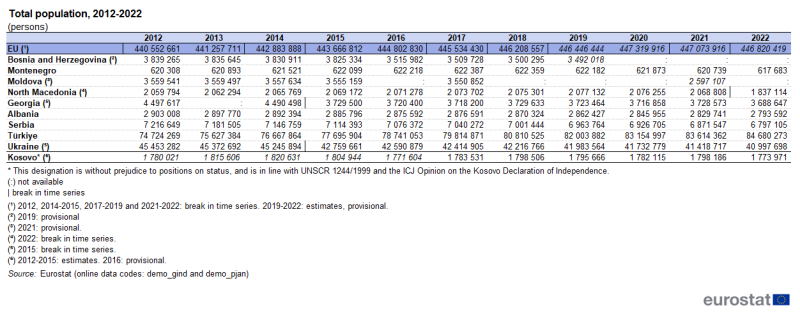
Data for the candidate countries and potential candidate, as well as the EU, on the total population by sex for the years 2012-2022 are presented in Table 1. Data on total population numbers for these years are presented in Table 2.
Over the period 2012-2022, the number of women was, in almost all cases, higher than the number of men in the EU, the candidate countries and the potential candidate. The exceptions were North Macedonia between 2012 and 2021, Albania between 2012 and 2018, Türkiye between 2012 and 2022 and Kosovo between 2012 and 2015. In 2022, women made up 51.1 % of the population in the EU, 53.6 % in Ukraine, 52.3 % in Moldova (2021 data – most recent data available), 52.0 % in Georgia, 51.3 % in Serbia, 50.9 % in Kosovo* [1], 50.6 % in Montenegro, 50.4 % in North Macedonia, 50.3 % in Albania and 49.9 % in Türkiye. In 2013 (most recent data by sex available), women represented 51.2 % of the population in Bosnia and Herzegovina.
Among the candidate countries and potential candidate, the population increased only in Türkiye between 2012 and 2022 (+13.3 %, from 74.7 million to 84.7 million). This growth was similar for both women and men, with an increase of 13.0% of the male population (from 37.5 million to 42.4 million) and of 13.6% of the female population (from 37.2 million to 42.3 million).
In contrast, the population declined relatively rapidly in Moldova, North Macedonia, Georgia, Ukraine and Bosnia and Herzegovina over the same period. The population fell from 3.6 million to 2.6 million (between 2012 and 2021 - most recent data available) in Moldova (-27.0 %), from 4.5 million to 3.7 million in Georgia (-18.0 %; break in time series in 2015), from 2.1 million to 1.8 million in North Macedonia (-10.8 %; break in time series in 2022), from 45.5 million to 41.0 million in Ukraine (-9.8 %; break in time series in 2015) and from 3.8 million to 3.5 million in Bosnia and Herzegovina (-9.0 % from 2012 to 2019, the most recent data available on total population). The decrease was lower in Serbia (-5.8 %, from 7.2 million to 6.8 million) and in Albania (-3.8 %, from 2.9 million to 2.8 million). The population was quite stable between 2012 and 2022 in Montenegro (-0.4 %, at 0.6 million) and Kosovo (-0.3 %, at 1.8 million).
Over the period 2012-2022, the EU population grew from 440.6 million to 446.8 million (+1.4 %).
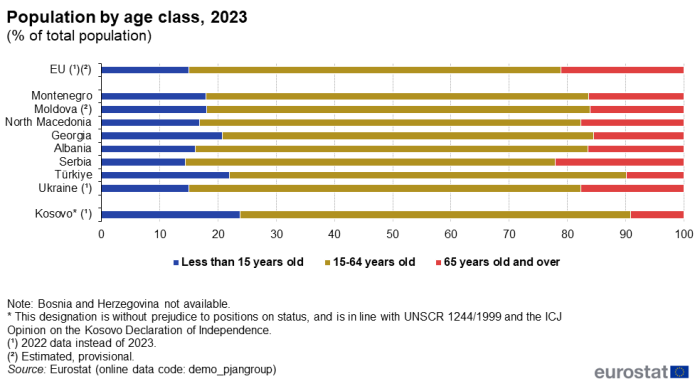
Figure 1 shows the age structure of the population of the candidate countries and potential candidate and the EU in 2023. Data are not available for Bosnia and Herzegovina.
The share of the elderly population, defined here as persons aged 65 years old and over, accounted for 9.1 % of the population in Kosovo, 9.9 % in Türkiye, 15.6 % in Georgia, 16.1 % in Moldova (estimated and provisional data), 16.4 % in Montenegro, 16.5 % in Albania, 17.6 % in Ukraine (2022 data – most recent data available), 17.7 % in North Macedonia and 22.1 % in Serbia. The elderly population was higher in Serbia than in the EU, where it made up 21.1 % of the total population in 2022 (most recent data available, estimated and provisional). For all the other candidate countries and potential candidate, the elderly population showed a lower proportion than in the EU, reflecting among other factors, greater longevity of the EU population.
At the other end of the age spectrum, the shares of young people, defined here as persons aged 15 years old or younger, in the total population of the candidate countries and potential candidate were mostly similar to the EU in 2023, with the exceptions of Georgia, Türkiye and Kosovo where the proportion of young people was higher than in the EU. The highest proportion was recorded for Kosovo, where young people made up 23.8 % of the population in 2022 (most recent data available). In Türkiye, people aged 15 years old or younger accounted for 22.0 % in 2023 while it was 20.7 % in Georgia. The share was 18.0 % (estimated and provisional) in Moldova, 17.9 % in Montenegro, 16.8 % in North Macedonia, 16.0 % in Albania, 14.9 % (2022 data – most recent data available) in Ukraine and 14.4 % in Serbia. Young people accounted for 15.0 % of the EU's population in 2023.
The EU's population is ageing, as consistently low birth rates and higher life expectancy transform the shape of its age pyramid. As a result, the proportion of people of working age in the EU is shrinking, while the relative number of those retired is expanding. This will, in turn, lead to an increased burden on those of working age to provide for the social expenditure required by the ageing population for a range of services. These issues also apply to some extent to countries that have a high proportion of persons aged 65 years or over in their populations.
Population density
Data on population density, measured in inhabitants per square kilometre, is illustrated in Figure 2. Data are not available for Bosnia and Herzegovina, Moldova, Georgia, Ukraine and Kosovo.
Among the candidate countries, Türkiye had the highest population density in 2022, at 111 inhabitants per square kilometre, close to the population density in the EU. In 2012, its population density was at 98 inhabitants per square kilometre and constantly increased over the period 2012-2022, except in 2020 where the density was the same as in 2019. Data for Serbia are available only for 2017-2019. The population density remained relatively stable in that period, from 92 in 2017 to 91 in 2018 and 2019. Between 2012 and 2021, the population density remained relatively stable in Montenegro, from 45 to 46 (it should be noted that there was a break in series in 2016) and in North Macedonia, at 83. In 2022, the population density in North Macedonia decreased substantially to 74 (it should be noted that there were breaks in series in 2016 and 2022). In Albania, the population density decreased between 2012 and 2022, from 101 to 99 (estimated data), except in 2020 when a peak was reached at 102. In the EU, the population density remained relatively stable over the same period from 107 in 2012 to 109 in 2022.
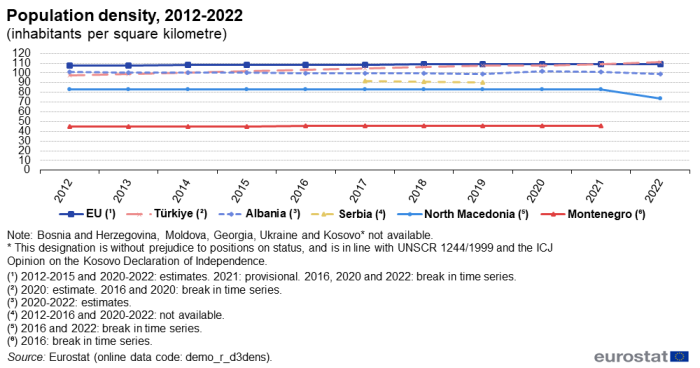
(inhabitants per square kilometre)
Source: Eurostat (demo_r_d3dens)
Annual natural population change
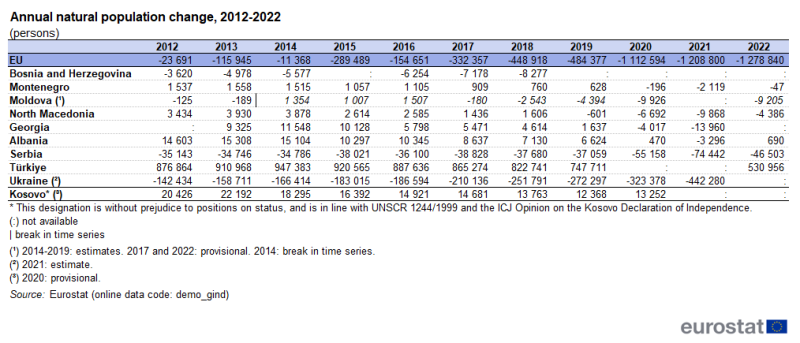
The natural population change is the difference between the number of live births and deaths during a given period, usually one year. Available data for the period 2012-2022 for the candidate countries and potential candidate, as well as for the EU, is shown in Table 3.
Across the candidate countries and potential candidate, deaths substantially exceeded live births in 2020 and 2021 during the Covid-19 pandemic, with natural population change becoming significantly more negative or turning from natural population increase to decrease. The only exceptions were Albania and Kosovo, which recorded population increases also in 2020. In Albania, the increase was only minor and much lower than the year before, while Kosovo recorded significant population growth that was somewhat higher than the previous year. Nevertheless, it should be noted that the annual natural population change across the candidate countries and potential candidate generally tended to fall in the last years before the Covid-19 pandemic.
Over the period 2012-2022, Türkiye (no data available for 2020 and 2021) and Kosovo (no data available for 2021 and 2022) recorded positive natural population change, i.e. more live births than deaths, each year. Among the candidate countries and potential candidate, the natural population growth was consistently the highest in Türkiye, with increases by more than 700 000 persons each year between 2012 and 2019, ranging from 747 711 (2019) to 947 383 (2014). Data are not available for 2020 and 2021, during the pandemic. However, in 2022, the natural population growth had fallen to 530 956 persons. In Kosovo, the natural population growth initially increased from 20 426 in 2012 to 22 192 in 2013, before decreasing year by year until an annual growth of 12 368 in 2019. Despite the pandemic, the natural population growth picked up to 13 252 in 2020 (most recent data available).
Moldova saw an uneven trend in natural population change over the period 2012-2022, with slight falls in 2012 and 2013 (-125 and -189, respectively). However, due to a break in series in 2014, these figures cannot be directly compared with later years. In 2014-2016, Moldova registered moderate positive population growth of 1 354 in 2014, 1 007 in 2015 and 1 507 in 2016, followed by increasingly negative population changes in each subsequent year (estimated data for 2014-2019; 2021 data not available). The strongest negative changes were -9 926 in 2020, during the pandemic, and -9 205 in 2022 (estimated data).
Montenegro registered natural population growth each year in the period 2012-2019, ranging between 628 (2019) and 1 558 (2013), with the growth decreasing year by year from 2016. From 2020, the annual natural population change became negative, falling to -2 119 in 2021, before picking up to just -47 in 2022. The natural population change followed a similar trend in North Macedonia, where it was positive from 2012 to 2018, ranging between 1 436 (2017) and 3 930 (2013), before turning negative in 2019 (-601) and falling to -6 692 in 2020 and -9 868 in 2021 during the Covid-19 pandemic. Although the negative natural population change in North Macedonia was almost halved to -4 386 in 2022, this recovery after the pandemic was not as strong as that observed in Montenegro.
Georgia was another country that saw natural population growth between 2013 (no 2012 data available) and 2019, prior to the Covid-19 pandemic, with growth ranging between 1 637 (2019) and 11 548 (2014). During the Covid-19 pandemic in 2020 and 2021, Georgia also recorded more deaths than live births, with negative changes of -4 017 and -13 960, respectively. In Albania, the number of live births was higher than the number of deaths over the period 2012-2019, with annual natural growth ranging from 6 624 (2019) to 15 308 (2013). In 2020, when the Covid-19 pandemic began, the natural population increase dropped to 470, before becoming negative in 2021 at -3 296. In 2022, it returned to positive change with the number of live births exceeding the number of deaths by 690.
Ukraine stood out with a strong negative natural population change throughout the period 2012-2021 (most recent data available), with deaths far outnumbering live births. Its natural population change stood at -142 434 in 2012 and fell each subsequent year, with particularly strong decreases of -323 378 in 2020 and -442 280 in 2021 during the pandemic. Serbia also showed significant negative natural population changes over the period 2012-2022, ranging between -34 746 (2013) and -38 828 (2017), falling to -55 158 in 2020 and further to -74 442 in 2021. The number of deaths were also higher than the number of live births in Bosnia and Herzegovina, ranging from -3 620 in 2012 to -8 277 in 2018 (most recent data available; no data available for 2015).
In the EU, the annual natural change was negative over the whole period 2012-2022. From 2012 to 2019, before the Covid-19 pandemic, the annual natural population change ranged between -11 368 (2014) and -484 377 (2019), reflecting the EU's aging population and moderate birth rates in several Member States. The negative change accelerated during the Covid-19 pandemic, falling to -1.113 million in 2020 and -1.209 million in 2021, and persisted at this low level (-1.279 million) in 2022.
Annual net migration
Besides the natural population change, net migration is the other factor leading to increase or decrease in the population. The annual net migration is the difference between the number of immigrants (people coming into an area) and the number of emigrants (people leaving an area). In the context of the annual demographic balance, however, net migration figures are produced by taking the difference between total population change and natural population change. This concept is referred to as 'net migration plus statistical adjustment'. The statistics on 'net migration plus statistical adjustment' are therefore affected by any statistical inaccuracies in the two components of this equation, especially corrections of total population figures, for example following a population census. From one country to another 'net migration plus statistical adjustment' may cover, besides the difference between inward and outward migration, other changes observed in the population figures between 1 January in two consecutive years which cannot be attributed to births, deaths, immigration and emigration.
Data for the candidate countries and the potential candidate, as well as the EU, is shown in Table 4 for the period 2012-2022. It should be noted that, due to breaks in time series limiting comparability over time and missing data for individual years, it is difficult to discern long-term trends for several of the candidate countries.
In Bosnia and Herzegovina, annual net migration plus statistical adjustment was reported as 244 persons in 2013, decreasing to -2 255 persons in 2017. For 2012, 2014, 2016 and 2018, net migration plus statistical adjustment was reported to be zero, while no data are available for 2015 and the period 2019-2022, possibly indicating reporting problems.
Over the period from 2012 to 2022, annual net migration plus statistical adjustment in Montenegro remained stable and consistently negative, at a level of between -930 (2013) and -952 (2012).
Estimated net migration plus statistical adjustment was relatively moderate in Moldova in 2012 and 2013, at 81 and -1 674 persons, respectively. Following a break in the time series in 2014, numbers fell to a much lower level, initially at -25 907 in 2014 and -21 293 in 2015, falling to between -41 232 (2019) and -49 408 (2017). In 2020, with international travel severely restricted during the Covid-19 pandemic, net migration plus statistical adjustment decreased to -33 405. Data for 2021 are not available. However, in 2022 the figure fell sharply to -81 766, against the backdrop of Russia's war of aggression against Ukraine, a neighbouring country of Moldova.
Net migration plus statistical adjustment in North Macedonia generally remained small and negative from 2012 to 2020, at between -934 (2012) and -161 (2016), except for small positive figures at 163 and 225 in 2017 and 2018, respectively. A major statistical adjustment in 2021 lead to a large negative value of -221 826 for net migration plus statistical adjustment in North Macedonia, corresponding to a break in series and a large shift in the population level from 2.1 million to 1.8 million as already noted in Table 2 above. In 2022, the net migration plus statistical adjustment figure returned to a more moderate level of -2 774.
In Georgia, net migration plus statistical adjustment showed a very high negative figure in 2014, at -772 546. This originated from the 2014 General Population Census results, which revealed the necessity of re-estimation of basic demographic data, resulting in a major break in the time series. In subsequent years, net migration plus adjustment in Georgia varied from positive, with 15 732 in 2020, close to zero in 2016 (176), and negative in the other years, falling to its lowest level at -25 966 in 2021 (most recent data available).
Over the period 2012-2022, net migration plus statistical adjustment in Albania ranged from -9 346 persons in 2016 to -32 853 in 2021, its lowest value, remaining roughly at the same level in 2022. Serbia reported annual net migration plus statistical adjustment equal to zero in 2013 and 2015-2021, as well as just -1 person in 2012, indicating possible reporting issues in these years. In 2014, net migration plus statistical adjustment was 2 420 persons. The figure for 2022, -109 405, reflect a major statistical adjustment following the population census 2022.
Türkiye was the candidate country with the highest net migration plus statistical adjustment, reflecting its location close to several countries experiencing civil war and natural disasters within the period covered, thus giving cause to notable refugee movements. Two consecutive breaks in series occurred in 2018, the first year when these data were based on administrative registers, and in 2019. In the period 2012-2017, before these changes, net migration plus statistical adjustment ranged between 26 251 (2012) and 186 182 (2016) persons. In connection with the change in compiling these data, the figure increased to 370 616 in 2018 and 403 404 in 2019. No data are available for 2020 and 2021. However, in 2022, net migration plus statistical adjustments stood at 68 324, a significantly lower level.
In Ukraine, net migration plus statistical adjustment was positive each year in the period 2012-2021. The highest net migration numbers were recorded in 2012 and 2013, with 61 844 and 31 913, respectively. Data for 2014 is not available, but since 2014, data for Ukraine generally exclude the illegally annexed Autonomous Republic of Crimea and the City of Sevastopol and the territories which are not under control of the Ukrainian government. The available data for the period 2015-2021 indicate a net migration plus statistical adjustment ranging between 9 316 (2020) and 21 512 (2019). Data for 2022 are not available, thus the effects of the Russian war of aggression against Ukraine on migration are not captured by the data available.
Net migration plus statistical adjustment in Kosovo fluctuated over the period 2012-2020 (most recent data available) but was mostly negative during this period. The highest value in the period was 15 159 persons in 2012, the lowest -49 732 in 2015. At the end of the period, in 2020, it stood at 2 821 persons.
From 2012 to 2022, there has been significant net migration plus statistical adjustment in the EU, with positive figures year on year. Net migration plus statistical adjustment of more than 1 million persons was recorded in 2013, 2015, 2017, 2018, 2019 and 2022. Annual numbers fluctuated between 728 741 (2012) and 1 518 409 (2013) over the years 2012-2021. However, following Russia's war of aggression against Ukraine in 2022, net migration plus statistical adjustment to the EU rose to 3.2 million persons.
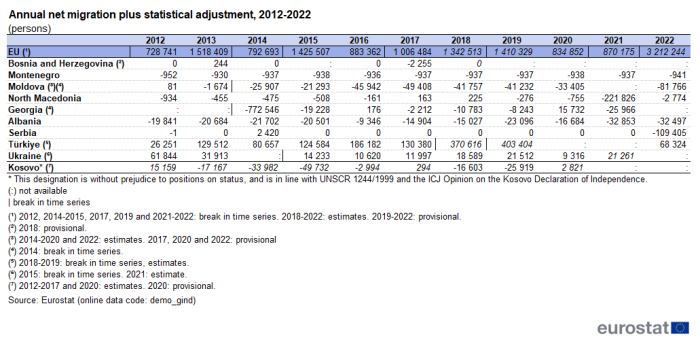
(persons)
Source: Eurostat (demo_gind)
Life expectancy at birth
Life expectancy at a certain age is the mean additional number of years that a person of that age can expect to live, if subjected throughout the rest of his or her life to the current mortality conditions. Life expectancy at birth has risen rapidly over the last century in most of the world due to advances in healthcare and medicine, linked especially to reduced infant mortality, as well as rising living standards, improved lifestyles and better education.
Figure 3 presents life expectancy at birth in 2012 and 2022 in the candidate countries and the EU. Data are not available for Bosnia and Herzegovina and Kosovo.
When comparing 2012 to 2022, life expectancy at birth increased for both males and females in Albania, Serbia and Ukraine, as well as in the EU. The highest increase was observed in Ukraine, by 2.3 years for males, from 66.1 in 2012 to 68.4 in 2019 (more recent data not available) and by 2.2 years for females between 2012 and 2019, from 76.1 to 78.3. In Albania, the life expectancy at birth increased by 1.4 years, from 76.0 in 2013 (no data available for 2012) to 77.4 in 2022, while life expectancy at birth of females increased by 0.8 years between 2013 and 2022, from 77.5 to 77.9. The life expectancy at birth of the male and female population increased both by 0.4 years in Serbia, from 72.3 to 72.7 for males and from 77.5 to 77.9 for females between 2012 and 2022.
In contrast, the sharpest decrease in life expectancy at birth was registered in Montenegro, where the life expectancy at birth of males decreased by 3.4 years between 2012 and 2021 (no 2022 data available) from 74.2 to 70.8, while life expectancy at birth for females decreased by 1.3 years from 78.3 in 2012 to 77.0 in 2021. Türkiye also recorded a substantial fall in life expectancy at birth for females between 2012 and 2022, by 2.1 years, from 80.5 to 78.4. However, life expectancy at birth of males in Türkiye decreased only by 0.5 years over the same period, from 74.8 to 74.3. In North Macedonia, life expectancy at birth for males were at 73.0 in 2012 and 71.1 in 2021 (no 2022 data available), a decrease of 1.9 years, while life expectancy at birth for females were at 76.9 and 75.5, a decrease of 1.4 years. In Georgia, the decreases were more moderate, male life expectancy at birth decreasing from 70.1 to 69.8 (-0.3 years) between 2011 and 2019 (no 2012 nor 2022 data available); female life expectancy went down from 78.6 in 2011 to 78.4 in 2019 (-0.2 years). In comparison, the life expectancy for males in the EU increased by 0.8 years, from 77.1 in 2012 to 77.9 in 2022 (estimated and provisional data). For females, life expectancy in the EU increased by 0.2 years from 83.1 in 2012 to 83.3 in 2022 (estimated and provisional data).
Source data for tables and figures (MS Excel)
Data sources
Since 2016, the candidate countries and potential candidate provide population data directly to Eurostat’s unit responsible for population and migration statistics; these data have been used in this article. The same process applies to Eurostat’s regular collection of population data from EU Member States and EFTA countries. These statistics are available free-of-charge on Eurostat’s website.
Eurostat provides a wide range of demographic data, including statistics on populations at national and regional level, as well as for various demographic factors influencing the size, the structure and the specific characteristics of these populations.
Population data for Bosnia and Herzegovina has been revised based on the 2013 census results which was released in June 2016. A break appears in the time series as the revision has not been done backwards.
Population data for North Macedonia has been revised based on the 2021 census results which was released on 30 March 2022. A break appears in the time series as the revision has not been done backwards.
Population data for Georgia is based on the 2014 General Population Census data, vital statistics data from the Public Service Development Agency (PSDA) of the Ministry of Justice, and migration data from Ministry of Internal Affairs (MIA). A break appears in the time series in 2015, as the revision has not been done backwards.
Context
Population statistics are widely used to compare statistics relating to regions or countries that are inevitably of different sizes. Population is used as the denominator to normalise these data on a per person (per capita) basis. Examples include government expenditure per person between regions; hospital beds per thousand population; school places per thousand children within a specific age range. Population statistics are used both in policy development and in discussion of its outcomes.
Population statistics are the basis for distributing seats in democratic assemblies, where these are allocated geographically.
Population statistics are also used in business decisions, both at local level and in focusing on specific age ranges.
These statistics are used to analyse population ageing and its effects on the labour force and the age dependency ratio, so informing social and employment policies.
Information concerning the current statistical legislation on population and demography statistics can be found at the following links:
While basic principles and institutional frameworks for producing statistics are already in place, the candidate countries and the potential candidate are expected to increase progressively the volume and quality of their data and to transmit these data to Eurostat in the context of the EU enlargement process. EU standards in the field of statistics require the existence of a statistical infrastructure based on principles such as professional independence, impartiality, relevance, confidentiality of individual data and easy access to official statistics; they cover methodology, classifications and standards for production.
Eurostat has the responsibility to monitor that statistical production of the candidate countries and the potential candidate complies with the EU acquis in the field of statistics. To do so, Eurostat supports the national statistical offices and other producers of official statistics through a range of initiatives, such as pilot surveys, training courses, traineeships, study visits, workshops and seminars, and participation in meetings within the European Statistical System (ESS). The ultimate goal is the provision of harmonised, high-quality data that conforms to European and international standards.
Additional information on statistical cooperation with the enlargement countries is provided in the Statistics explained background article Enlargement policy and statistical cooperation.
Direct access to
See also
- Enlargement countries — statistical overview — online publication
- Statistical cooperation — online publication
- Population and demography
- Population and population change statistics
- Population structure and ageing
Publications
- Statistical books/pocketbooks
- Key figures on enlargement countries — 2019 edition
- Key figures on enlargement countries — 2017 edition
- Key figures on the enlargement countries — 2014 edition
- Factsheets
- Basic figures on the candidate countries and potential candidates — Factsheets — 2023 edition
- Basic figures on Western Balkans and Türkiye — Factsheets — 2022 edition
- Basic figures on enlargement countries — Factsheets — 2021 edition
- Leaflets
- Basic figures on enlargement countries — 2020 edition
- Basic figures on enlargement countries — 2019 edition
- Basic figures on enlargement countries — 2018 edition
- Basic figures on enlargement countries — 2016 edition
- Enlargement countries — Demographic statistics — 2015 edition
- Key figures on the enlargement countries — Population and social conditions — 2013 edition
Database
Dedicated section
Methodology / Metadata
- Population change - Demographic balance and crude rates at national level (ESMS metadata file — demo_gind_esms)
- Population (ESMS metadata file — demo_pop_esms)
- Fertility (ESMS metadata file — demo_fer_esms)
- Mortality (ESMS metadata file — demo_mor_esms)
Notes
- ↑ This designation is without prejudice to positions on status, and is in line with UNSCR 1244/1999 and the ICJ Opinion on the Kosovo Declaration of Independence.
