This Statistics Explained article is outdated and has been archived - for recent articles on environment see here.
- Data from July 2011. Most recent data: Further Eurostat information, Main tables and Database.
This article gives an overview on the development of waste generation and treatment in the European Union (EU), the EFTA countries and the candidate countries. It refers exclusively, however, to data collected within the frame of Regulation 2150/2002 on waste statistics.
Waste, defined as “any substance or object which the holder discards or intends or is required to discard” (Directive 2008/98/EC, Article 3(1)), represents an enormous loss of resources in the form of both materials and energy. In addition, the management and disposal of waste can have serious environmental impacts. Landfills, for example, take up land space and may cause air, water and soil pollution, while incineration may result in emissions of dangerous air pollutants, unless properly regulated.
Therefore, EU waste management policies aim to reduce the environmental and health impacts of waste and improve Europe’s resource efficiency. The long-term goal is to turn Europe into a recycling society, avoiding waste and using unavoidable waste as a resource wherever possible. The aim is to prevent the generation of waste, to achieve much higher levels of recycling and to ensure the safe disposal of waste.

(1 000 tonnes) Eurostat (env_wasgen)
(%) Eurostat (env_wasgen)
(kg/cap) Eurostat (tsdpc210)
(million tonnes) Eurostat (env_wasgen)
(million tonnes) Eurostat (env_wasgen)
(kg/cap) Eurostat (env_wasgen), Eurostat (demo_gind)
(million tonnes) Eurostat (env_wasgen)
(1 000 tonnes) Eurostat (env_wastrt)
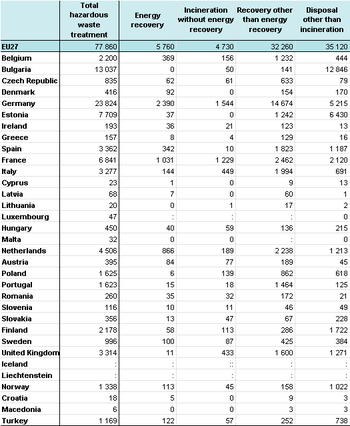
(1 000 tonnes) Eurostat (env_wastrt)
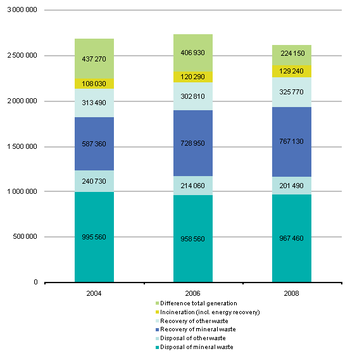
(1 000 tonnes) Eurostat (env_wastrt)

(%) Eurostat (env_wastrt)
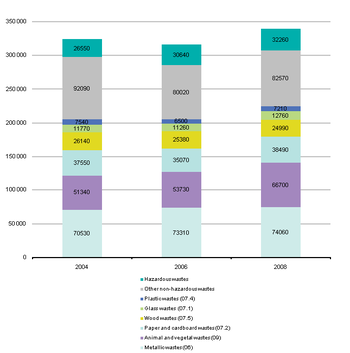
(1 000 tonnes) Eurostat (env_wastrt)

(%) Eurostat (env_wastrt)
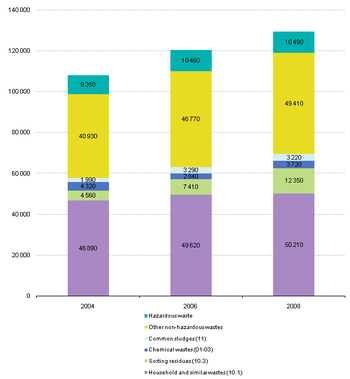
(1 000 tonnes) Eurostat (env_wastrt)
(%) Eurostat (env_wastrt)
(1 000 tonnes) Eurostat (env_wastrt)
Main statistical findings
Total waste generation
In 2008, the total generation of waste in the EU-27 amounted to 2.62 billion tonnes. This was slightly lower than in the years 2004 and 2006 where the EU-27 total amounted to 2.68 billion tonnes and 2.73 billion tonnes respectively. In 2008, 98 million tonnes or 3.7 % of the generated total were classified as hazardous waste. This means that per capita in 2008 each EU citizen produced on average about 5.2 tonnes of waste of which 196 kg were hazardous.
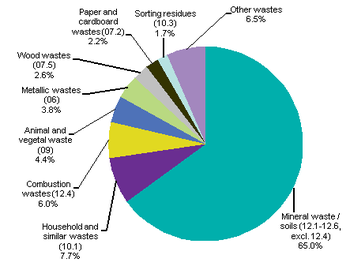
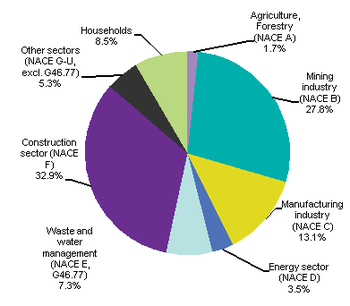
Table 1 shows the total waste generation in EU Member States, EU Candidate Countries and EFTA Countries by main economic activities (according to NACE Rev. 2). The breakdown by activity is illustrated in Figure 1. The most important sectors in terms of generated amounts are construction (NACE section F) accounting for 859 million tonnes or 32.9 % of the total, and mining (NACE section B) contributing 727 million tonnes or 27.8% to the total. In all, 97% of the waste produced in these two sectors, or 1.53 million tonnes respectively, was mineral waste or soils (excavated earth, road construction waste, demolition waste, dredging spoil, waste rocks, tailings, etc). This explains the high share of mineral waste and soils, 65% in relation to total waste produced (Fig. 3) and 41 % in relation to total hazardous waste produced. The manufacturing industry (NACE section C) accounted for 343 million tonnes or 13.1 % of the total waste generated. Households contributed 221 million tonnes or 8.5 %. 191 million tonnes or 7.3 % of the total originated from the NACE section E (incl. G46.77) which comprises water supply, wastewater treatment, and waste recovery and disposal. 91 million tonnes of waste (3.5 %) resulted from energy production (NACE section D), 86 million of which were combustion waste. The share of waste from agriculture, forestry and fishery (NACE section A) was low because the considerable amounts of manure and slurry are not counted as waste when they are reused in agriculture as fertiliser or soil improver.
The variation of waste generated across the countries was considerable (see Figure 2), ranging from 660 kg/cap in Latvia up to 37,528 kg/cap in Bulgaria. The huge variation can be explained to a large extent by differences in the economic structure. In some cases, differences in data coverage or other methodological aspects caused the variation.
Figure 2 illustrates that the amount of mineral waste and soils, the share of which is shown separately in the graph, accounts to a high degree for the variation across countries. The highest waste generation per inhabitant was reported by Bulgaria due to enormous amounts of mineral waste from the mining industry. Bulgaria extracts coal and lignite, metallic minerals (e.g. iron, manganese, copper, chromium, zinc) and non-metallic minerals, mostly by open-pit excavation. In 2008, mineral wastes from the Bulgarian mining industry amounted to 268 million tonnes or 93.5 % of the Bulgarian waste total and accounted for about 10 % of the EU-27 total.
Similar to Bulgaria, high amounts of mineral waste are generated by the mining industry in Romania, Sweden, Finland and Estonia accounting for 73 %, 68 %, 39 % and 37 % respectively of the national waste. In Luxembourg, mineral waste from the construction sector has dominated in recent years accounting for 70 % to 85 % of the total waste generated. In 2008, this equated to 17 tonnes per capita, by far the highest waste generated in the construction sector (NACE section F) of all EU Member States.
The breakdown of the total waste arising by waste categories is shown in Figure 3. The waste categories referred to are based on the statistical nomenclature EWC-Stat, version 3.
Besides the 65 % of mineral waste and soils, the category of household and similar waste was most important amounting to 202 million tonnes or 7.7 % of the generated total. The major part of this category was generated by households (72 %) and by the service sector (19 %). The category includes mixed municipal waste, bulky waste and street-cleaning residues.
Non-mineral waste generation
Non-mineral waste represents about 35 % of the total waste generated and reflects the general development of waste generation in the countries more accurately than the total including mineral mass waste and soils.[1] Consequently, the generation of non-mineral waste per capita is used as an indicator for the development of waste generation within the set of Sustainable Development Indicators (SDI tsdpc210).
In 2008, the total generation of non-mineral waste in the EU amounted to 919 million tonnes, compared with 954 million tonnes in 2006 and 956 million tonnes in 2004. This indicates a decrease of about 37 million tonnes or 3.8 % compared with 2004. Accordingly, the indicator also fell from 1 951 kg/cap (2004) and 1 931 kg/cap (2006) to 1 843 kg/cap in 2008.
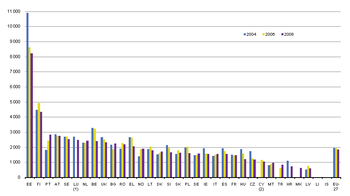
The country-specific amounts per capita for the years 2004, 2006 and 2008 are shown in Figure 4, sorted by decreasing values for 2008. The indicator values for 2008 range between 606 kg/cap in Latvia and 8 216 kg/cap in Estonia.
The high amount of waste (8 216 kg/cap) in Estonia is mainly due to large quantities of hazardous combustion waste from the energy sector (ca. 3 900 kg/cap) and hazardous chemical deposits and residues from the refinery sector (ca. 1 000 kg/cap). Both originate from the refinery and incineration of oil shale, which also explains the high share of hazardous waste within the generated non-mineral total (see Figure 7). Additionally, the considerable amounts of non-hazardous wood waste (ca. 770 kg/cap) from the wood-processing industry contribute to the high Estonian total.
In Finland, it is wood waste originating from wood processing, manufacture of pulp and paper and forestry that leads to a waste generation clearly above the EU average. Non-hazardous wood waste amounted to 2 340 kg/cap in Finland in the year 2008.
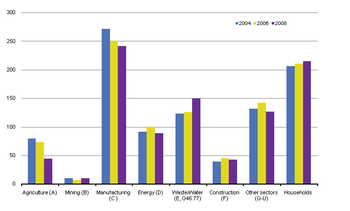
Figure 5 shows the origin and development of the non-mineral waste by economic activity from 2004 to 2008 for the EU-27 aggregate. Due to the exclusion of mineral waste and soils, the construction and the mining sector contribute only low shares to the total non-mineral waste. As a result, the developments of the other sectors become more visible.
About a quarter of the non-mineral waste covered by the indicator was generated in the manufacturing industries. The respective amounts have decreased by about 30 million tonnes from 273 million tonnes in 2004 to 242 million tonnes in 2008. Waste from the sector households accounted for 215 million tonnes in 2008 and has shown a slight and steady increase since 2004.
The drop of waste generation in NACE section A by about 35 million tonnes of waste reflects a change in data coverage rather than a real decrease of waste. Some countries excluded the amounts of manure and slurry that were reused in agriculture in 2008 while these amounts were included in the previous reference years. Also in 2008, because of a change in classification, other countries excluded specific waste types (now classified as by-products), reported in former years.
The increase in the sector waste and waste management (NACE E and G46.77) of 26 million tonnes results from higher amounts of sorting residues, metallic wastes, combustion wastes and sludges. The changes from 2006 to 2008 in the NACE sections D and E/G46.77 can also partly be due to the transition from NACE Rev.1.1 to NACE Rev.2.[2] The waste generated in the other sectors (NACE B, F, and G-U) remained basically at the level of 2004.
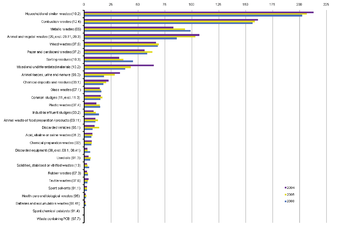
Figure 6 shows the breakdown of the non-mineral waste total by waste category and the development over time. The most important waste categories in terms of quantity in 2008 are household and similar wastes at 202 million tonnes and combustion wastes at 157 million tonnes. For both waste categories the figures show a slight and steady decrease. The seemingly strong decrease of animal and vegetal wastes is largely caused by changes in data coverage for manure as outlined above. Metallic wastes, on the other hand, show a considerable increase and amounted to 99 million tonnes in 2008.
Further significant changes in quantities can be observed for the category mixed and undifferentiated wastes (decrease by close to 27 million tonnes since 2004) and for sorting residues (increase by 13 million tonnes since 2004). It is assumed that the strong decrease of mixed and undifferentiated waste reflects the improved and more specific waste classification in some countries. The considerable increase of sorting residues by 13 million tonnes (39 %) compared with 2004 corresponds well to the progress in separate waste collection and waste treatment in many European countries.
Hazardous waste generation
Hazardous waste represents only a minor share of the total waste generated in the EU-27, but may pose a risk to human health and the environment if not managed and disposed of safely. In 2008, 98 million tonnes or 3.7 % of the generated total were classified as hazardous waste compared with 89 million tonnes (3.3 %) in 2004 and 101 million tonnes (3.7 %) in 2006.
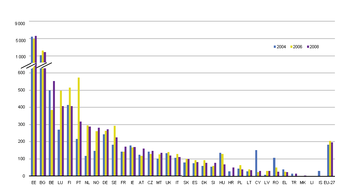
Figure 7 shows the country-specific hazardous waste amounts per capita for the period 2004 to 2008, sorted by descending order of the values for 2008. Note that the figures include all hazardous waste categories, including minerals. An extremely high amount of hazardous waste of 5 623 kg/cap was reported by Estonia, the origin of which has been explained in the previous section. The high amount of hazardous waste in Bulgaria (1 711 kg/cap) is generated mainly by one mining company that processes copper ore and produces huge amounts of hazardous tailings.
Disregarding the specific cases of Estonia and Bulgaria, the hazardous waste generation in the EU Member States ranged in 2008 from 23 kg/cap in Greece to 553 kg/cap in Belgium.
For several countries the time series varies considerably. The analysis of the data indicates that the variation of hazardous waste generation over time and across countries is (again) strongly influenced by the waste categories ‘mineral waste’ (EWC-Stat 12.1-12.3, 12.5) and ‘contaminated soils and polluted dredging spoils’ (EWC-Stat 12.6) the generation of which can vary largely depending on infrastructure or larger soil remediation projects, economic structure and economic development (see also section 1.2).
Changes in the mineral waste and contaminated soils are thus the reason for the fluctuations of the hazardous waste indicator in several countries. This applies, for instance, to the considerable changes of the indicator values in Belgium, Luxembourg, the Netherlands, Hungary and Romania. The high amounts of hazardous waste reported by Portugal for the year 2006 should be considered with caution; waste generation for 2006 may be considerably overestimated due to conversion problems and difficulties with a new reporting system introduced in 2006.
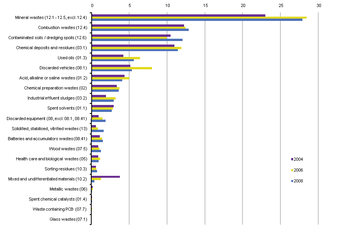
The breakdown of hazardous waste by waste category for the EU-27 is shown in Figure 8 for the years 2004 to 2008. The most important waste categories in 2008 were mineral wastes (28.6 %), combustion wastes (13.2 %), contaminated soils and dredging spoils (12.3 %) and chemical deposits and residues (11.8 %). Used oils and discarded vehicles accounted for 5.7 % and for 5.5 % respectively. Further waste categories with a share over 3 % were acid, alkaline and saline wastes (4.2 %) and chemical preparation wastes (3.7 %). All other waste categories contributed together 14.9 % to the hazardous waste total.
The graph shows significant variations for the waste categories mineral wastes and contaminated soils / polluted dredging spoils between 2004 and 2008 for the reasons already mentioned above.
Significant and continuous reductions were reported for the waste category ‘mixed and undifferentiated waste’ (EWC-Stat 10.2). The decreasing amounts for this waste category indicate an improvement of waste classification, i.e. a better assignment of wastes to the other (more specific) waste categories. The overall decrease of mixed and undifferentiated waste is mainly due to data improvements in the United Kingdom which reported high amounts of unspecified wastes in 2004 and 2006. Several other countries also reported decreasing amounts of this waste category but have, on account of their size, a lower impact on the EU totals.
The generation of hazardous discarded vehicles increased by 2.9 million tonnes to 8 million tonnes from 2004 to 2006 and dropped by 2.7 million tonnes to 5.4 million tonnes in 2008, which is 5.5 % above the level of 2004. This variation is mainly due to methodological changes in a few larger countries. Data collection and compilation for this waste category are obviously not yet settled.
The fluctuations of the waste oil amounts are very likely related to overestimations in one country for the year 2006. The total amount reported for 2006 should be considered as an outlier.
Waste treatment
In 2008, a total of 2.39 billion tonnes of waste was treated in the EU Member States. This amount includes the treatment of wastes imported into the EU and excludes the amounts of waste that were sent to non-EU countries for recovery or disposal. About 73 % of the treated waste was mineral wastes and soils (EWC-Stat 12).
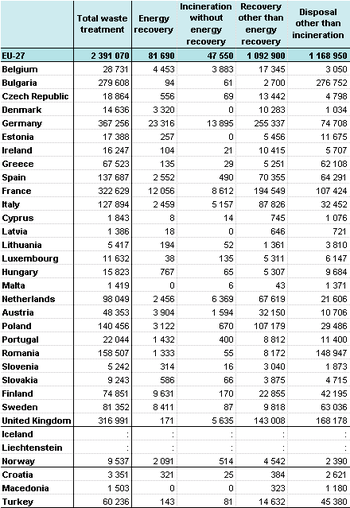
Table 2 presents the total amounts of waste treated in 2008 by country and treatment operation. The data on the treatment of hazardous waste are shown in the same structure in Table 3.
In 2008, 1.17 billion tonnes or 49 % of EU-27 total were subject to disposal operations other than waste incineration (referred to in the following as landfilling). About 97 % of this amount was disposed of at dedicated landfills or, as far as mining waste is concerned, on heaps, ponds or other dedicated installations in the mining facilities. Other disposal operations covered like ‘land treatment (D2)’ or ‘discharge into water bodies (D6, D7)’ are applied to a significant extent only in a few countries, in particular in the Netherlands and the United Kingdom which together disposed of about 32 million tonnes of common sludges by one of these disposal operations.
Another 1.1 billion tonnes or 46% of the treated waste were sent to recovery operations other than energy recovery (referred to in the following as recovery).
In 2008, incineration with or without energy recovery accounted for 5 % or 129 million tonnes of the treated waste.
The development of waste treatment for the EU-27 in the period from 2004 to 2008 is illustrated in Figure 9. The figure shows for each reference year the breakdown by treatment categories and specifies the mineral part of the treated waste. In addition, the figure shows the difference between the total waste amount treated and the total waste amount generated.
The total amounts treated have increased by 146 million tonnes or 6.5 % from 2004 to 2008. As a result, the difference between the treated waste total and the generated waste total constantly decreased. Although the comparison of data over time still has its limitations, the data seem to confirm some general trends in European waste management: Whereas the disposal of waste shows a decreasing trend between 2004 and 2008, increasing amounts of waste were incinerated or recovered.
Compared with 2004, waste disposal other than incineration in 2008 was lower by about 67 million tonnes or 5 %. The disposal of non-mineral waste decreased by 39 million tonnes (16 %) while the disposal of mineral waste declined by 28 million tonnes (3 %).
In the same period, waste recovery showed a significant growth of 192 million tonnes or 21 % respectively, mainly due to the rise of mineral waste recovery by 180 million tonnes (31 %). The recovery of non-mineral wastes showed an increase of 12 million tonnes or 4 % between 2004 and 2008.
The amounts incinerated with or without energy recovery have gone up by 21 million tonnes or 20 %. Each of the three treatment categories is represented in more detail in the following sections.
Recovery
Figure 10 shows the breakdown of the total amount of 1.1 billion tonnes of waste recovered in the EU in 2008 by waste categories. Figure 11 illustrates the development of recovery by waste categories in the period from 2004 to 2008, excluding the huge mass of non-hazardous mineral waste for better readability of the graph.
In 2008, the recovery of non-hazardous mineral waste originating mainly from construction and mining activities amounted to 754 million tonnes and represented 69 % of the total waste recovered. Mineral waste recovery has shown a strong growth in recent years, having increased from 2004 to 2008 by 177 million tonnes or 31 %.
Among the other waste categories, animal and vegetal wastes (EWC-Stat 09) show the clearest trend, i.e. a strong growth by about 15 million tonnes or 30 % since 2004. The recovery of animal and vegetal wastes (EWC-Stat 09) amounted to 67 million tonnes or 6.1 % of the total waste recovered in 2008. The recovered animal and vegetal wastes consist mainly (at about 90 %) of vegetal wastes from agriculture and forestry, from food processing and from households. The remaining 10 % cover animal waste from food processing, and manure and slurry. It is important to note that manure and slurry are only covered by waste statistics if they are treated in waste treatment facilities, e.g. in biogas plants. The huge amounts that are reused in agriculture are not reported as wastes.
For metals, paper and cardboard, glass and plastic wastes, which are the most common recyclable materials, one would expect a clear growth as a result of the implementation of European waste legislation on landfills (diversion of biodegradable waste) and producer responsibility (separate collection and recovery of packaging waste, waste electrical and electronic equipment, end-of-life vehicles). In fact, the recovered amounts show only a comparably slow growth or, in case of plastic wastes, even a decrease compared with 2004. This is assumed to result from the increasing amounts of exports of recyclables to extra EU-countries that are not covered by waste statistics.
The recovery of metal waste amounted to 74 million tonnes in 2008 or 6.8 % of the total waste recovered and thus showed a slight increase. The recovery of paper and cardboard waste fluctuates over the years. In 2008, 38.5 million tonnes of paper and cardboard waste were recovered in EU Member States which was slightly higher than in 2004 and accounted for 3.5 % of the total recovery. The recovered amounts of glass and plastic wastes in 2008 amounted to 12.8 million tonnes (1.2 %) and 7.2 million tonnes (0.7 %) respectively. The recovery of wood waste has slightly decreased and amounted to about 25 million tonnes, or 2.3 % of the total recovery 2008.
The waste category ‘other non-hazardous wastes’ which includes materials like waste tyres, textiles, common sludges and chemicals contributed 82.6 million tonnes or 7.5 % to the total waste recovered in 2008.
The recovery of hazardous waste shows an increasing trend and amounted to 32.3 million tonnes in 2008, representing a share of 3 %.
Incineration (incl. energy recovery)
The data presented in this section cover incineration with and without energy recovery. Figure 12 shows the breakdown of the incinerated waste by category for the year 2008. 52 million tonnes or 38.8 % of the incinerated total was household and similar waste. Sorting residues accounted for 12.4 million tonnes (9.5 %), non-hazardous chemical wastes for 3.7 million tonnes (2.9 %) and common sludges for 3.2 million tonnes (2.5 %). Hazardous waste accounted for 10.5 million tonnes or 8.1 % of the total. The remaining share of about 38 % cannot be further specified by material due to the limited breakdown required by the Waste Statistics Regulation. This share includes for instance wood waste and other biomass waste which are likely to account for a significant and increasing share of the incinerated waste.
The development 2004 to 2008 of waste incineration by waste categories is illustrated in Figure 13. As mentioned above, the total amount of incinerated waste has steadily increased between 2004 and 2008 by 21 million tonnes (19.6 %) and amounted to 129 million tonnes in 2008. Half of the total increase (10.5 million tonnes) can be attributed to Germany where the implementation of the landfill ban for untreated municipal waste has led to a considerable increase in energy recovery from waste.
The highest growth was reported for the category ‘other non-hazardous waste’ with an increase of 8.5 million tonnes and for sorting residues with an additional 7.8 million tonnes being incinerated. The incineration of sorting residues, which include refuse-derived fuel (RDF) from the mechanical treatment of waste, has thus nearly tripled since 2004 and amounted to 12.4 million tonnes in 2008. The incineration of household and similar waste has risen by 3.3 million tonnes or 7.1 % in the considered period. The incineration of common sludges also shows an increasing trend and amounted to 3.2 million tonnes in 2008. The amounts of hazardous waste remained basically at the same level of around 10 million tonnes per year.
Landfilling (incl. land treatment)
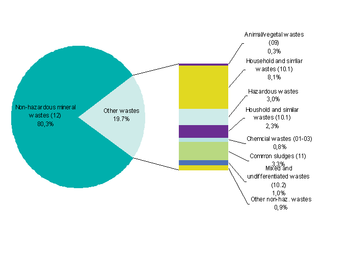
Figure 14 shows the breakdown of the landfilled waste amounts by waste categories for the year 2008. The major part of the landfilled waste was non-hazardous mineral waste with a share of about 80 %. Household and similar wastes account for 8.1 %. Further relevant fractions are common sludges (incl. dredging spoils) (3.3 %) and sorting residues (2.3 %). Hazardous waste (including mineral hazardous waste) accounted for 3.0 % of the amounts landfilled.
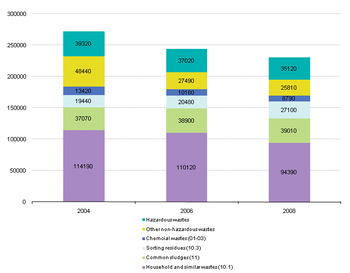
Figure 15 shows the amounts landfilled from 2004 to 2008 by main waste categories. The figures show a steady decrease for non-mineral wastes going to landfills or other disposal operations. The disposal of household and similar waste has declined between 2004 and 2008 by 19.8 million tonnes or 17.3 % amounting to 94 million tonnes in 2008. This decrease is assumed to reflect the trend towards separate collection and pre-treatment of household and similar waste as required by the Directive 1999/31/EC on landfills. Consequently, the disposal of sorting residues has increased by 7.7 million tonnes in the same period to a total of 27 million tonnes.
The figures also indicate a steady decrease of the disposal of hazardous wastes and of non-hazardous chemical wastes. The reduction of hazardous waste has to be considered carefully as the figures include a high share of mineral waste from a few big companies and may thus change considerably from one reporting period to another.
The reduction of other non-hazardous wastes by 22.6 million tonnes in the period from 2004 to 2008 is most likely the result of a more accurate waste classification (see also sections 1.3 and 1.4).
The amount of common sludges and dredging spoils (EWC-Stat 11) that are disposed of show a slight increase.
Data sources and availability
In order to monitor the implementation of waste policy, in particular compliance with the principles of recovery and safe disposal, reliable statistics on the production and management of waste from businesses and private households are needed. In 2002, the Regulation (EC) 2150/2002 on waste statistics was adopted, creating a framework for harmonised Community statistics on waste.
Starting with the reference year 2004, the Regulation requires the EU Member States to provide data on the generation, recovery and disposal of waste every two years. Thus, the Regulation on waste statistics replaces the Eurostat/OECD Joint Questionnaire as the main source of European waste data. Whereas reporting by the Joint Questionnaire was voluntary, the provisions of the Regulation are binding in law.
With the data delivery for 2008, data on waste generation and treatment are now available for the period from 2004 to 2008, and with the extension of the time series the data become increasingly useful, e.g. for building indicators and for use in the field of Environmental Accounts. At the same time, it has to be mentioned that differences in data coverage across countries and methodological changes in individual countries may still have a significant impact on the comparability of waste statistics and on the time series, in particular at national level.
Context
The EU’s sustainable development strategy and its Sixth Environment Action Programme, which identifies waste prevention and management as one of four top priorities, underline the relationship between the efficiency of resources and waste generation and management. The objective is to decouple the use of resources and generation of waste from economic growth, while sustainable consumption should not exceed environmental capacity.
The EU’s approach to waste management is based on three principles: waste prevention, recycling and reuse, and improving final disposal and monitoring. Waste prevention can be achieved through cleaner technologies, eco-design, or more eco-efficient production and consumption patterns. Waste prevention and recycling, focused on materials technology, can also reduce the environmental impact of resources that are used through limiting raw materials extraction and transformation during production processes. Where possible, waste that cannot be recycled or reused should be safely incinerated with landfills only used as a last resort. Both these methods need close monitoring because of their potential for causing severe environmental damage.
Further Eurostat information
Publications
- Generation and treatment of municipal waste (SiF issue number 31/2011)
- Energy, transport and environment indicators pocketbook
- Environmental Statistics and Accounts in Europe, Chapter 3 Waste (2010)
- Waste generated and treated in Europe – data 1995-2003
Main tables
- Waste statistics
Database
- Environment, see:
- Waste Statistics
- Waste generation and treatment (env_wasgt)
Methodology/Metadata
- ESMS metadata file (env_wasgt_esms)
Source data for tables and figures (MS Excel)
Other information
- Environmental Data Centre on Waste
- Regulation 2150/2002 of 25 November 2002 on Waste Statistics
- Thematic strategy on the prevention and recycling of waste
External links
- European Commission - DG Environment - Waste in the EU
- European Environment Agency - Waste and material resources
See also
- Environment and economy
- Greenhouse gas emissions from waste disposal
- Municipal waste statistics
- Packaging waste statistics
- Waste shipment statistics
Notes
- Non-mineral waste refers to the sum of all waste categories excl. mineral wastes (12.1-12.3, 12.5), non-hazardous dredging spoils (11.3) and contaminated soil and polluted dredging spoils (12.6). Although completely or partly mineral, the indicator explicitly includes combustion wastes (EWC-Stat 12.4) and solidified, stabilised and vitrified wastes (EWC-Stat 13); see also the definition of the Sustainable Development Indicator on non-mineral waste generation. ↑
- Until reference year 2006, the sector 'water supply' was reported together with the energy sector (NACE Rev.1.1, section E). Since 2008, NACE Rev.2 applies and the energy sector builds an own section (section D) whereas the ‘water supply’ is reported together with sewerage and waste management in section E. ↑


